
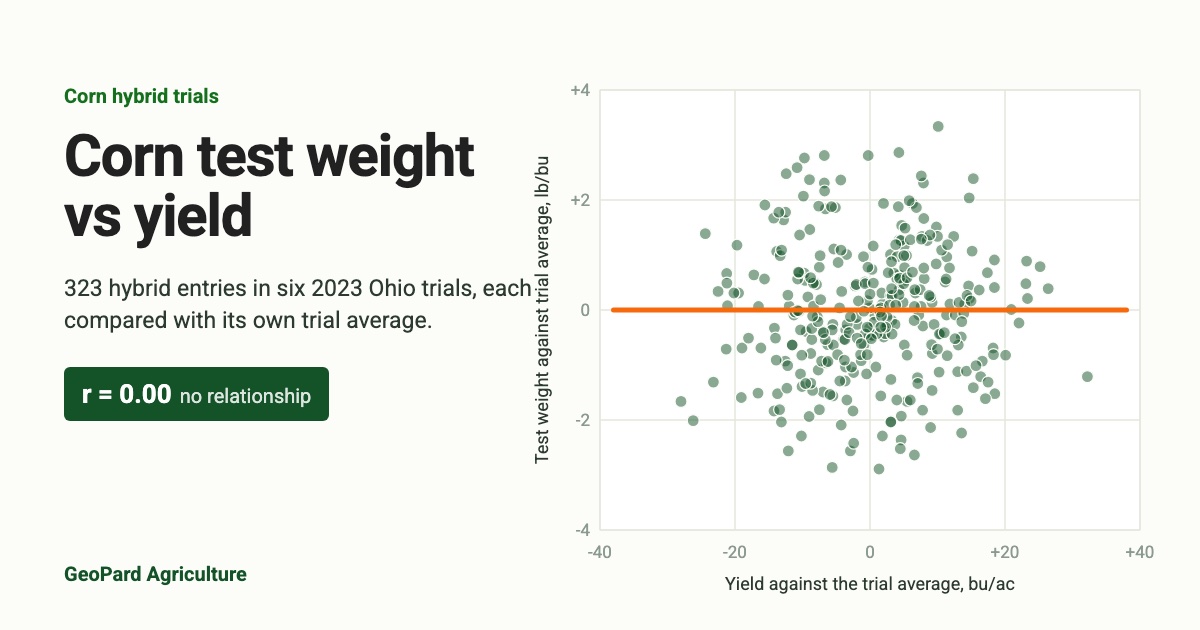


Corn test weight tells you how heavy a bushel of grain is, not how many bushels the field made. Across university hybrid trials, the link between test weight and yield is weak and often missing: in the 2023 Ohio Corn Performance Test, 323 hybrid entries show no relationship at all once each trial is compared on its own terms. Charts that show a rising line from light, low-yielding corn to heavy, high-yielding corn usually mix environments, harvest dates or moisture levels. Here is what the data shows, what actually moves test weight, and what a low reading costs you at the elevator.
What is corn test weight?
Test weight is the weight of a fixed volume of grain: a Winchester bushel of 1.244 cubic feet, reported in pounds per bushel. It is a density measure. Kernel size, shape, starch fill and how smoothly kernels pack all change how many pounds fit in that volume.
It is not how corn is paid for. US corn is bought on a standard 56-pound bushel at 15 to 15.5 % moisture, whatever the test weight. A truck of 52-lb grain still sells by weight. Its 1,000 volume bushels simply count as about 929 market bushels.
Test weight matters through grading. The US grade standards for corn set these minimums for yellow corn:
- US No. 1: 56.0 lb/bu
- US No. 2: 54.0 lb/bu, the usual contract grade
- US No. 3: 52.0 lb/bu
- US No. 4: 49.0 lb/bu
- US No. 5: 46.0 lb/bu
Below No. 2, most buyers discount. Above it, you rarely get a premium.
Does higher corn test weight mean higher yield?
No, not in any reliable way. Purdue extension has tested this for years. Dan Quinn’s 2024 review of Purdue trials at West Lafayette and Wanatah, with large nitrogen rate and hybrid differences, found trend lines with R² values of 0.06, 0.02 and 0.07. Test weight explained 2 to 7 % of the yield differences. Bob Nielsen’s long-running Purdue summary on grain test weight reaches the same conclusion from Kansas and Ohio hybrid data: there is little evidence that test weight is strongly related to yield, and stressed fields sometimes post higher test weight than healthy ones.
We ran the same check on a bigger public set: the six regional trials of the 2023 Ohio Corn Performance Test from The Ohio State University. Each entry is a hybrid averaged over two to four sites, three replications each, with yield at 15.5 % moisture, harvest moisture and test weight at field moisture.
Yield 0 bu/ac, moisture 0 %
Test weight 0 lb/bu
Trial averages and correlations
| Trial | Entries | Yield, bu/ac | Moisture, % | Test weight, lb/bu | r, yield and test weight | r, moisture and test weight |
|---|---|---|---|---|---|---|
| Southwest and central, early | 56 | 296 | 20.5 | 55.4 | -0.07 | -0.63 |
| Southwest and central, full season | 53 | 300 | 21.6 | 55.1 | 0.33 | -0.73 |
| Northwest, early | 35 | 260 | 19.0 | 55.6 | -0.21 | -0.34 |
| Northwest, full season | 74 | 263 | 21.2 | 54.5 | 0.02 | -0.63 |
| North central and northeast, early | 38 | 271 | 22.4 | 53.6 | -0.28 | -0.70 |
| North central and northeast, full season | 67 | 270 | 25.7 | 52.5 | 0.05 | -0.53 |
| All six | 323 | 277 | 22.0 | 54.4 | 0.21 | -0.77 |
Source: 2023 Ohio Corn Performance Test, The Ohio State University. Regional averages per hybrid; test weight measured at harvest moisture; one entry without a regional average left out.
Three things stand out:
- Pooled, there is a slope. All 323 entries together give r = 0.21. That is the shape a county harvest chart tends to show: a line climbing gently from the lower left.
- Inside each trial, it falls apart. Per trial, r runs from -0.28 to +0.33, two of the six are negative, and the strongest positive one still explains about 11 % of the spread. Compare each hybrid with its own trial's average and r drops to 0.00.
- Moisture explains much more. Within the same trials, harvest moisture and test weight correlate at r = -0.59. Each extra point of moisture at harvest came with about 0.6 lb/bu less test weight across hybrids, and up to 1.1 lb in the southwest full-season trial.
The pooled slope comes from the environments, not the hybrids. The north central and northeast full-season trial came off at 25.7 % moisture and averaged 52.5 lb/bu. The southwest early trial came off near 20.5 % and averaged 55.4 lb. Put the two on one chart and you get a trend that no single hybrid comparison supports. A county report that mixes planting dates, maturities and harvest days has the same problem, just with fewer points.
What actually moves corn test weight
If yield does not drive it, what does? The extension literature points to a short list:
- Grain moisture at the time of the reading. Wet kernels are bigger and rougher, so fewer pounds fit in the kettle. Test weight rises as grain dries. South Dakota State puts the gain at 0.25 to 0.50 lb/bu per point of moisture removed. North Dakota State uses about 0.25 lb per point for corn dried in a high-temperature dryer, less with harvest damage or rough drying.
- Maturity and how grain fill ended. Starch fill stops at black layer. Anything that kills the plant early, like frost, foliar disease or drought, leaves lighter, less dense kernels. In the 2023 Ohio trials, tar spot killed some hybrids before black layer and a few were frost-killed. At several sites the hit showed up mainly in test weight, not yield.
- Hybrid kernel traits. Kernel shape, hardness and pericarp smoothness differ by genetics. This is the real hybrid effect, and it is why test weight still belongs on a hybrid scorecard, next to yield.
- Ear rots and kernel damage. Ear molds produce light, chaffy kernels. Broken kernels and fines pack differently and lower the reading.
- Kernel size. Smaller kernels can pack more tightly, so a lower-yielding crop with small kernels can post a higher test weight than a high-yielding crop with large ones.
One caution on drying. Iowa State points out that the test weight gained in the dryer does not add pounds to sell. You still pay for the water removed through shrink. Drying improves the grade, not the weight.
What low corn test weight costs at the elevator
Discounts are local, so check your buyer's current schedule. A common Iowa schedule, published by Iowa State University Extension, charges 1 cent per bushel for each pound from 54 down to 52, 2 cents per pound from 52 to 50, and 3 cents per pound below 50. Most elevators do not discount above 54 lb, and few pay a premium for heavy grain.
Put that against yield. A hybrid at 52.5 lb loses 1.5 cents a bushel. At 255 bu/ac and $4.20 corn, that is about $3.80 an acre, less than one bushel of yield. Change the numbers below to your own schedule and hybrids.
Grades: US standards for yellow corn, test weight minimums only (No. 1 56 lb, No. 2 54, No. 3 52, No. 4 49, No. 5 46). Default discounts: the common Iowa schedule published by Iowa State University Extension.
The direct discount is usually small. The real costs of light grain sit elsewhere:
- Storage. Bins are sized in volume. At 52 lb a 10,000-bushel bin holds about 9,290 market bushels; at 58 lb it holds about 10,360. That gap is roughly 10 % of your storage plan.
- Freight. A truck that fills by volume before it reaches its weight limit hauls fewer paid bushels per trip.
- Drying and shrink. Light test weight often goes with high harvest moisture, and drying costs grow with every point removed.
- Storability. Light, immature or moldy grain keeps less well. Store it for less time and sell it first.
So pick hybrids on yield at 15.5 % and on harvest moisture first. Use test weight to break ties and to spot hybrids that lose test weight under late-season stress.
How to use corn test weight in hybrid and field decisions
Test weight is measured on a load, not mapped across the field. The combine does map the closest thing to it: grain moisture, point by point. That layer, plus yield, carries most of what test weight would tell you.
A practical workflow in GeoPard:
- Import yield and moisture from the combine. Connect John Deere Operations Center or upload the files, then clean the yield data so flow delay and headland passes do not show up as fake hot spots.
- Map harvest moisture next to yield. Wet patches at harvest point to late planting, late maturity or early plant death. Those are the zones most likely to deliver light grain. You can look at both layers in the browser with the Field Data Explorer.
- Check late-season imagery. Early senescence from disease or drought shows up in late August and September satellite scenes, weeks before harvest. Fields or zones that browned early are candidates for harvesting first, drying separately or selling early.
- Compare hybrids in replicated strips, not one plot. A single side-by-side tells you little, as the Ohio data shows. Set up an on-farm trial with repeated strips, then compare yield and harvest moisture by strip after harvest. Add the elevator test weight per hybrid if you segregate loads.
- Feed it back into placement. Hybrids that hold test weight under stress belong on the zones where late-season stress keeps showing up. Yield maps from several seasons show where those zones are.
Treat the numbers as inputs to a local decision. Discount schedules, drying costs and hybrid ratings differ by region and buyer, so check rates with your elevator and your agronomist.
FAQ
Is high test weight a sign of a high-yielding hybrid?
No. In university trials test weight explains only a few percent of yield differences between hybrids, and within the 2023 Ohio trials the relationship was zero. Pick on yield at 15.5 % and harvest moisture, then use test weight as a secondary trait.
Why is my test weight low when my yield was good?
The most common reasons are high harvest moisture, grain fill cut short by frost or foliar disease, and ear rots. A reading taken on wet grain at the combine will also rise once the grain is dried.
Does drying raise corn test weight?
Yes, by roughly 0.25 to 0.5 lb/bu per point of moisture removed, depending on how gently the grain is dried and how damaged it is. It does not add weight to sell. You still lose the water weight through shrink.
Does test weight change the bushels I get paid for?
Only through discounts. Corn is paid on a 56-lb bushel at standard moisture, so a load is paid by weight whatever its test weight. Below 54 lb most buyers apply a discount per bushel; the calculator above shows what that costs per acre.
Can I map test weight across a field?
Not directly; yield monitors measure grain flow and moisture, not density. Harvest moisture, late-season imagery and yield maps from several seasons are the practical stand-ins, and they show where to expect light grain before the first load reaches the scale.
Yield







 English
 German
 Ukrainian
 French
 Kazakh
 Portuguese
 Spanish
 Arabic
 Swedish
 Serbian
 Romanian
 Norwegian
 Finnish
 Lithuanian
 Estonian
 Latvian
 Croatian
 Slovenian
 Slovak
 Japanese
 Polish
