
GeoPard Academy
GeoPard Academy
Precision ag certification, earned on your own fields.
Every module ends with something that exists in your GeoPard account afterwards, first on the Virtual Farm, then on your own field. GeoPard issues the certificate, and anyone can verify it.
✓Your fields benchmarked
✓A graded Virtual Farm
✓GeoPard and Planet included
How it works
0
Day 0 benchmark
Outline your fields or connect John Deere Operations Center. The course lead sends your benchmark before the cohort starts: multi-year productivity, stability, and which field the program works on first.
1
Missions
Three to four hours per module. A cleaned yield map, a field potential map, zones, a sampling plan, prescriptions, guidance lines, a trial, a profit map. Checked against the Virtual Farm‘s planted answers.
2
Day 90 report
What you built, next to the Day 0 baseline. The document you show your manager or your grower.
3
Certificate
Issued by GeoPard with a number, a QR code and a verification page, prefilled for LinkedIn. An Open Badge for your wallet from the July 2027 cohort. Valid two years.

What you build in GeoPard
A field potential map from several seasons, read against slope, elevation and the satellite record


A cleaned, calibrated yield map and the layers that explain it


Management zones from several layers, and a sampling plan tied to them


Rate maps you can explain as equations, and the work plans and layers the machine runs
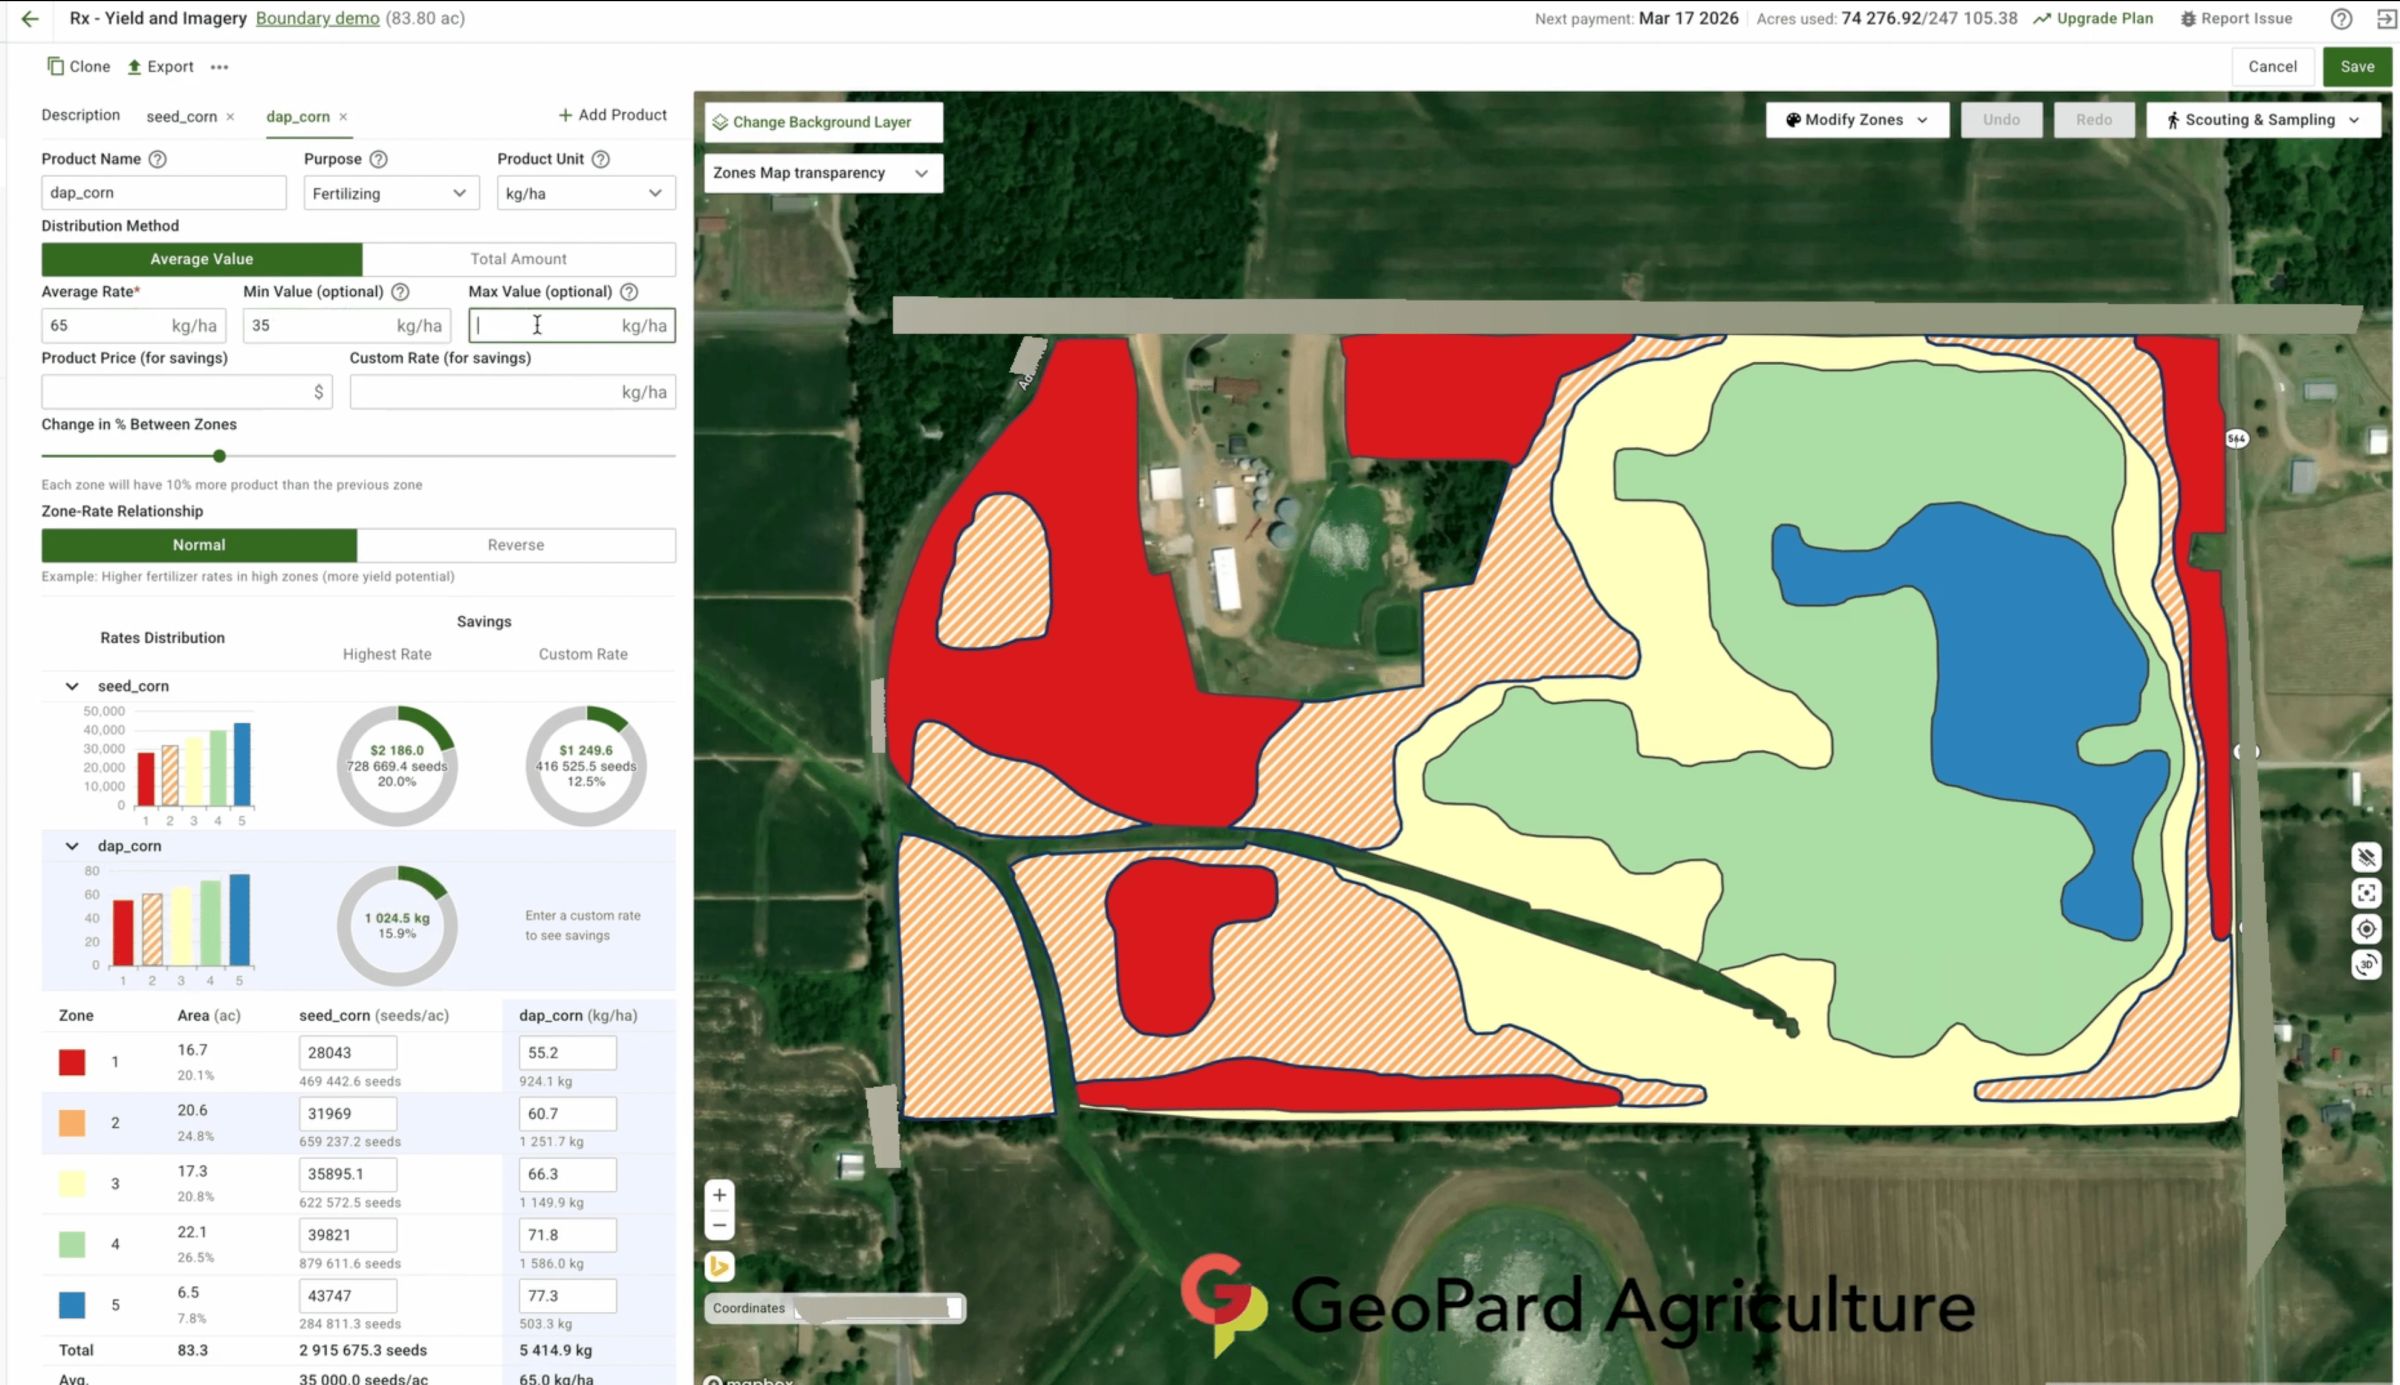


A trial placed on comparable ground, and a map of where the applied rate missed the target


Profit and nitrogen use efficiency by zone, a grower report, and the same work through the assistant


Module 4: Yield cleaning and calibration
Mission: clean and calibrate a harvest yield map

The program
One credential, GeoPard Certified Precision Ag Specialist. The modules open at once and are done in order, at your own pace; the cohort gives you a live question hour with the course lead and the date of your Day 90 report. Each mission names the Virtual Farm field it runs on first.
Where you start: the precision ag skills check
| Module | Title | Mission |
|---|---|---|
| 0 | Onboarding and Day 0 benchmark | Your fields outlined or imported, and the benchmark read and annotated. |
| 1 | Data and GIS basics | Classify every Virtual Farm file by geometry type, repair the broken boundary and the two-part field, and import yield, as-applied and soil correctly. |
| 2 | Satellite imagery | Pull the Cloud-free scenes of three seasons in Satellite Monitoring, compare NDVI and the other indices the platform offers on the same date, read the Crop Development Index Graph against the crop calendar, and order one Planet Scope 3 m scene where 10 m hides the pattern. |
| 3 | Field potential and stability | Read the potential productivity map, single-year and multi-year, and the stability map with its heterogeneity factor, build a custom field potential map from chosen seasons and indices, and mark stable low, stable high and unstable ground on all five fields. |
| 4 | Yield cleaning and calibration | A cleaned, calibrated yield map from Yield Calibrate and Clean on the season with the planted errors; the grader knows which points they were. |
| 5 | Correlation of data layers | Yield correlated with imagery, EC, elevation and lab results in Compare Layers and Multi-Layer Analytics, and the limiting factor on each field named in 100 words from the layers alone. |
| 6 | Management zones | Zones from two or more layers on Bend, built detailed and spatially localized with the smallest polygon set for the machine, and ground-truthed in the mobile app on your own field. |
| 7 | Soil sampling from zones | A sampling plan tied to the zones on North, with the lab results imported and mapped. |
| 8 | Formula-based prescriptions | A lime map, a P and K map, a nitrogen map from a yield goal with credits and a zone-based seeding map on North, East and West, each written as an equation you can explain, exported to the machine and checked with the Fertilizer Blend Calculator. |
| 9 | Guidance lines | Drive plans on all five shapes compared on distance, turns, fuel and coverage, with the AB lines exported to the machine. |
| 10 | Trial design | A strip trial on East laid out along the machine’s passes, every strip at least two passes wide with a check beside each treatment, replicated and exported. |
| 11 | Reading the result | The application deviation map against the as-applied file, and a trial read-out that finds the planted effect with its confidence interval. |
| 12 | Profit maps and nutrient use efficiency | Profit by zone from yield, price and the as-applied costs, nitrogen use efficiency per zone, and a one-page grower report with the decision for next season. |
| 13 | Using AI | Modules 4 to 8 again on one of your own fields through the assistant alone, then one assistant workflow for a task you repeat, and the Day 90 report. |
Add-on, John Deere Operations Center Integration: partner roles and permissions; automated sync both ways; cleaned yield back to the grower; prescriptions through Export to MyJohnDeere, work plans and AB lines to the machine, soil, topography and zones in Field Analyzer; the as-applied audit. Its own endorsement line on the certificate, included in team bundles.
The Virtual Farm
Five real neighbouring fields in your account on enrolment, with their own satellite imagery and three seasons of yield, as-applied, as-planted, EC scan and lab results on each. Every field has one thing wrong with it, and the grader knows what.
- North, rectangle, 29.2 ha, corn and soybeans
- Bend, L-shape, 67.5 ha, soybeans and corn
- West, irregular, 30.5 ha, corn and soybeans
- East, large irregular, 91.0 ha, corn and soybeans
- South, irregular with an interior obstacle, 19.9 ha, corn and soybeans
What comes with a seat
GeoPard for the whole program
- Individual seat: the Annual feature set for four months and up to 500 ha of your own fields; read-only after a 60-day grace period, nothing deleted, with a graduate price on the first year
- Team seat: six months and 1,000 ha per seat, pooled across the team; the workspace then converts to your company’s contract or freezes read-only, with no grace period
- Planet high-resolution imagery on the Virtual Farm and your own fields
- The GeoPard AI Assistant and MCP access
- The mobile app for the field missions
The people
- A live question hour with the course lead for every cohort
- A cohort board; from the July 2027 cohort, a leaderboard, opt-out any time
- Human review of your grower report and your assistant workflow
The certificate
- Issued by GeoPard, signed, numbered, verifiable at geopard.tech/verify
- The January 2027 pilot cohort certifies on the missions
- From the July 2027 cohort, the certificate also needs the 40-question scenario exam: open book, 75 minutes, 70 percent to pass
- Prefilled for LinkedIn; from the July 2027 cohort, an Open Badge for any wallet and competency badges backed by the artefacts in your account
- Valid two years, re-certification on new features
For a precision ag department
Built for retailers, dealers and agribusinesses to run as their onboarding program. New hires join the next cohort; the department keeps one standard.
Team progress
- In the January 2027 cohort, the course lead reports team progress every Monday
- From the July 2027 cohort, the admin dashboard: seats, invitations, progress per person, hectares planned by the team, who is stuck and on which module
- An export for HR and for tenders
Private cohort
- Company question hours; a company leaderboard from the July 2027 cohort
- Missions on your real client fields in a shared workspace
- The John Deere Operations Center add-on included
- The add-on: partner roles, automated sync both ways, cleaned yield back to the grower, prescriptions, work plans and layers to the machine, the audit.
Your own module
- One module built with you: your fleet, your agronomic standards, your naming
- A letter of completion listing the certified staff
Winning teams choose GeoPard
Agriholdings, John Deere dealers, agronomists, growers and research centres, in their own words.



“Geopard is a great tool for us to build management zones with. When we don’t have access to multiple years worth of yield data for a grower, we can utilize GeoPard and the 20+ years of satellite imagery it gives us to build our management zones.”

“When I compare the +20 year GeoPard product map to fields we have a multiple year average yield data its a very close match. The +20 year average map is an excellent product for growers lacking good yield data.”

“GeoPard’s analytics have made it easy for our team and farmers to use precision ag tools effectively. Reliable analytics and consistent support throughout the season have improved input planning and management.”

“It is a pleasure to cooperate with Geopard. Not only the solutions are innovative, but also the service is excellent.”
 Read the story
“The first year, it turned out that we already had a yield increase of 5%. I use Geopard a lot to adjust the fertilisation to the fields.”

“Working with GeoPard has been a game-changer. It’s shifted our approach from relying on gut feeling to making decisions based on hard data. Through GeoPard’s sophisticated technology, we’re implementing precise, sub-field agronomy recommendations that are specifically tailored for each plot’s unique requirements.”
Read the story“The synergy between GeoPard and LVA is more than just a business partnership; it’s a commitment to revolutionizing applied agronomic practices through data-driven decisions. This collaboration is dedicated to empowering farmers with enhanced agronomic insights.”
“It is a pleasure for us to work with the enthusiastic GeoPard team. Deeper insights into our strip-intercropping data enabled by the GeoPard tool are very valuable to us.”
Read the story“GeoPard has transformed how fields are managed by turning complex data into practical, actionable recommendations. The platform helps build targeted soil sampling strategies that pinpoint specific field zones requiring attention, enabling zone-specific management instead of uniform application across entire fields.”
Read the story“Thanks to the wide range of options in GeoPard, which fully meets our needs, soil agrochemical work within our company has become much more efficient and the results are more accurate. Technology is moving fast, and it is important to keep up.”
Read the story“Over the past few years, we have been evaluating different methods for defining and using productivity zones. For large areas, analysis of long-term data on vegetation and yield maps is most suitable. Further, taking into account the productivity of the zones, we adjust the seeding rates and fertilizer rates.”
“Collaboration with GeoPard opens up new opportunities for our students and researchers. They will be able to work with the most advanced spatial analysis and yield modeling tools, which will significantly increase the level of their practical training.”
 Read the story
“With the help of GeoPard Agriculture’s Profit Map, we were able to gain a deeper understanding of the profitability of our partners’ fields. This allowed our farmers to make more strategic decisions on the allocation of resources, which ultimately increased operational efficiency and improved bottom line indicators.”
Read the story“Using Geopard has streamlined key parts of our workflow. In seasons where time is money, we can rely on the team at Geopard to get it done.”
“Data visualization leads to the creation of ideas and analytics helps us to solve problems. GeoPard’s platform not only helps us visualize data but also gives us the tools to analyze data so we can create solutions and write prescriptions.”

“We are happy to have GeoPard as part of the platforms working with SoilOptix® data to enable growers and agronomists with the tools to accurately and visually analyze and manage their fields.”

 Read the story
“GeoPard and FieldView integration provided us with access to more data than the existing integration of John Deere Operations Center and Climate FieldView. This enables us to further automate precision farming processes across 360k hectares.”
Read the storyPricing for the January 2027 cohort
Prices in USD; billing in EUR outside acre regions. The seat includes GeoPard for the program; the graduate price on a first year of Annual makes the certificate and the subscription cost about what the subscription costs alone.
Precision Ag Specialist certification
$390
- Every module, on the Virtual Farm and your own fields, at your pace
- GeoPard and Planet high-resolution imagery for four months
- The certificate and the badge
John Deere Operations Center Integration
$150
- The add-on: partner roles, automated sync both ways, cleaned yield back to the grower, prescriptions, work plans and layers to the machine, the audit.
- Endorsement line on the certificate
- Needs an Operations Center organisation you can work in
Team seat
$310 per seat from 10, $230 from 25, $150 from 50 seats
- Certification and the add-on for every seat
- Six months of GeoPard, 1,000 ha per seat pooled across the team
- Private cohort and shared workspace; the admin dashboard from the July 2027 cohort
- Enterprise by invoice, renewing with new hires
Join the waitlist
The January 2027 cohort takes 30 people and two design-partner companies. The waitlist hears first, with the early price.
Your skills-check profile comes with the request.
No profile yet: the precision ag skills check
Frequently asked questions
Do I need my own fields to take the program?
No. The Virtual Farm is in your account from the first day, and every mission runs there first. Your own fields are the second half of each mission and the half that counts toward the hectares on your profile.
A student or a new hire without fields finishes the program on the Virtual Farm alone. The badge for a field mission then carries a note that it was done there.
Who sees the fields I bring in?
You share your own farm with the course lead's GeoPard account. That is how the course lead runs your Day 0 benchmark and checks your own-field missions.
Course material uses the Virtual Farm, whose yield, soil and application data are made up. A grower report goes on the blog only if you agree, with names and places removed. When the program ends, stop sharing from the Action column in Farms.
Who issues the certificate and how does someone check it?
GeoPard issues it, signed by the course lead and a company officer, with a certificate number and a QR code. The verification page at geopard.tech/verify shows the holder, the credential, the dates and the status, never the fields or the employer.
The January 2027 pilot cohort certifies on the missions. From the July 2027 cohort, the certificate also needs the 40-question scenario exam: open book, 75 minutes, 70 percent to pass.
The LinkedIn link prefills the certification fields. From the July 2027 cohort an Open Badge comes with the certificate; it imports into any badge wallet and verifies on its own. The certificate is valid for two years; re-certification is a short practical on what has been released since.
How much time does it take?
Three to four hours per module, about 48 hours in all, at your own pace; most people finish inside one off-season. The cohorts start in January and July.
Most of that time is in GeoPard doing the mission. The cohort's one-hour live question session is there when you want it, and the recording is there when you do not. Fall behind and the next cohort picks you up where you stopped.
The lessons and the question hour are in English, whatever language this page is read in.
Is it only GeoPard, or will I learn QGIS and Excel too?
The missions run in GeoPard because that is where a prescription becomes a file the machine reads. Side modules on QGIS for boundary repair and reprojection and on Excel for lab results and rate tables are there when a mission needs them, and the skills carry over to any GIS.
Zones, sampling from zones, formula-based prescriptions, trials and the economics are methods that hold on any platform, and the exports are standard formats, ISO-XML and shapefile, that other systems read.
Every formula is yours: the course gives the structure of a lime, P and K, nitrogen or seeding equation, and you put in the coefficients from your local recommendation table and validate them with local agronomy, soil tests and product labels.
What happens to my account when the program ends?
Nothing is deleted. On an individual seat the account goes read-only after a sixty-day grace period, with every zone, prescription and report still in it. The graduate price on the first year of Annual is set so the certificate plus the subscription cost about what the subscription costs alone.
A team workspace runs for six months and then converts to the company's contract or freezes read-only, with no grace period. Nothing in it is deleted either.
Ready?
Service without extra costs
You pay for what you use only. Just choose a plan that fits you or contact us for assistance Choose Your PlanGet Demo
Fill out a contact form and get a demo to discover the full potential of the GeoPard Agriculture platform! Try now


 English English
 German
 Ukrainian
 French
 Kazakh
 Portuguese
 Spanish
 Arabic
 Swedish
 Serbian
 Romanian
 Norwegian
 Finnish
 Lithuanian
 Estonian
 Latvian
 Croatian
 Slovenian
 Slovak
 Japanese
 Polish
