


Does precision agriculture ROI hold up outside a sales deck? A new survey of 842 grain farmers in Argentina says yes: 82 % of those using digital tools report measurable gains in cost, efficiency or yield, and the savings come mainly from inputs. The same survey shows farmers trusting their data far more than four years ago, and sending less of it straight to the companies that sell them seed, fertilizer and crop protection.
The survey at a glance
The figures come from ENPA 2025, the Survey of Agricultural Producer Needs run by the Agribusiness and Food Center (CEAg) at Universidad Austral in Argentina, as reported by Agrofy News on 3 November 2026.
Buenos Aires, Córdoba, Santa Fe and Entre Ríos, interviews April to September 2025
Source: ENPA 2025, Universidad Austral (CEAg), 842 farms in the Argentine Pampas.
- Who: crop and mixed crop-livestock farmers, each with at least 300 ha of soybean, corn or wheat in 2024/25
- Method: stratified probability sample by province and farm size, interviews from April to September 2025, about ±5 % sampling error
These are large commercial grain farms in one of the most technology-heavy farming regions in the world, and they have used the tools long enough to judge them.
Precision agriculture ROI starts with input savings
Of the farmers using digital tools, 82 % say the investment produced measurable gains, and 44 % fully agree that it paid back.
What they bought the tools for is just as telling: 81 % adopted technology mainly to cut spending on inputs, while 55 % were after higher yields. The savings they report match that goal: 70 % cut overall costs, 68 % saved on crop protection (33 % call it significant) and 65 % on fertilizer.
Share of farmers using digital tools
Source: ENPA 2025, Universidad Austral (CEAg), 842 farms in the Argentine Pampas.
This matches what we see in variable rate work. The fastest payback rarely comes from pushing yield on the best zones. It comes from not putting product where the field cannot use it: less nitrogen on low-potential ground, less seed on sandy knolls, targeted spraying instead of blanket passes.
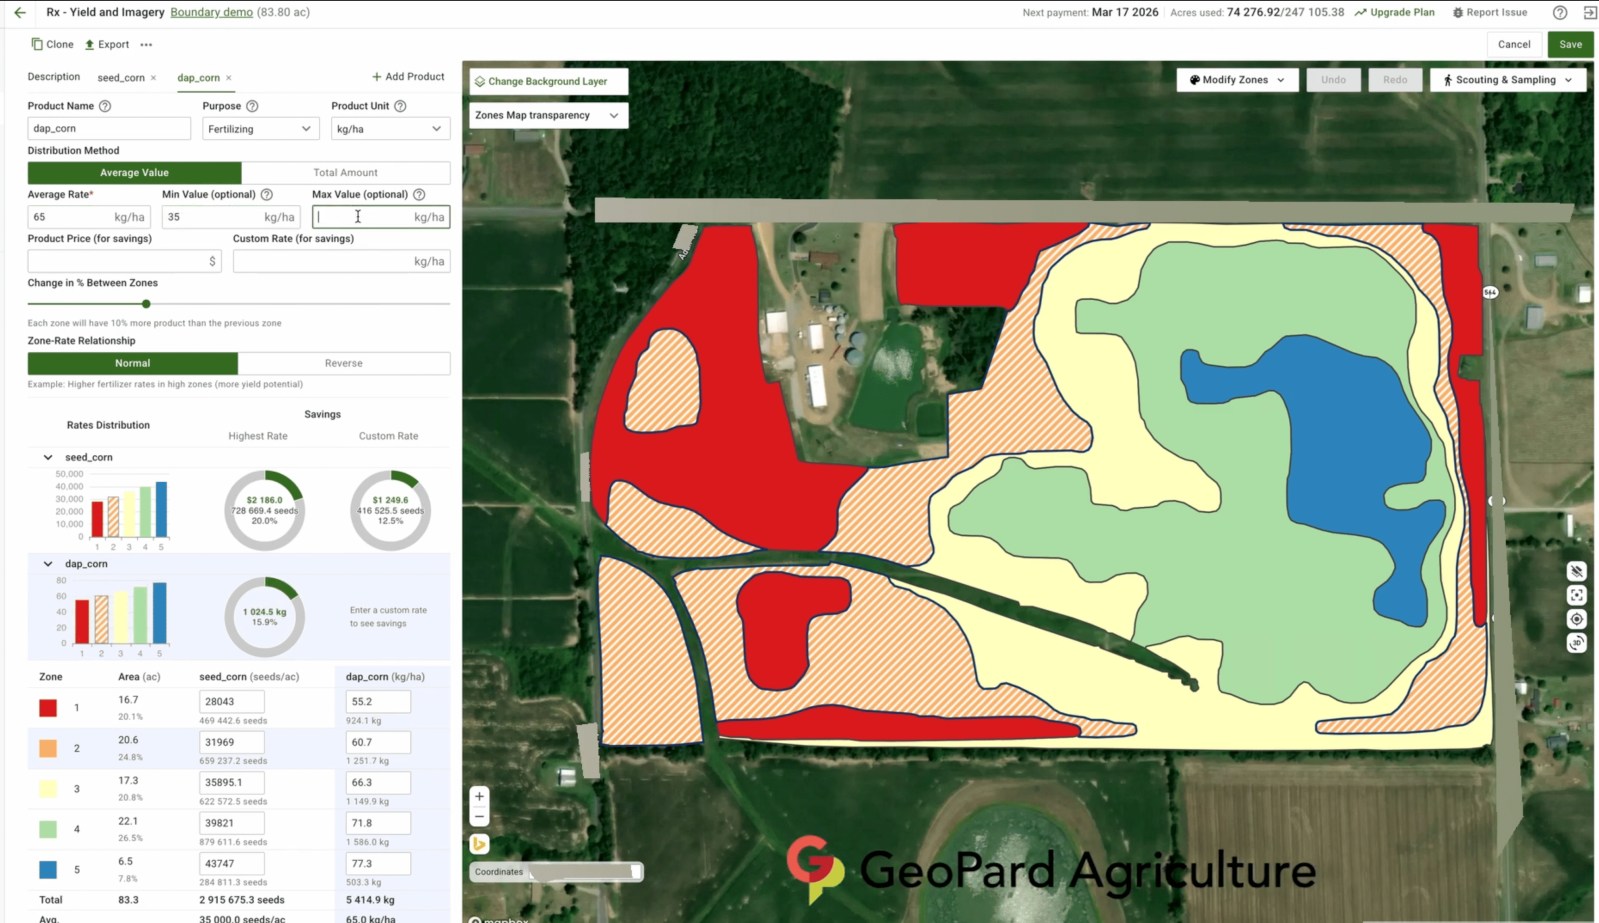
If you want to put numbers on your own fields before committing, the Variable Rate ROI Calculator shows input savings and yield effects side by side, with the math visible.
Farmers are sharing less data with input suppliers
The most interesting shift in the survey is about data, not hardware.
Share of farmers, 2021 and 2025
Source: ENPA 2025, Universidad Austral (CEAg), 842 farms in the Argentine Pampas.
Distrust in how farm data is used fell from 56 % to 11 % in four years. 73 % of farmers now share yield maps, soil samples or contour lines with third parties, and the main recipient is the independent agronomist. Direct sharing with input suppliers fell from 42 % to 25 %.
Put together, farmers are not hiding their data. They are sharing more of it, with more confidence, but they are choosing who sees it. The person who reads the yield map is increasingly someone who does not also sell the product the map recommends.
A prescription map is effectively a purchase order. When the same company builds the map and fills the order, the farmer has to trust that the rate was set for the field, not for the sales target.
Why independent analytics is the logical next step
If the advice is moving to independent agronomists, the analytics behind that advice should be independent too. In practice that means three things:
- The data stays with the farmer. Yield, soil and as-applied files can be exported at any time, raw and processed, and are never resold. The Ag Data Transparent core principles are a good checklist for any provider.
- Every rate can be traced. Which layers went in, which years, how the zones were drawn and which formula set the rate. An agronomist should be able to check it, change it and defend it.
- The rate is not tied to a product. Variable rate done well moves product around the field, and the total can go down as easily as up.
This is how GeoPard is built: an analytics platform with no input sales behind it, where agronomists combine satellite, yield, soil, topography and as-applied layers, apply their own equations and export the prescription to the machine.

For a longer checklist, see how to choose precision agriculture software.
The bottleneck is time and know-how, not hardware
The survey is clear that the next gains will not come from buying more equipment. Lack of knowledge (48 %) and relative cost (46 %) lead the list, and on large farms the missing piece is trained staff (45 %), ahead of money (35 %).
Share of farmers naming each barrier
Source: ENPA 2025, Universidad Austral (CEAg), 842 farms in the Argentine Pampas.
40 % of intensive adopters say many new solutions do not solve a real production problem. The farmers who already use the most technology are the most skeptical of the next new thing. They want tools that answer a real question on a real field, not more dashboards.
Two practical answers follow from this. First, automate the routine steps so people spend their time on decisions: yield cleaning, zone creation, as-applied versus planned checks, and the season yield report. Second, invest in people. The GeoPard Academy is built around exactly this gap, teaching precision ag module by module on a working virtual farm.
Where does AI help, and where should it not hide the method?
The survey describes AI as an emerging bridge for simplifying decisions, and Argentina is already a strong adopter. Professor José Gobbe of Universidad Austral notes that selective application among mid-size and large farmers is at the same adoption level as in the United States.
AI earns its place in two areas:
- In the machine: selective spraying that detects weeds in real time and applies only where needed, a direct route to crop protection savings.
- In the office: shortening the time from data to decision. When 44 % of farmers say interpretation takes too long, an assistant that answers "which zones underperformed this year, and what did we apply there?" with the map and the numbers is a direct fix. That is the idea behind the GeoPard AI Assistant.
The rule we apply: AI should speed up the work, not replace the method. Every answer should point back to the layers and formulas behind it, so an agronomist can check it. An AI recommendation nobody can trace is just a new black box, and the survey shows farmers are moving away from those.
How to turn the survey into a plan for this season
- Start with inputs, not yield. Pick the two or three fields with the most variation and build variable rate maps for the biggest cost line: nitrogen, seed or crop protection.
- Keep your data where you control it. Bring yield, soil and as-applied files into one independent platform, and share access with your agronomist, not your whole data set with every supplier.
- Leave a check strip. A flat-rate strip is the only way the yield map can tell you what the variable rate earned.
- Measure after harvest. Compare planned, as-applied and yield. Our guide on checking a variable rate prescription with yield data walks through it.

- Validate the rates locally. Use local trials, soil tests, product labels and your agronomist’s judgment to set the numbers behind each zone.
Quick answers
Does precision agriculture pay off? For most large grain farms, yes. In ENPA 2025, 82 % of digital tool users report measurable gains, with general cost savings reported by 70 % and fertilizer savings by 65 %.
Who should see my farm data? Whoever helps you make the decision, on terms you control. The survey shows farmers moving toward independent agronomists and away from sharing directly with input suppliers. Keep your data on a platform where you can export everything and grant access field by field.
Precision Farming




 English
 German
 Ukrainian
 French
 Kazakh
 Portuguese
 Spanish
 Arabic
 Swedish
 Serbian
 Romanian
 Norwegian
 Finnish
 Lithuanian
 Estonian
 Latvian
 Croatian
 Slovenian
 Slovak
 Japanese
 Polish
