
For agronomists, consultants and dealers
Equation-based analytics: rates from formulas you can read
Write a rate as a formula over yield, soil, imagery and as-applied layers, run it on one field or every field in one batch, and send the map to the display.
✓Your agronomy, line by line
✓One formula across every field
✓Product totals for purchasing
Independent of input sellers, and your formulas stay in your account
30-day trial on up to 250 acres (101 ha), no card required

Formula workbench
A prescription is three lines of agronomy
Formulas from the GeoPard catalog on a sample corn field with yield, soil and satellite layers. Change a coefficient or write your own line, the way it is written in GeoPard.
University of Nebraska–Lincoln, Lime Use for Soil Acidity Management (2015): 1,000 to 1,200 lb of ag-lime at 60 % ECCE for each 0.1 unit of buffer pH below 7.0, scaled to the ECCE of your lime. A predefined equation in the GeoPard catalog.
Iowa State University Extension, PM 1688: corn grain removes 0.32 lb of P2O5 per bushel at 15.5 % moisture. MAP 11-52-0 carries 52 % P2O5, and the last line turns the nutrient into product.
Vegetation difference from the GeoPard catalog: the later image minus the earlier one. Red cells lost vigour between June and July.
Any arithmetic over the layers below, with max, min, abs and round. The last line is the map.
Variables from datasets:
Output variable:
Lime_lb_ac
Field 1 · lb/acLayers of this field
The same formula on four fields
Batch runArea –Average –Total –
In GeoPard
From formula to the display in five steps
Pick a formula or write one
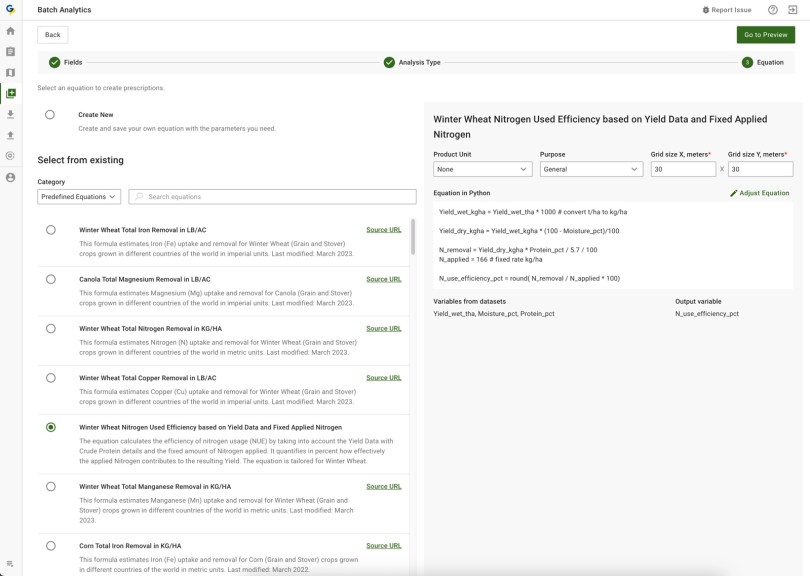
Start from the catalog: nutrient removal for corn, winter wheat and canola, lime recommendations, nitrogen use efficiency, crop change. Or write your own in Python and save it for next season.
›The formula catalogPoint each variable at a layer
Yield, moisture and protein from the harvest, soil lab results, scans, satellite indices, as-applied rates, zones or an earlier equation map.
›Your first equation mapRun it on every field
One formula across a farm or a whole client list. Each map carries its average and total, and the summary gives the product to order.
›Batch equation mapsChain one result into the next
Applied nitrogen, uptake, use efficiency, costs and profit are ready-made functions, so a long calculation stays a few readable lines.
›The function catalogSend the rates to the field
Export the map as rate zones, each value merged into one polygon, so the machine changes rate only where the formula does.
›Export an equation map
What agronomists build
Prescriptions, checks and profit, in the same language
Lime and nutrient prescriptions
Your recommendation table as a formula over soil tests and yield goals, applied to every cell of every field.
Lime_lb_ac = max(0, (7.0 - Buffer_pH) / 0.1) * 1100Removal after harvest
What each part of the field took away, from the cleaned yield map, as the starting point for maintenance rates.
P2O5_removal_lb_ac = Yield_Bu_ac * 0.32Nitrogen use efficiency
Uptake from yield and protein against the nitrogen applied, to see where the fertilizer turned into grain.
N_use_efficiency_pct = round(N_removal / N_applied * 100)Profit maps
Revenue from the yield map minus seed, fertilizer and operation costs, cell by cell, to decide where the next dollar goes.
Profit_usd_ac = Revenue_usd_ac - Costs_usd_acApplication quality
The as-applied map against the prescription, so a blocked section or a slow controller shows before the yield does.
Deviation_pct = (Applied_rate - Target_rate) / Target_rate * 100Change between dates
One satellite image minus another, to send the scout to the part of the field that slipped since the last pass.
NDVI_change = NDVI_Jul - NDVI_JunIn the app
The formula, the batch and the map for the cab


Agronomists on GeoPard
From analysis to the prescription
“Data visualization leads to the creation of ideas and analytics helps us to solve problems. GeoPard’s platform not only helps us visualize data but also gives us the tools to analyze data so we can create solutions and write prescriptions.”
 Steve LarocqueOwner of Beyond AgronomyAlberta, Canada
“With the help of GeoPard Agriculture’s Profit Map, we were able to gain a deeper understanding of the profitability of our partners’ fields. This allowed our farmers to make more strategic decisions on the allocation of resources, which ultimately increased operational efficiency and improved bottom line indicators.”
“The synergy between GeoPard and LVA is more than just a business partnership; it’s a commitment to revolutionizing applied agronomic practices through data-driven decisions. This collaboration is dedicated to empowering farmers with enhanced agronomic insights.”
Pricing
How equation maps are billed
Pay per map while you test your formulas, or take Annual and run them on every field as often as the season needs.
Pay-As-You-Go
A few fields, or formulas you are still testing.
$20 a monthplus each map you run
- ✓Equation map: $0.10 per acreper hectare
- ✓Zones or VRA map: $0.072 per acreper hectare
- ✓Extra logins: $5 a month each
- ✓Month to month, with no annual commitment
Annual
Your formulas on every field, every season.
$0.59 per acreper hectareper year on the first band, down to $0.45 as your area grows
- ✓Unlimited equation maps, batch runs, zones and prescriptions
- ✓Minimum $200 a year, covering up to 339 acreshectares
- ✓One user seat included, extra seats $60 a year
Agribusiness
Dealers and service companies above 25,000 acreshectares, or one formula set for a whole network.
Custom proposalwith volume and multi-year pricing
- ✓Unlimited platform usage
- ✓Shared formulas for your agronomy team
- ✓API access for your own systems
Billed in USD in acre regions such as the US and Canada, and in EUR everywhere else. Every plan includes the John Deere Operations Center integration and the AI Assistant, with fair-use limits.



 English
 German
 Ukrainian
 French
 Kazakh
 Portuguese
 Spanish
 Arabic
 Swedish
 Serbian
 Romanian
 Norwegian
 Finnish
 Lithuanian
 Estonian
 Latvian
 Croatian
 Slovenian
 Slovak
 Japanese
 Polish
