









AI-Powered, All-in-One Precision Agriculture Software

Implement data-driven crop farming practices with GeoPard Ag powerhouse analytics platform

Start free

See what limits every part of your field. Fix it where it pays.

Precision agriculture software that turns yield, soil, satellite and topography data into management zones, variable rate maps and a profit check per zone. Independent of input sales. Connected to John Deere Operations Center.

Normalized yield map of a field as a grid of cells inside the field boundary
Normalized yieldharvest data, cleaned and calibrated

GeoPard Optimizes All Your Agricultural Workflows

Multi-year field potential & Multi-layer analytics. See docs.

3d & 2d models Based on Remote Sensing Lidar & Machinery data; Elevation, Slope, aspect, Roughness → Water/erosion insight, equipment planning.

35+ yrs, 20 indices; compare layers & 3D

Stable zones, “where to act.”

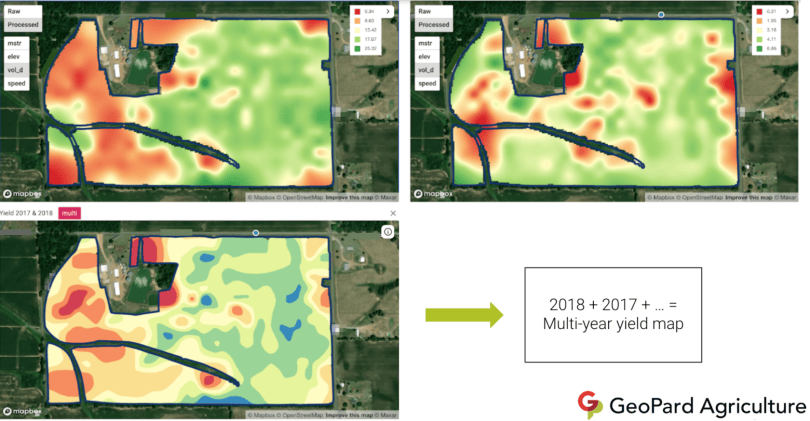
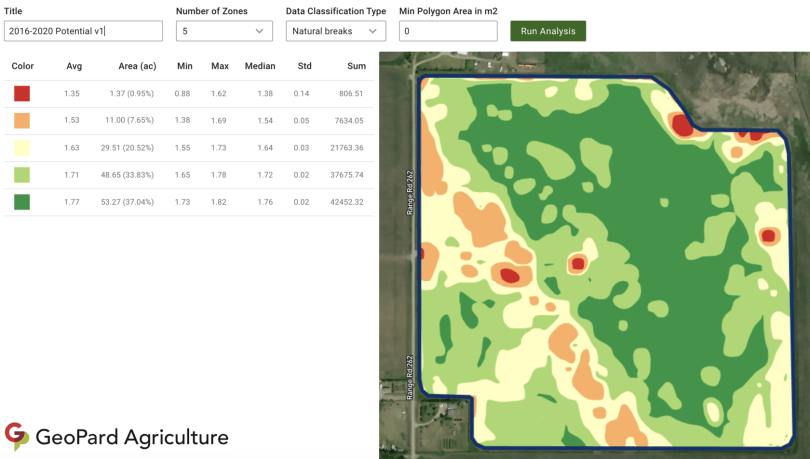
  • Multi-year field potential map in GeoPard built from several seasons of yield and satellite data
  • GeoPard field potential map compared with harvester yield data for the same field
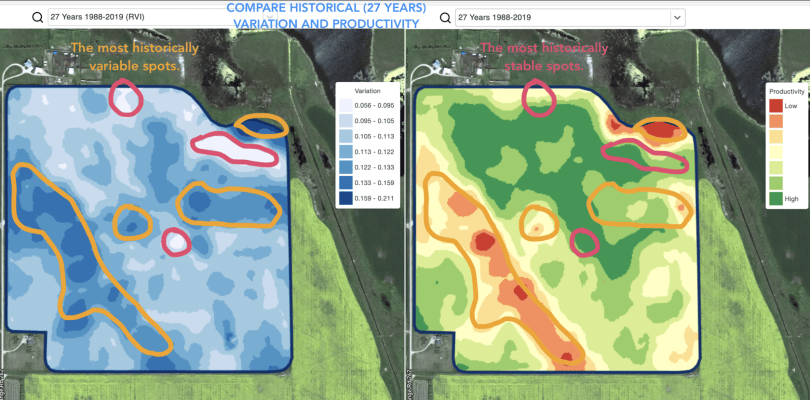
  • 27 years of satellite history in GeoPard showing the most variable and the most stable field zones
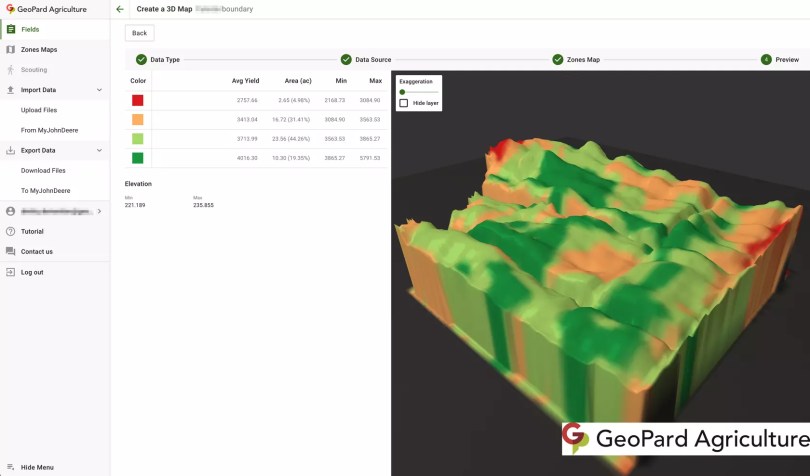
  • 3D field model in GeoPard with the yield map draped over elevation
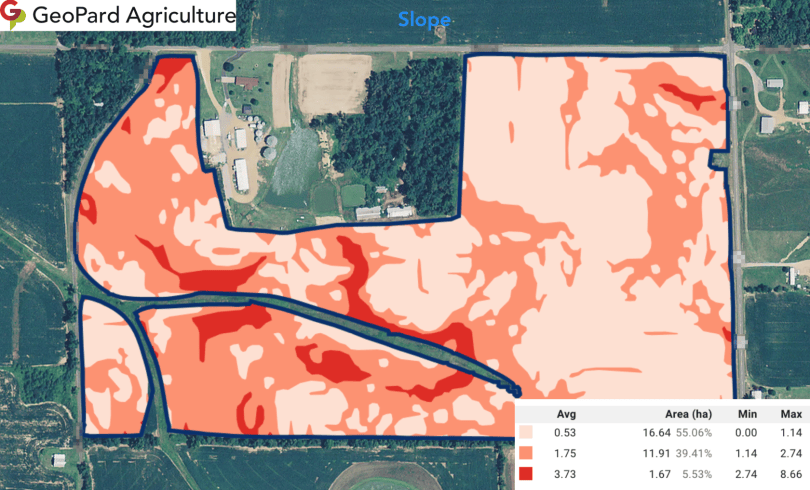
  • Slope map of a field in GeoPard with statistics per slope class
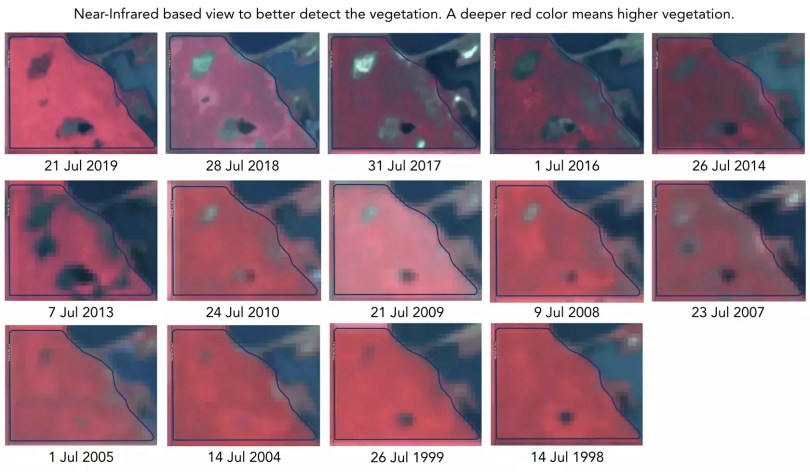
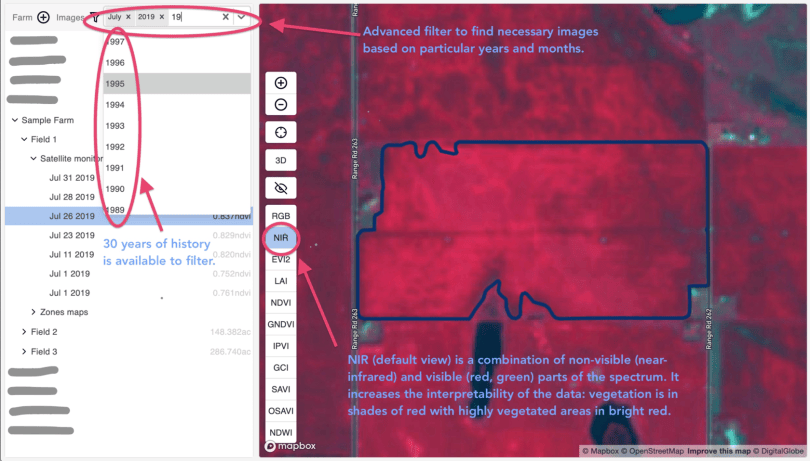
  • Historical near-infrared satellite views of one field across seasons in GeoPard

Grid, Zonal, Custom routes; Print Labels

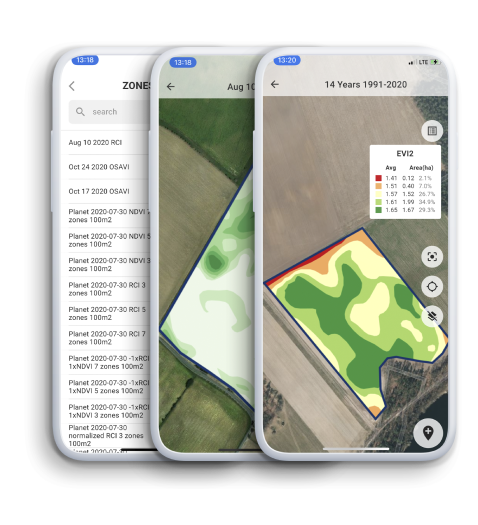
Use GeoPard Mobile app to mark collected points

Automated accurate maps, ready for VRA

Electrical Conductivity, Moisture , TopSoilMapper, Veris, SoilOptix, etc.

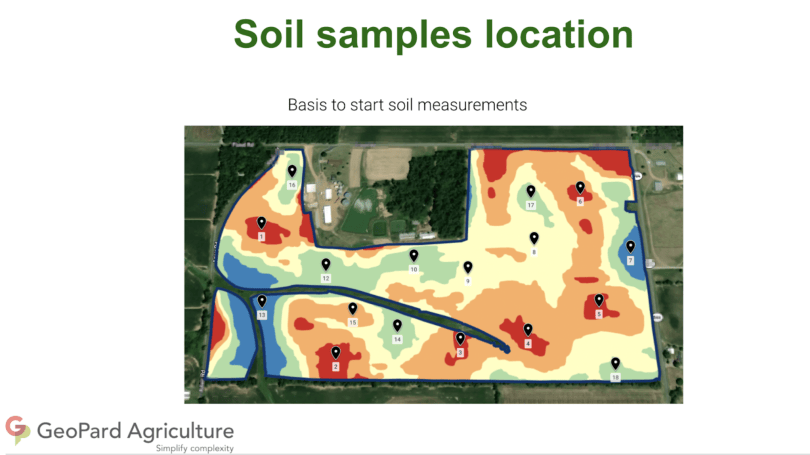
  • Zonal soil sampling plan in GeoPard: numbered sample points and the walking route across management zones
  • Soil sampling plan in GeoPard: sample points placed on a field potential zones map
  • GeoPard batch soil sampling planner generating sample points for a field from a zones map
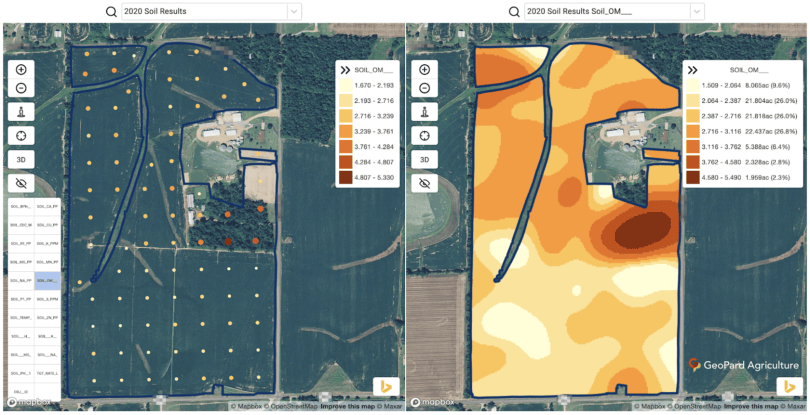
  • Soil lab results mapped in GeoPard: two nutrient layers interpolated across the field
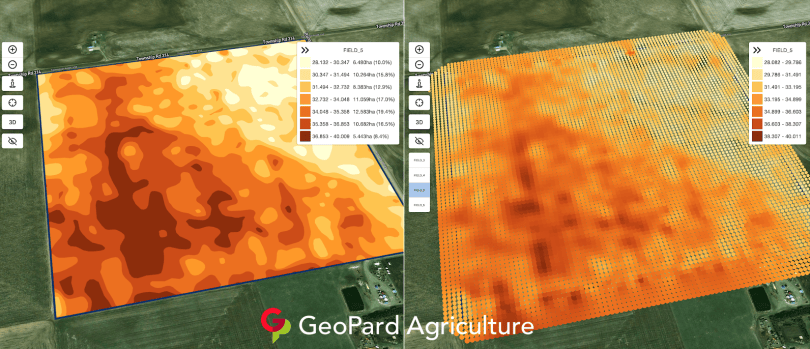
  • Soil electrical conductivity scan in GeoPard, raw points and processed EC map
  • Processed soil electrical conductivity map of a field in GeoPard
  • Variable rate lime prescription in GeoPard based on soil pH scanner data

Use predefined or create custom formulas

Adjust logic, control rates

Use semi-automated rates distribution tool to control rates

Adjust rates -> graphs with costs and savings per zone

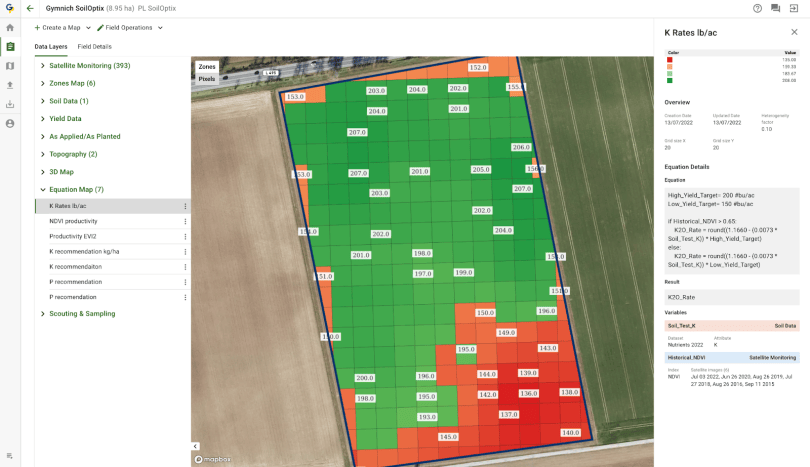
  • Equation-based fertilizer rates in GeoPard calculated from yield and soil layers
  • Variable rate potassium map in GeoPard with rates per grid cell
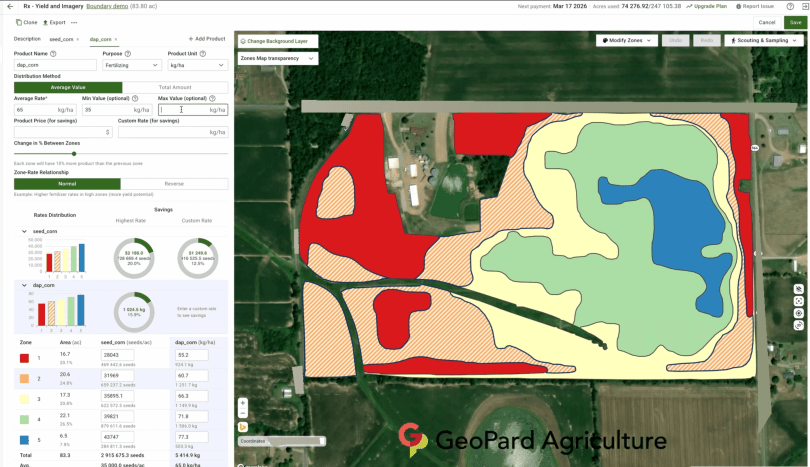
  • GeoPard rates distribution tool assigning fertilizer and seed rates to management zones
  • GeoPard rates distribution chart with input cost and savings per zone versus a flat rate
  • Side-dressing variable rate fertilizer map in GeoPard ready for the spreader
  • Variable rate lime prescription in GeoPard based on soil pH scanner data

Integrate yield, topography, soil, imagery to get perfect planting maps

Use templates from universities & GeoPard or create your formulas, integrate any layers

Use semi-automated rates distribution tool to control rates

Batch using formulas

Send to John Deere Operations Center or CNH via API, or download as shapefile or ISO-XML.

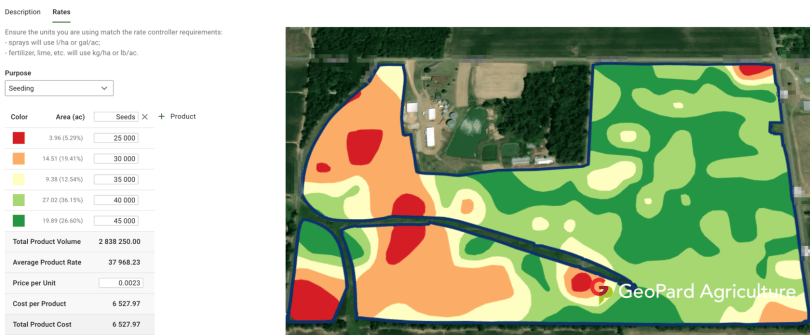
  • Variable rate seeding map in GeoPard with seeding rates per management zone
  • Multi-year field potential map in GeoPard built from several seasons of yield and satellite data
  • Seeding and fertilizer rates per zone in the GeoPard rates distribution table
  • Seeding zones map exported from GeoPard as a work plan to John Deere Operations Center
  • Creating a John Deere planting work plan from a GeoPard variable rate seeding map
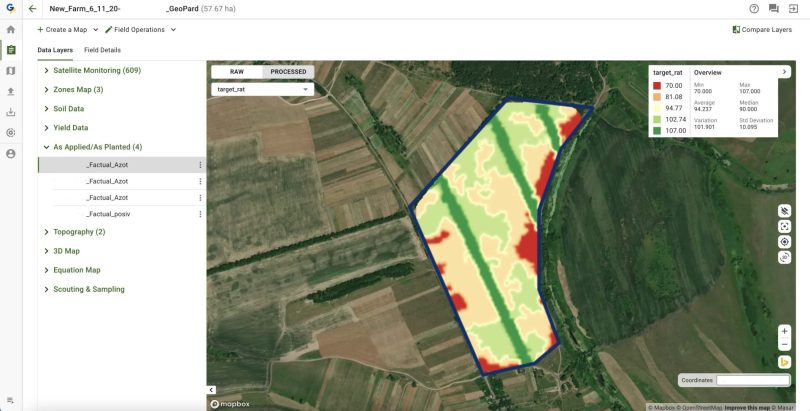
  • As-planted target seeding rate map imported into GeoPard from the planter

Sentinel/Landsat/Planet (contrast and view)

Automated scouting; mobile offline

Plan in advance, ground truth with boots on the ground

  • Satellite monitoring in GeoPard: near-infrared view of a field with 30 years of image history
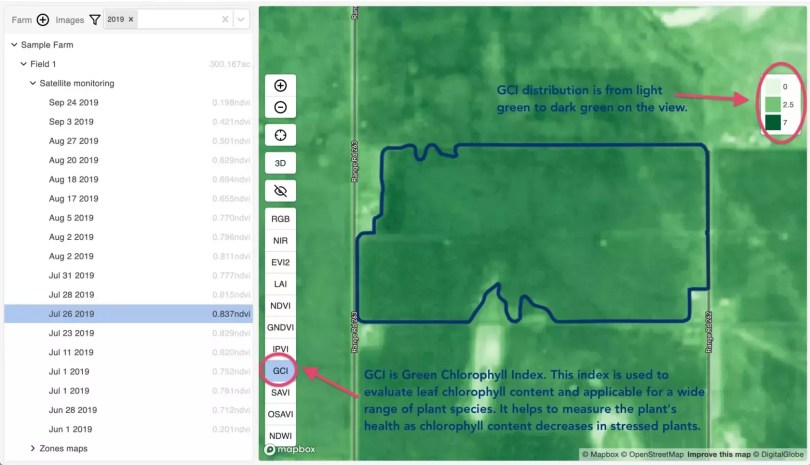
  • Green chlorophyll index map of a field in GeoPard satellite monitoring
  • Ordering high-resolution Planet imagery for a field inside GeoPard
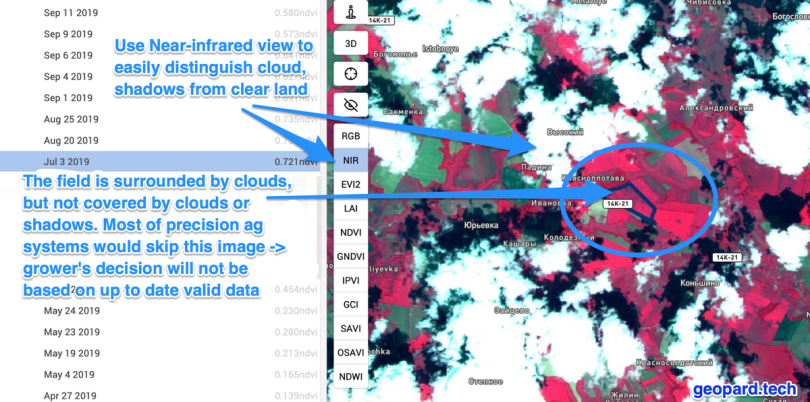
  • GeoPard cloud and shadow detection keeps a clear field image usable when the surroundings are cloudy
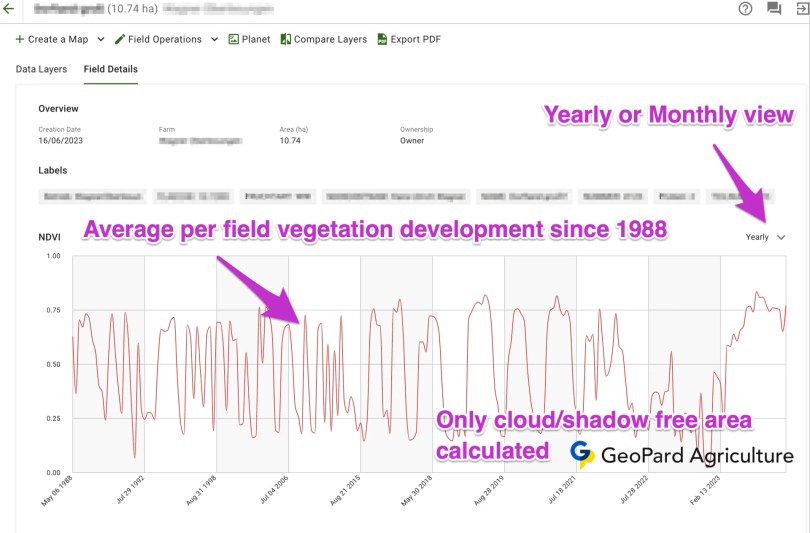
  • Crop development graph in GeoPard: average vegetation per field since 1988
  • Field scouting with the GeoPard mobile app on a tablet

Every field of the farm in one table. Sort and filter by any parameter: field potential, any soil attribute, yield, as-applied, equation-based maps, zones and topography.

Rank fields by potential or by last season’s yield to decide where scouting, sampling or a fungicide pass pays first.

Pick any two layers and see which fields lead and which lag, so the same budget goes where it returns most.

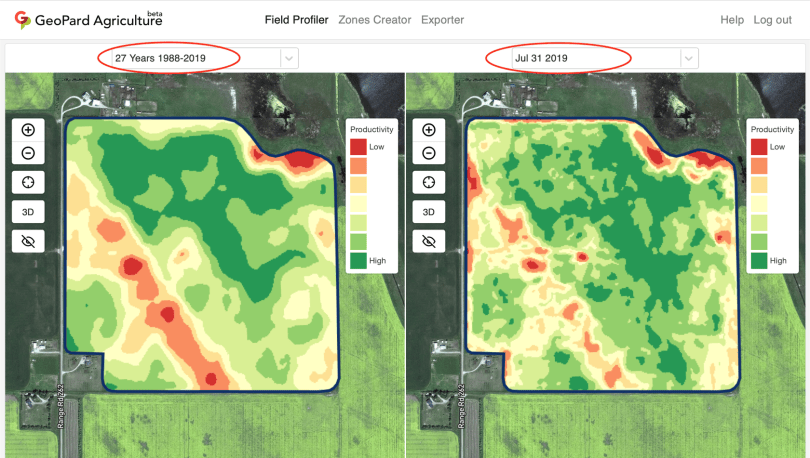
  • Comparing 27-year field potential with an in-season satellite image in GeoPard
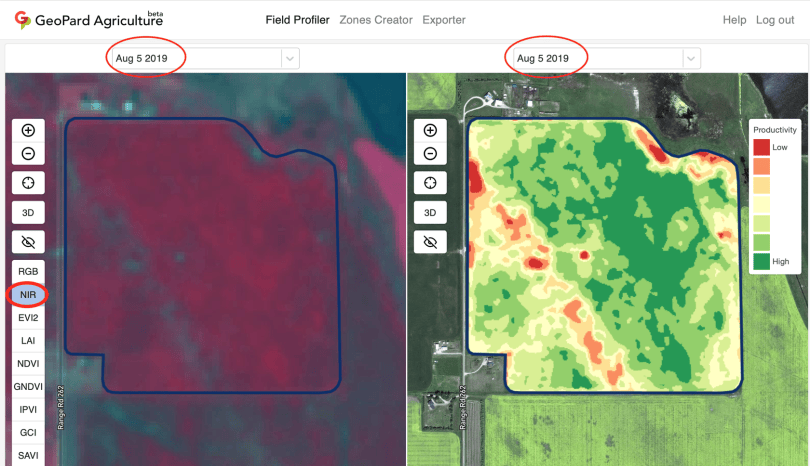
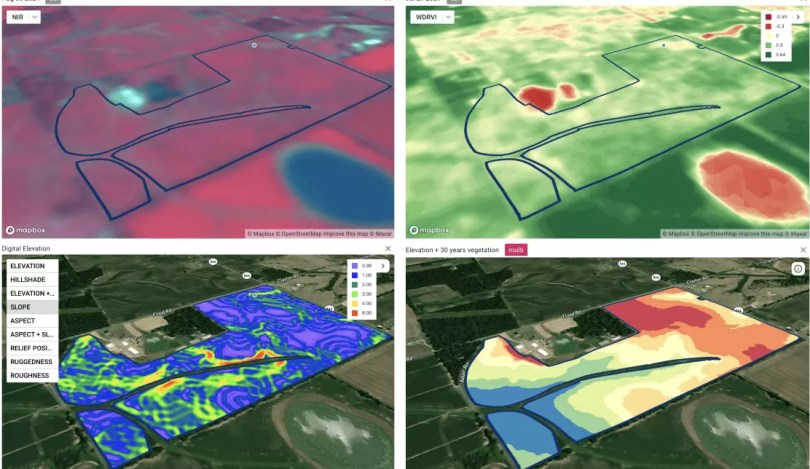
  • Side-by-side view in GeoPard: near-infrared image and productivity zones for the same field
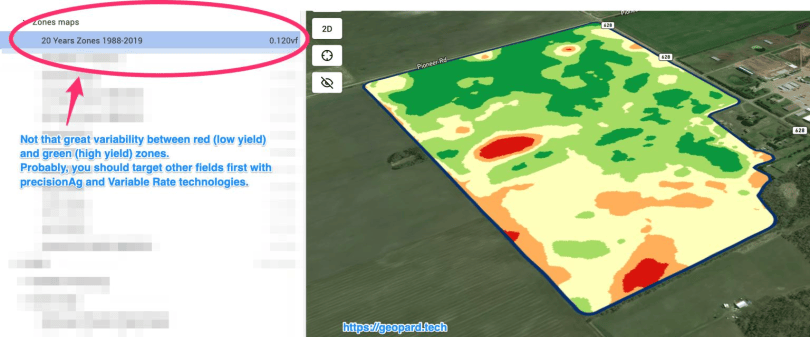
  • GeoPard variability factor showing low heterogeneity between field zones
  • GeoPard variability factor flags a field with an unseeded part as highly heterogeneous

Seeding, fertilizing, spraying, tillage and harvest per field, with dates, products and rates.

As-applied, as-planted and harvest records arrive from John Deere Operations Center, CNH or uploaded files.

Product, rate and price per pass give the cost of every operation and the season total per field.

A summary of the operations executed yesterday across the farm, delivered to your inbox.

  • As-applied fertilizer rate map imported into GeoPard from the machinery
  • Seeding zones map exported from GeoPard as a work plan to John Deere Operations Center
  • Creating a John Deere planting work plan from a GeoPard variable rate seeding map

Every operation grouped by field and season, so one screen shows what was done and when.

Hectares worked, products used and rates applied, summed per operation type.

Download the breakdown as CSV or PDF for accounting, the adviser or the landlord.

  • Strip trial design in GeoPard with treatment strips placed across field potential zones
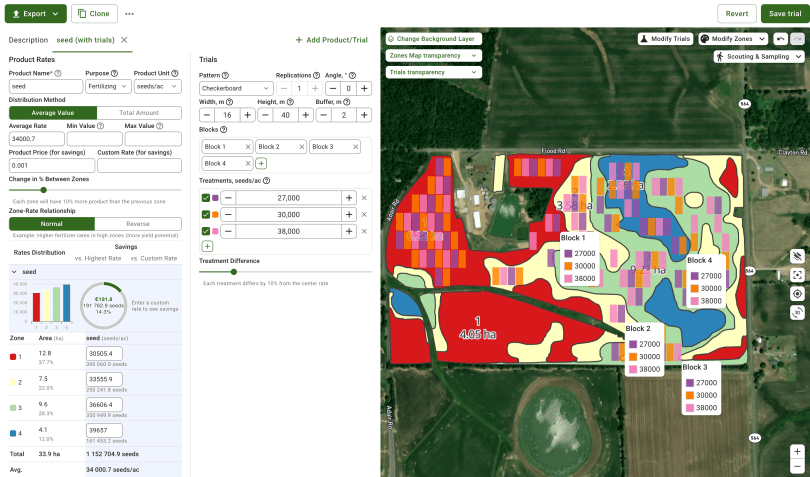
  • Checkerboard trial layout in GeoPard with blocks of different seeding rates
  • Field potential, calibrated harvest data and trial results compared in GeoPard
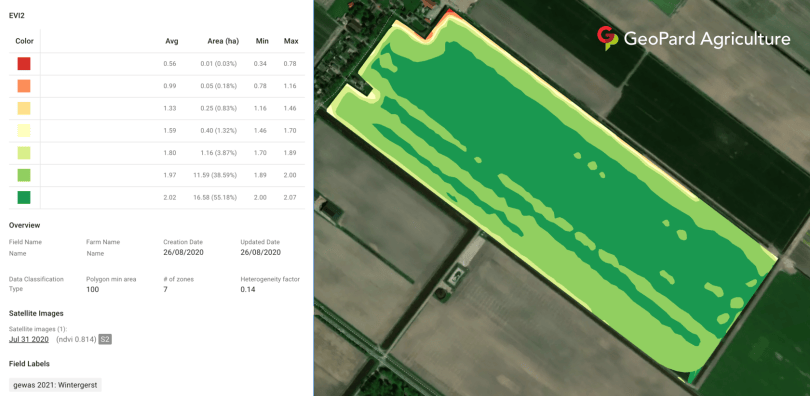
  • Management zone statistics in GeoPard: average, area, min, max and standard deviation per zone

Import from sprayers/seeders or via connected platforms (CNH, John Deere )

Target vs applied; variance heatmaps

Compare early-season vegetation with the as-planted map to find patches that did not establish, then export a map to re-seed only those areas.

Stable zones, “where to act.”

  • Target rate versus as-applied comparison of a prescription map in GeoPard
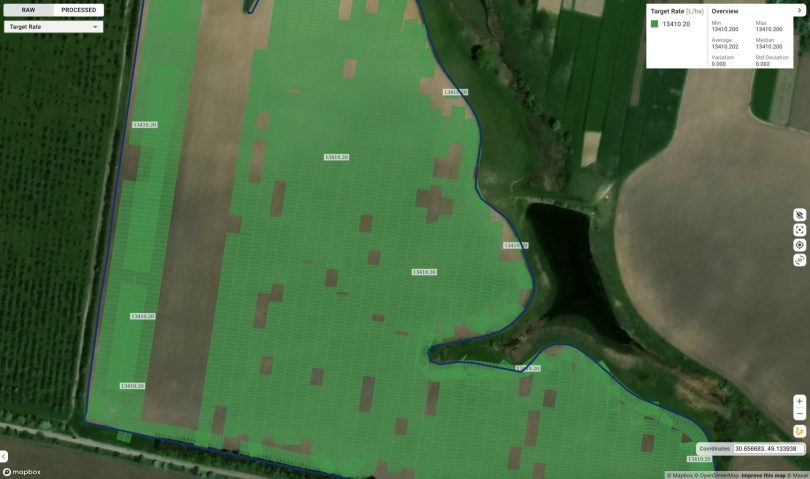
  • Target application rate map from the prescription loaded into GeoPard
  • As-applied fertilizer rate map imported into GeoPard from the machinery
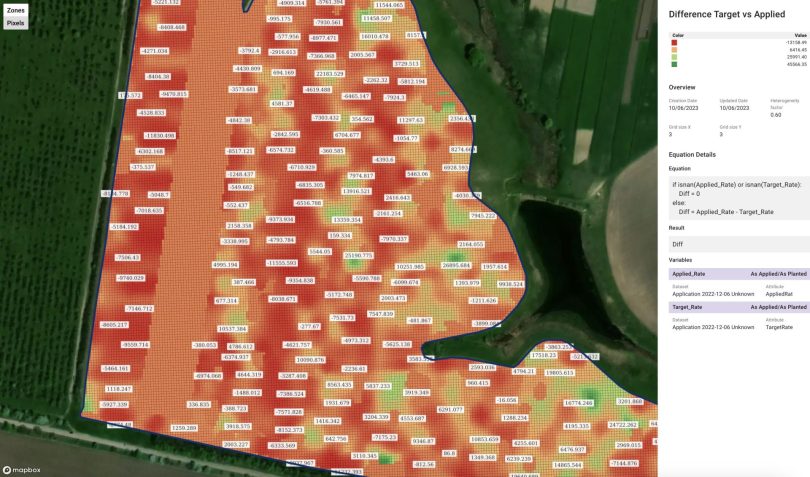
  • Difference between target and applied fertilizer rates mapped in GeoPard
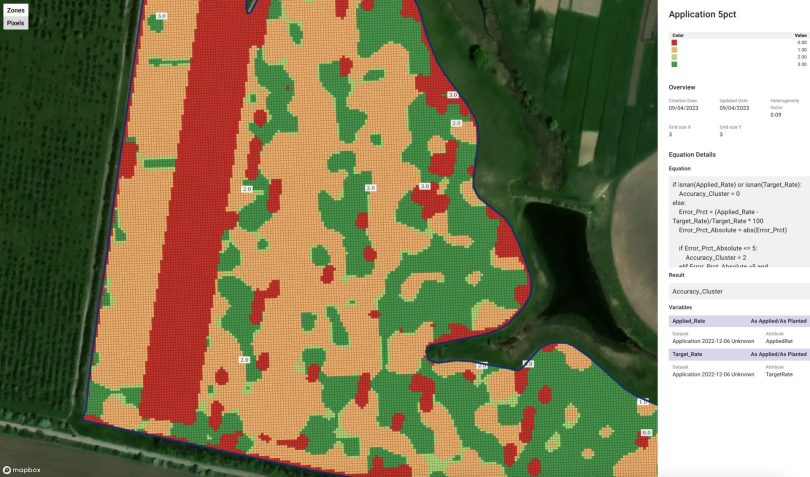
  • Application accuracy zones in GeoPard: where the applied rate matched the target and where it missed
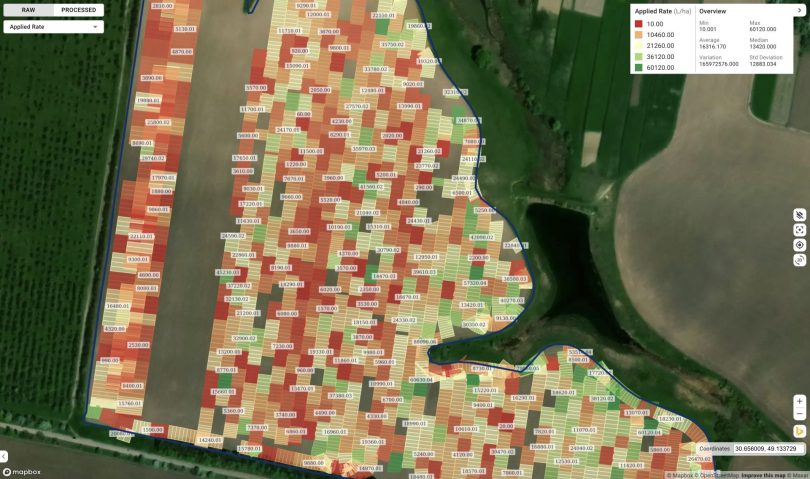
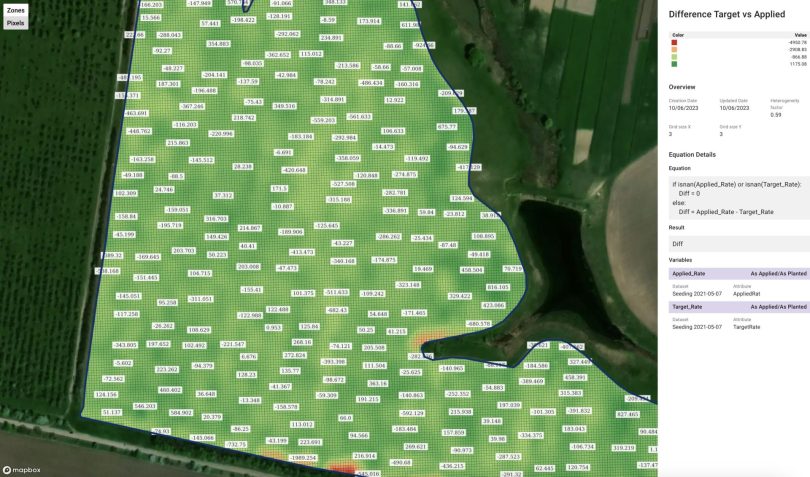
  • Seeding rate difference map in GeoPard: applied versus target seeds per hectare

Compare practices/products; stats & visuals

Compare comparable areas. Use Field potential, soil, topography, yield layers.

Use satellite imagery and advanced indices to track trials performance

Merge, split, draw trial polygons

Quantify efficacy -> based on yield, as-applied, as-planted protein

  • Strip trial design in GeoPard with treatment strips placed across field potential zones
  • Checkerboard trial layout in GeoPard with blocks of different seeding rates
  • Field potential, calibrated harvest data and trial results compared in GeoPard
  • Smart trial placement in GeoPard: trial plots located on zones with similar historical performance
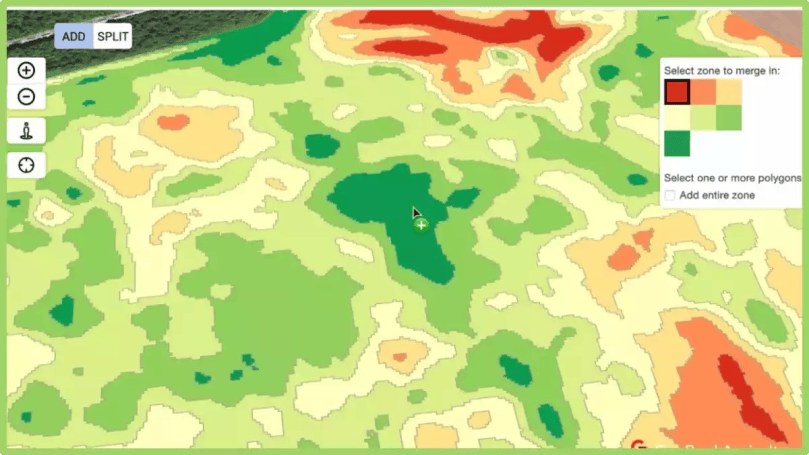
  • Merging and splitting management zone polygons by hand in GeoPard
  • Management zone statistics in GeoPard: average, area, min, max and standard deviation per zone

Economics per pixel/zone/field

Compare variable rate against uniform application to quantify potential input and cost savings

  • Profit map in GeoPard showing high, low and negative margin areas of a field
  • GeoPard rates distribution chart with input cost and savings per zone versus a flat rate
  • Zone economics in GeoPard: product cost, yield value and net result per hectare versus the field average
  • GeoPard rate step analysis: did the extra fertilizer pay for itself at each rate step
  • Profit map in GeoPard calculated from John Deere Operations Center yield and as-applied layers

Upload/ingest (manual in any format, John Deere Ops Center, CNH)

Generate yield map based on total or average yield ; restore gaps

Clean & Calibrate harvesting datasets with AI or rule-based algorithms (incl. USDA protocol)

  • GeoPard yield report: yield map, management zones and yield by zone chart
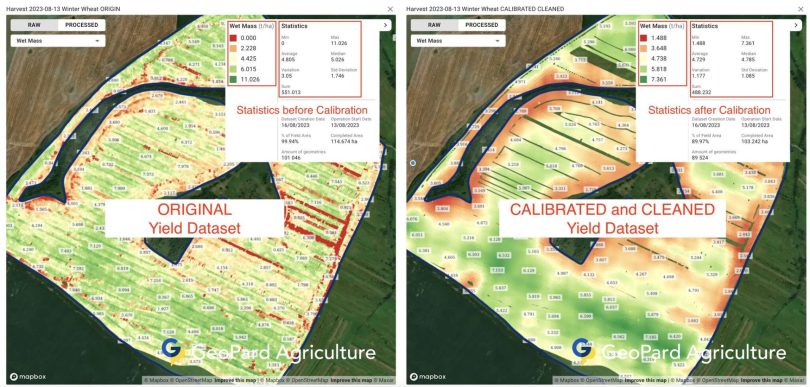
  • Original harvester yield dataset next to the cleaned and calibrated version in GeoPard
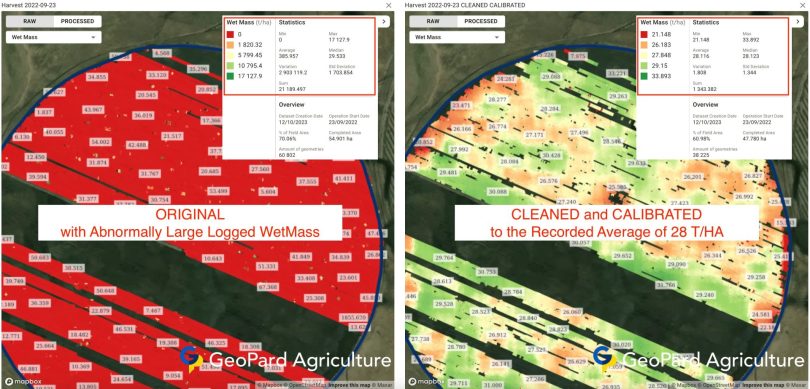
  • Yield calibration in GeoPard to a recorded field average of 28 t/ha
  • Yield data from three harvesters merged, cleaned and calibrated in GeoPard
  • Raw and processed yield map of a field in GeoPard
  • Yield per crop map in GeoPard, full field and zoomed to pixel level

Nitrogen removed with the grain (yield and protein) against nitrogen applied, mapped across the field.

Run the same equation over every field of the season in one go and compare the results.

Areas below 70 percent efficiency show where nitrogen stayed in the soil. Areas above 100 percent mined it.

The same equation logic works for potassium and phosphorus removal against the applied rates.

  • Nitrogen use efficiency map in GeoPard, percent per grid cell
  • Nitrogen use efficiency in GeoPard calculated from protein sensor and yield data
  • Distribution of nitrogen use efficiency values across a field in a GeoPard analysis
  • Hectares per nitrogen use efficiency category in a GeoPard analysis
  • Potassium use efficiency map calculated with a GeoPard equation
  • Nitrogen use efficiency map from GeoPard displayed in John Deere Operations Center
  • Sentinel
  • Landsat
  • Planet
  • Regional View
  • Contrast view
  • Advanced Indices
  • Cleaning & Calibration
  • Import any format
  • Synthetic Yield Maps
  • Planning: grids or zones, custom logic
  • Print labels
  • Execute with mobile & tablet apps
  • Import lab results
  • Analyze Soil Scanners data (EC, Veris, SoilOptix, TopsoilMapper and others)
  • Prescriptions - Zones or Equations
  • Import in any format
  • Compare and quantify planned vs applied
  • Integrate into Profitability analysis

Import, Draw, Assign Labels

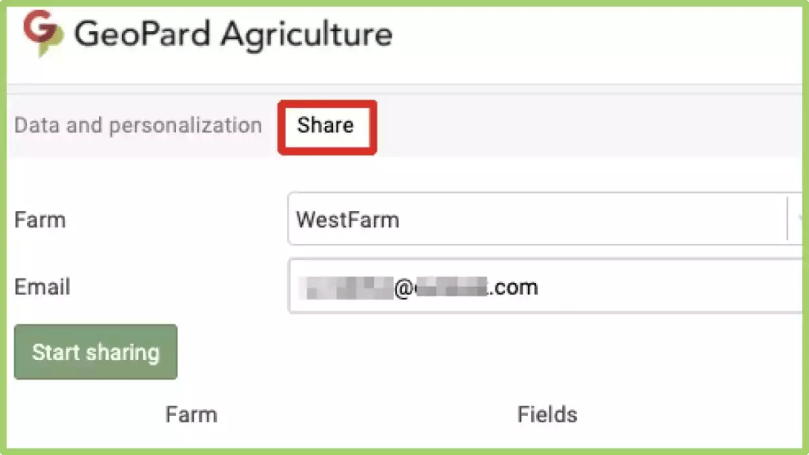
Share Farms: Create Organizations; Advisers/Farmers, Flexible roles

Export as geotiff, shapefiles, geojson, csv, machinery formats

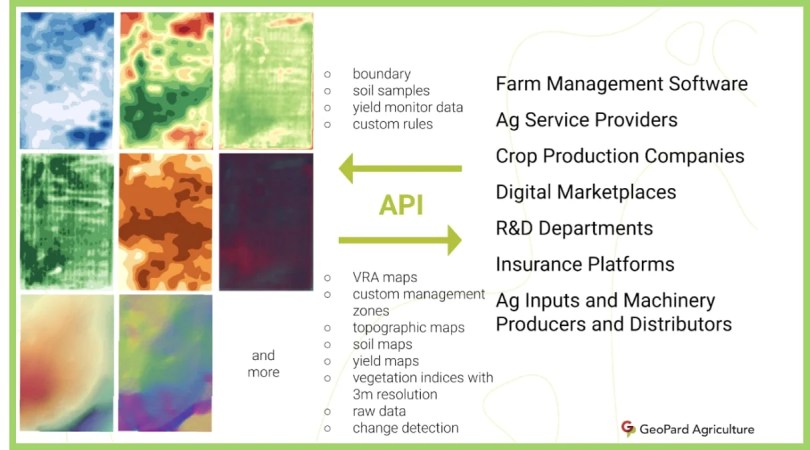
  • All-in-one precision agriculture analytics software and API: GeoPard data inputs and outputs
  • Compare layers in GeoPard: satellite, elevation and yield layers of one field side by side
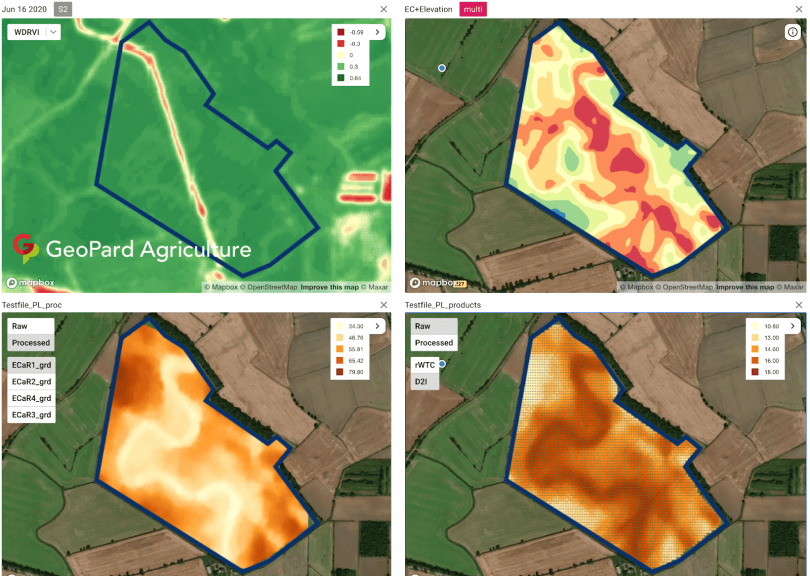
  • Four data layers of one field compared in GeoPard: vegetation index, zones map, EC and compaction
  • Sharing a farm and its data with another GeoPard user
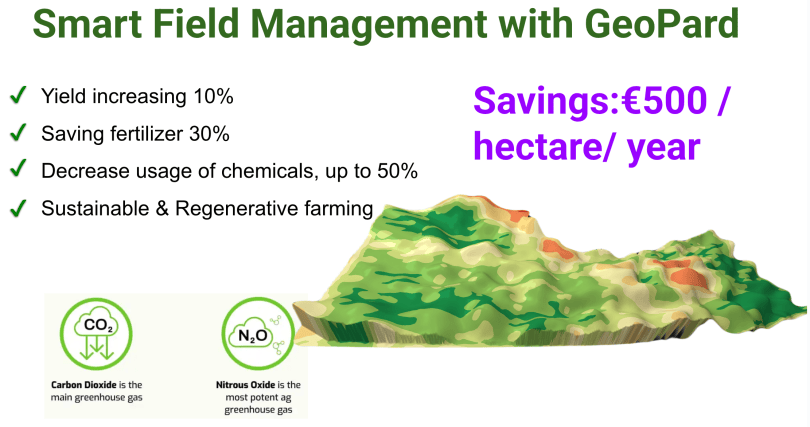
  • Smart field management with GeoPard: yield, fertilizer and chemical savings

Automated bi-directional data sync:

  • Boundaries
  • As-Applied/As-Planted
  • Harvesting data
  • Management zones/Rx
  • WorkPlans
  • Export soil , Topography, Satellite imagery, Equation layers to the Ops center

Bi-Directional integration with CNH FieldOps software

In and out integration with ArcGIS enables automating your workflows

  • GeoPard integration with John Deere Operations Center
  • John Deere Operations Center connection settings in GeoPard: boundaries, field operations and map layers
  • Exporting a GeoPard topography layer to John Deere Operations Center as a map layer
  • GeoPard elevation map displayed inside John Deere Operations Center
  • Seeding zones map exported from GeoPard as a work plan to John Deere Operations Center
  • GeoPard and John Deere Operations Center workflow: plan, execute, analyze, improve, collaborate

Export up to 60 layers in one PDF. Custom logo & design for Enterprise clients

Get custom email updates with all the operations info

  • GeoPard yield report: yield map, management zones and yield by zone chart
  • Written summary of zone performance in a GeoPard yield report
  • Yield by management zone table in a GeoPard report: area, average and difference versus the field average

GeoPard works as analytics engine for your apps

GeoPard API provides maps in milliseconds, render regional indices or field-level data

Send as-applied, as-planted and yield files through the API and get cleaned, calibrated maps back.

Run your own equations and processing chains on GeoPard layers and receive the outputs as GeoTIFF, shapefile or JSON.

  • GeoPard API: field data in, analytics maps out for farm software, dealers and R&D
  • Seeding zones map exported from GeoPard as a work plan to John Deere Operations Center
  • Water index raster calculated by the GeoPard API on 30 cm satellite imagery
  • White-label GeoPard analytics embedded under a partner brand

Ask about any field, zone or season and get an answer computed from your own layers, not a generic reply.

The assistant builds zones and variable rate maps and waits for your review before anything is exported.

The same assistant in the web app and in the GeoPard mobile app, so a question asked in the field is answered in the field.

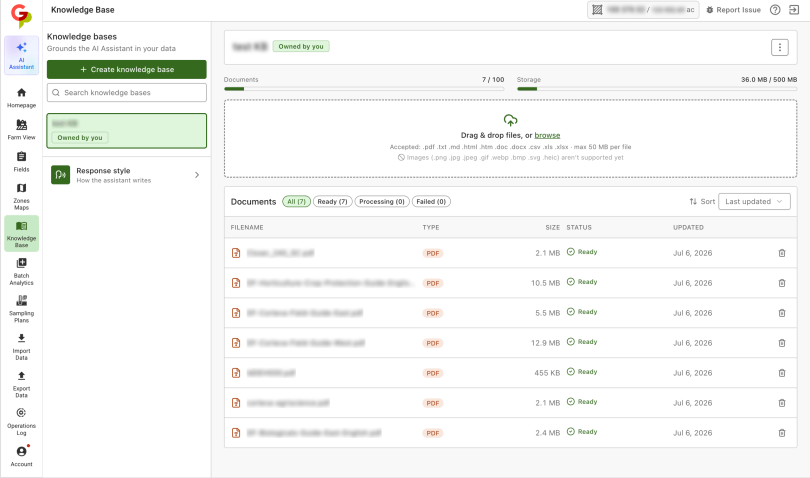
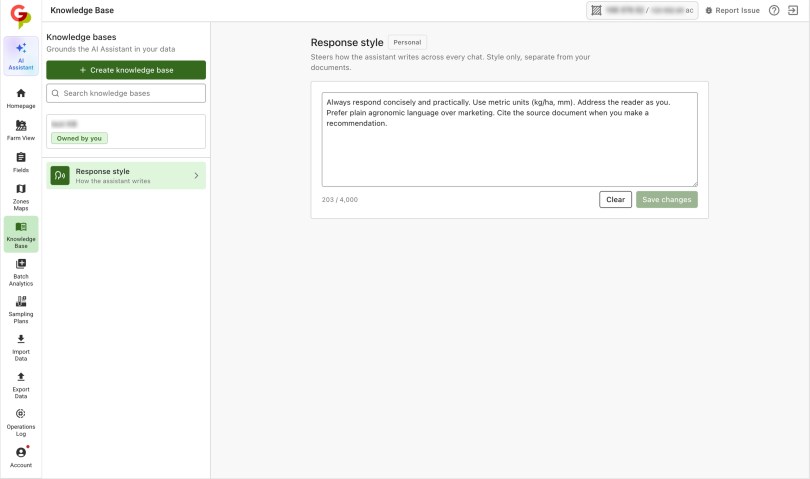
Upload your own documents to its knowledge base and set the response style. The assistant follows your agronomy.

  • GeoPard AI Assistant: reasoning agronomic AI that prepares prescriptions for review and approval
  • GeoPard AI Assistant output that passed agronomic checks before reaching the machine
  • Custom knowledge base in the GeoPard AI Assistant with uploaded agronomy documents
  • Response style settings for the GeoPard AI Assistant
  • How GeoPard AI is built: grounding, explicit parameters, deterministic math, validation and human approval

Add GeoPard as a connector and ask about your fields, zones and prescriptions in plain language.

The GeoPard MCP server gives Claude the same tools: read layers, run equations, build maps.

Every answer is computed from your field layers, not guessed. The maths runs in GeoPard; the model explains it.

Prescriptions and exports wait for your review. Nothing reaches the machine without it.

  • GeoPard AI Assistant: reasoning agronomic AI that prepares prescriptions for review and approval
  • GeoPard AI Assistant output that passed agronomic checks before reaching the machine
  • Custom knowledge base in the GeoPard AI Assistant with uploaded agronomy documents
  • Response style settings for the GeoPard AI Assistant
  • How GeoPard AI is built: grounding, explicit parameters, deterministic math, validation and human approval

AI and rule-based cleaning removes harvester errors, calibrates to the real total and fills the gaps.

A field partly under cloud stays usable: the clear part is analysed, the rest is masked.

35+ years of imagery reduced to the zones that perform the same way season after season.

A yield map built from potential, imagery and the harvested total when the combine did not log one.

  • Original harvester yield dataset next to the cleaned and calibrated version in GeoPard
  • GeoPard cloud and shadow detection keeps a clear field image usable when the surroundings are cloudy
  • 27 years of satellite history in GeoPard showing the most variable and the most stable field zones
  • Multi-year field potential map in GeoPard built from several seasons of yield and satellite data
  • GeoPard AI Assistant output that passed agronomic checks before reaching the machine

Winning teams choose GeoPard

Agriholdings, John Deere dealers, agronomists, growers and research centres, in their own words.

MHP logoVitAgro logoSergio Bassan logoPfeifer and Langen logoEurasia Group Kazakhstan logoHutson Inc. logoMercer Landmark logoLfL Bavaria logoNUBiP of Ukraine logo

“Geopard is a great tool for us to build management zones with. When we don’t have access to multiple years worth of yield data for a grower, we can utilize GeoPard and the 20+ years of satellite imagery it gives us to build our management zones.”

Isaac Hickerson
Isaac HickersonData ManagerHutson Inc., John Deere dealer, USA

“When I compare the +20 year GeoPard product map to fields we have a multiple year average yield data its a very close match. The +20 year average map is an excellent product for growers lacking good yield data.”

Jason Diller
Jason DillerPrecision Agriculture ManagerMercer Landmark, USA

“GeoPard’s analytics have made it easy for our team and farmers to use precision ag tools effectively. Reliable analytics and consistent support throughout the season have improved input planning and management.”

Edoardo Pozzato
Edoardo PozzatoPrecision Agriculture AgronomistSergio Bassan, Italy

“It is a pleasure to cooperate with Geopard. Not only the solutions are innovative, but also the service is excellent.”

Simon Luyven
Simon LuyvenProjects LeadPfeifer & Langen, Germany
Read the story

“The first year, it turned out that we already had a yield increase of 5%. I use Geopard a lot to adjust the fertilisation to the fields.”

Nicole Bartelds
Nicole BarteldsArable farmer and digital agriculture consultantDe Databoerin, Drenthe, the Netherlands
Read it in Future Farming

“Working with GeoPard has been a game-changer. It’s shifted our approach from relying on gut feeling to making decisions based on hard data. Through GeoPard’s sophisticated technology, we’re implementing precise, sub-field agronomy recommendations that are specifically tailored for each plot’s unique requirements.”

Pavlo NesterenkoHead of the Precision Farming Service GroupMHP, Ukraine
Read the story
Documentation

Every workflow in GeoPard, written down.

Search it here, and read the answer without leaving the page you are on.

Partners

Machinery integrations, data providers and the programmes behind GeoPard.

  • John Deere Operations Center integration
  • CNH Industrial
  • AGCO
  • Planet satellite imagery
  • UP42 geospatial data
  • SoilOptix soil mapping
  • FarmVu
  • AWS Partner, software
  • Google Cloud
  • Forschungszentrum Jülich
  • RootCamp agtech accelerator
  • Grand Farm
  • Agri-EPI Centre
  • Strube
  • ESA BIC NRW
  • Farm Food Climate
  • Bitkom member
  • EIT Food accelerator
  • REACT-EU
  • Kofinanziert von der EU
  • Ministerium für Wirtschaft NRW

Simplify the complexity of precision farming

GeoPard is an unbiased cloud-based Analytics Powerhouse for precision agriculture. The platform core is capable of processing any set of geospatial data.

Discover the full potential of ag fields and improve agronomic decisions. GeoPard is your reliable tool for Ag operations from planning, execution to adjusting practices based on the data.

GEOPARD

Our solutions

You are provided with a comprehensive Web and Mobile solution that allows you to store, analyze, and visualize your farm data. You’ll receive timely delivery of Rx maps and analytics.

  • Multi-layer and multi-year Management Zones & VRA Maps
  • Variable Rate Application (VRA or Rx) Maps
  • Crop Monitoring
  • Topography analytics
  • Soil data analytics
  • 3D maps
  • Yield data analytics
  • As-applied & As-planted data
  • Fields Benchmarking
  • Smart Scouting
  • Automation of all above

3D map example precision farming

combine plowing a field smart farm

With GeoPard you have automated tools to execute your agronomic and management expertise, and industry best practices during the whole season.

  • Season Planning
  • Soil Sampling
  • Soil Scanning
  • Fertilizing
  • Seeding
  • Irrigation
  • Scouting & Monitoring
  • Herbicides application
  • Fungicide, pesticides, insecticides application
  • Growth Regulators application
  • Desiccation
  • Harvesting planning
  • Trial Management
  • Post-Harvest analytics
  • Calculations of economic efficiency / Profit maps
  • Fertilizer Use Efficiency maps

Whether you are a farmer or a large agribusiness manager – let GeoPard do the heavy lifting and get all the results and solutions you need. Work remotely and collaboratively with your colleagues or business partners to prepare for the season.

  • for Growers
  • for Ag consultants and service companies
  • for Cooperatives & AgriHoldings
  • for Ag input producers and dealers
  • for Ag equipment dealers
  • for Food Producers
  • for AgTech companies
  • for System integrators

A farmer on the field uses a tablet smart agriculture

Get started with GeoPard Agriculture today!

For every passionate grower and interested.
Unbeatable yearly subscription offer with all functionality.

Try for free

How GeoPard Works

Winning teams choose GeoPard

Edoardo Pozzato Precision Agriculture Agronomist in Sergio Bassan Italy
Edoardo Pozzato

Precision Agriculture Agronomist in Sergio Bassan Italy

GeoPard’s analytics have made it easy for our team and farmers to use precision ag tools effectively. Reliable analytics and consistent support throughout the season have improved input planning and management. We are confident that the synergy between our department and GeoPard will bring significant changes and benefits to our customers.

Zachary Harmer SoilOptix®
Zachary Harmer

SoilOptix®

We are happy to have GeoPard as part of the platforms working with SoilOptix® data to enable growers and agronomists with the tools to accurately and visually analyze and manage their fields.

Databoerin-Nicole-Bartelds
Nicole Bartelds

Databoerin

GeoPard Agriculture is a system in which I can store my own data, and also receive current information from satellite images directly from my fields. A system that securely stores my own data ‘in the cloud’, so that I have access to the stored information at any time and at any location. But I also think it’s important that the data is only shared with others if I give permission for this myself, and if I no longer want to share the data, then I can immediately stop the data sharing.

Steve Larocque
Steve Larocque

Beyond Agronomy owner & FarmVU CEO

Data visualization leads to the creation of ideas and analytics helps us to solve problems. GeoPard’s platform not only helps us visualize data but also gives us the tools to analyze data so we can create solutions and write prescriptions agronomists.

Brendon-Friesen
PointForward Brendon Friesen

Operation & technology manager

Using Geopard has streamlined key parts of our workflow. In seasons where time is money, we can rely on the team at Geopard to get it done.

Isaac Hickerson
Isaac Hickerson

Data Manager in Hutson Inc.

Geopard is a great tool for us to build management zones with. When we don’t have access to multiple years worth of yield data for a grower, we can utilize GeoPard and the 20+ years of satellite imagery it gives us to build our management zones.

Luyven_Simon_
Simon Luyven

Projects Lead in Pfeifer & Langen

It is a pleasure to cooperate with GeoPard. Not only the solutions are innovative, but also the service is excellent.

Jason-Diller
Jason Diller

Precision Agriculture Manager in Mercer Landmark

When I compare the +20 year GeoPard product map to fields we have a multiple year average yield data its a very close match. The +20 year average map is an excellent product for growers lacking good yield data.

Partners

Special business solutions

We’ve facilitated the launch of many precisionAg software companies and can provide you a superior solution.
smart agriculture monitor

White label

  Your receive the best in the industry precisionAg platform (web & mobile) under your company brand. Save costs on expensive and slow development, rely on our expertise and launch your own solution in a few weeks.    

API

GeoPard solution easily plugs into any system, platform, or service. GraphQL, OGC standards, automated workflows, and more. You have access to all the data, analytics, and statistics, the same as the GeoPard team has. Use the best in the industry precisionAg analytics engine, mix it with your own ideas and business knowledge.    

Widgets

User interface widgets for direct integration. Similar to google maps that are embedded into any website, GeoPard widgets are ready to use components in your software

Mobile and Tablet Apps

Keep all necessary data always in your pocket to access it online and offline in the fields immediately.
  • Smart Scouting (geo-referenced comments, photos, logging of operations)
  • Soil sampling planning & execution
  • Tissue (plant) sampling
  • Visualization of all data layers (yield, soil, topography, vegetation, as-applied)
  • Seemless integration with your web account

Information

Mapping Rice-Cropping Pattern and Cultural Type Using Remote Sensing
Mapping Rice Cropping Pattern and Cultural Type Using Remote Sensing

Rice feeds more than 3.5 billion people globally, yet less than 60% of rice-growing areas have accurate, up-to-date cultivation maps, according to the International Rice...

Read more
Polyculture farming
Polyculture Farming: methods, advantages, and disadvantages

Polyculture in agriculture is best defined as the practice of planting several kinds of crop species on the same piece of land and at the...

Read more
Partnership with Planet

GeoPard Agriculture team is excited to partner with Planet, the largest earth observation satellite network delivering a near-daily global dataset, to enable its high-resolution and high-frequency...

Read more
wpChatIcon
wpChatIcon

    Request Free GeoPard Demo / Consultation


    By clicking the button you agree our Privacy Policy. We need it to reply to your request.

      Subscribe


      By clicking the button you agree our Privacy Policy

        Send us information


        By clicking the button you agree our Privacy Policy