
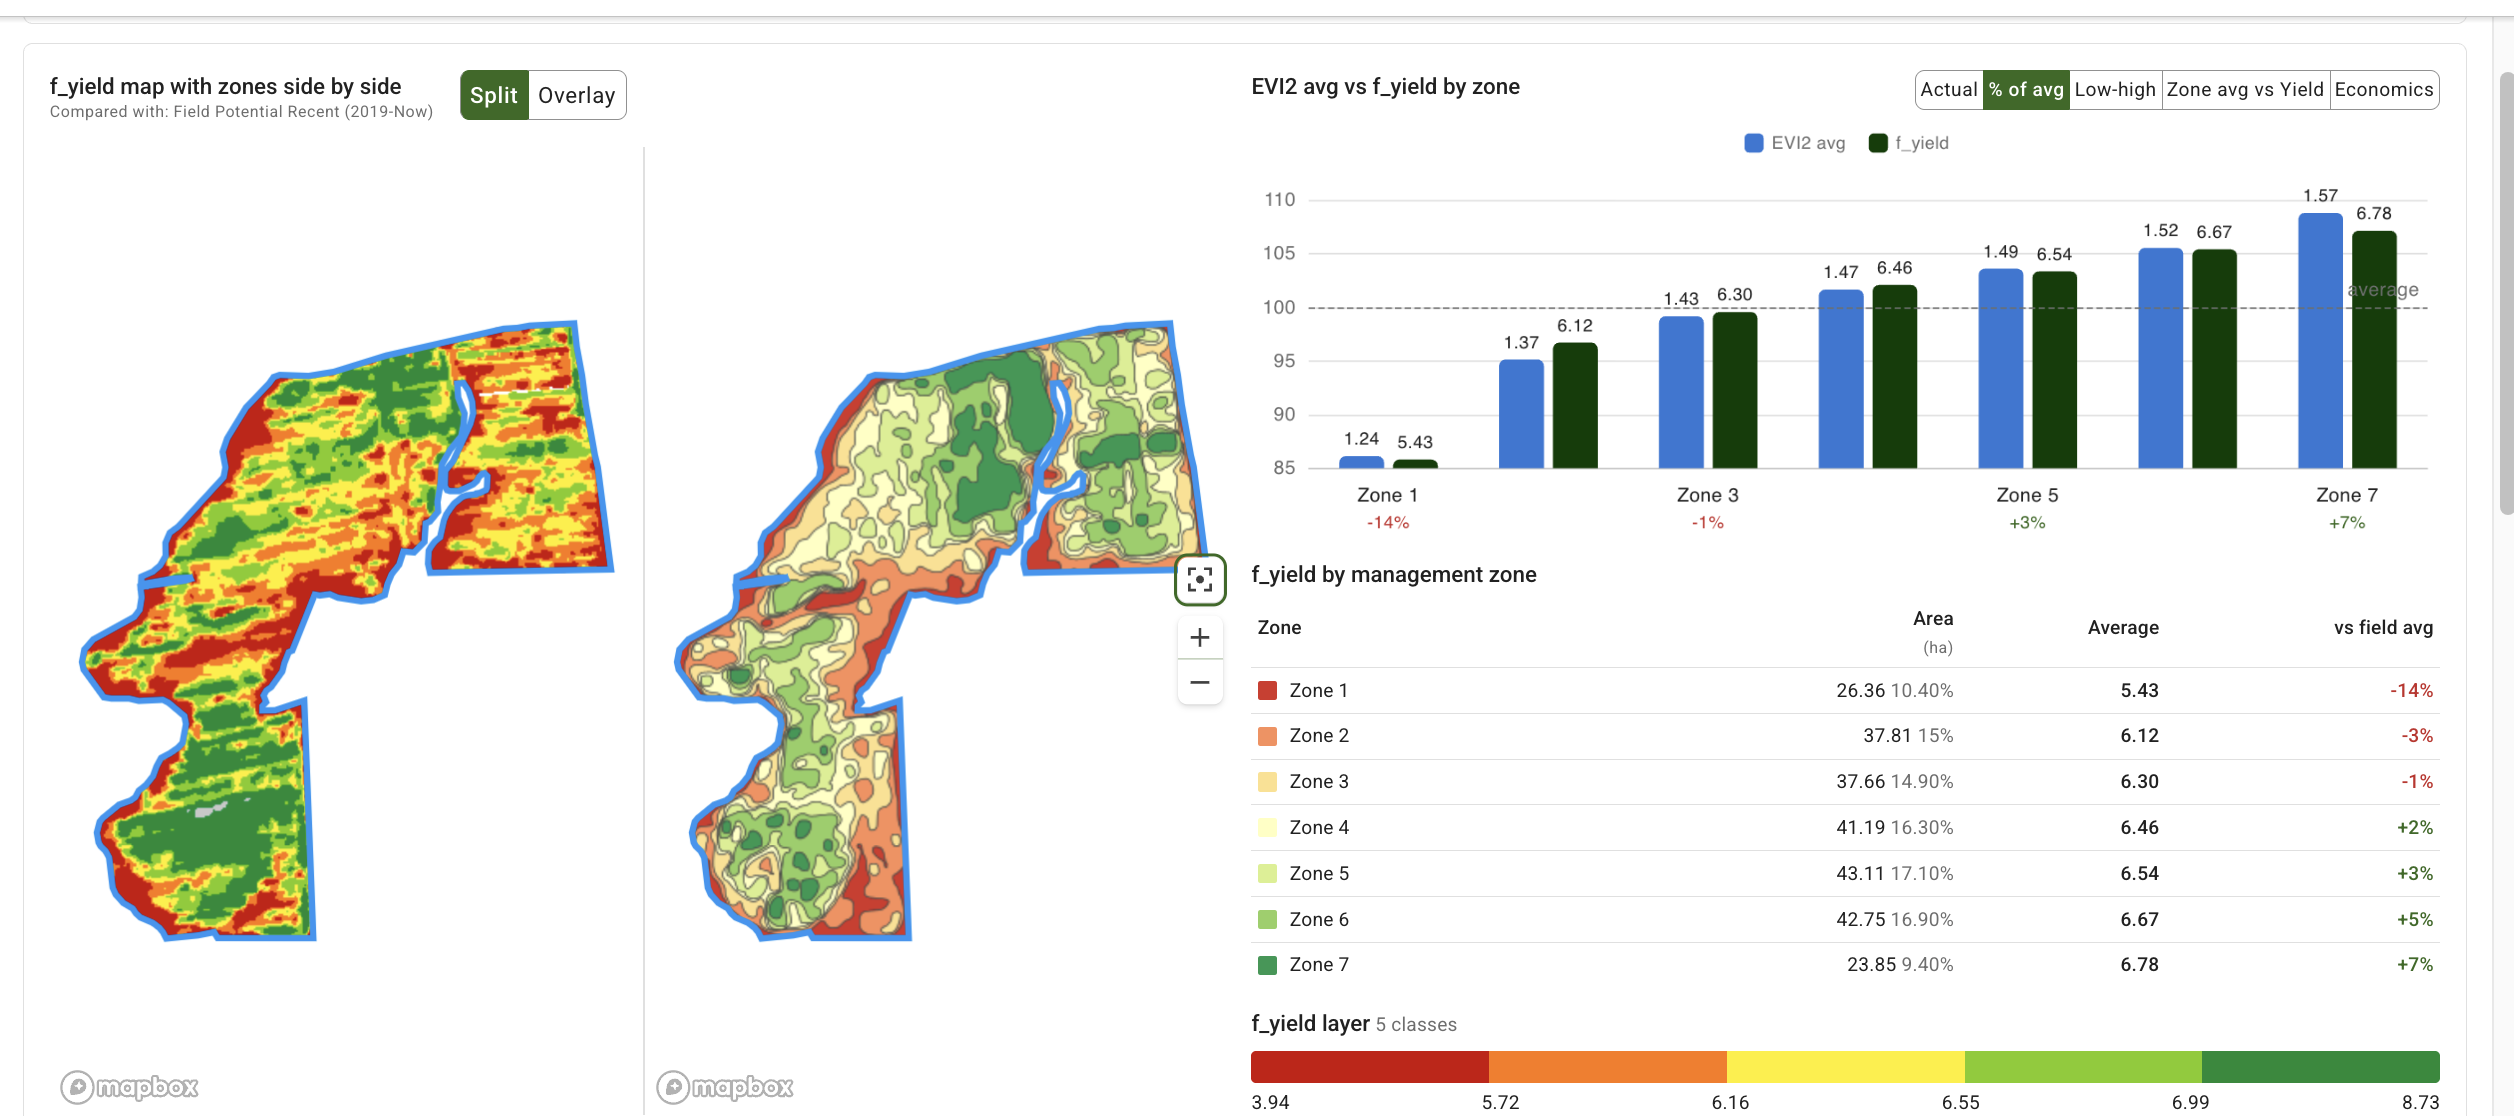


A variable rate prescription is a bet: more product where the field can turn it into yield, less where it cannot. The harvest is the only test that bet has to pass, and most farms never run it. The yield file gets cleaned, maybe mapped, and the next prescription is built from habit. This guide walks through the check itself: line the harvest up with the rates that went out, compare yield with rate zone by zone, price each rate step, and decide what changes next season.
What "paid off" means for a variable rate prescription
A prescription pays off when the extra product in the higher-rate zones bought more yield value than it cost, and the lower rates in the weaker zones saved product without giving up yield. Both halves matter. A field average tells you neither, because it blends a zone that responded strongly with one that did not respond at all.
So the unit of judgement is the rate step: the move from one zone’s rate to the next higher one. Each step has a cost (the extra product times its price) and a return (the extra yield times the crop price). Whether the step paid is a simple comparison of the two, and it is the question this whole workflow answers.
Step 1: line up the harvest with the rates that went out
You need two layers from the same season: the cleaned yield dataset and the rates. Rates come in two forms, and the difference matters more than people expect.
- The zones map carries the rates you prescribed.
- The as-applied map carries the rates the machine actually put down.
Run the comparison against both. When the two disagree, the gap is an execution problem, not an agronomic one: a controller that did not switch rates fast enough, a section that stayed at the default, a boundary that was off. Judge the agronomy on the as-applied rates, because that is the product that actually went out, and fix the execution separately.
Cleaning comes first. Calibration drift, flow delay, and overlaps put yield where no plant produced it, and the rate comparison inherits every one of those errors. If the yield file has not been cleaned, start with yield data cleaning and calibration and come back.
Step 2: compare yield with rate, zone by zone
Put the two layers side by side and read three things.

Zone averages against the field average. Which zones sit above the field average, which below, and by how much. A high-rate zone that still sits below average was probably limited by something other than the input you varied: water, compaction, pH.
The shape of the response. Sort the zones by rate and look at how yield moved as the rate went up. Yield rising and then flattening is the pattern you want to see: it marks the rate where the extra input stopped paying. A flat line across all rates means the rate variation did not change the result, which is also an answer.
Variability inside each zone. A zone whose yields spread widely is not one zone agronomically. Wide, overlapping distributions across zones mean the zones no longer describe the field and should be rebuilt from this harvest before the next prescription. University extension programs such as Iowa State University Extension publish on-farm trial guidance that treats within-zone variation the same way: a response you cannot separate from the noise is not a response yet.
Step 3: price each rate step
Now the money. For each pair of neighbouring rates, sorted from low to high:
- Step cost = extra product × product price
- Break-even yield response = step cost ÷ crop price
- Net result = (actual yield response × crop price) − step cost
- Break-even crop price = step cost ÷ actual yield response
The verdict follows the return on the extra product: a return of 20 percent or more paid off, minus 10 percent or worse did not pay, anything in between is break-even. A step with no measurable yield response cannot pay at any crop price, and it is worth saying so plainly rather than hoping a better market will fix it.
A worked example makes the thresholds concrete. Take a wheat field with three nitrogen zones at 70, 100, and 130 kg/ha, harvested at 6.09, 6.45, and 6.62 t/ha. At 200 EUR/t for the crop and 0.90 EUR/kg for the product:
- Step 70 to 100 kg/ha: 30 kg/ha costs 27 EUR/ha. Yield rose 0.36 t/ha, worth 72 EUR/ha. Net +45 EUR/ha, a 167 percent return. Paid off, and it keeps paying down to a crop price of 75 EUR/t.
- Step 100 to 130 kg/ha: the same 27 EUR/ha bought 0.17 t/ha, worth 34 EUR/ha. Net +7 EUR/ha, a 26 percent return. Paid off, but only just, and it stops paying below 159 EUR/t.
Move the product price to 1.40 EUR/kg and the second step turns into a loss of 8 EUR/ha, a minus 19 percent return. Same field, same harvest, different answer, which is exactly why the prices have to be in the calculation and not in your head.

Step 4: decide what changes next season
The verdicts translate into three kinds of decision.
Cap the rate. Where the top step did not pay, or only broke even, the next prescription stops one step lower in those zones. In the example above, capping at 100 kg/ha would have kept almost all of the yield and saved the last 30 kg/ha on a quarter of the field.
Rebuild the zones. Where the within-zone spread was wide, build next season’s zones from this harvest instead of carrying the old map forward. Zones that reflect what the field actually did are the cheapest improvement available.
Fix execution before agronomy. Where prescribed and applied rates disagreed, no rate change will help until the machine follows the map. Sort that out first, then judge the response next season.
One caution belongs here. Zones differ in potential, so a strong response in one zone does not prove the same step will pay in another. Confirm rate changes with trial strips before you scale them across the farm, and validate rates with your agronomist, crop plan, soil tests, and product labels. Extension services such as Purdue Extension have practical guides on laying out on-farm strip trials that keep the comparison fair.
Where the Automated Yield Report fits
Everything above can be done by hand in a spreadsheet, once. Doing it for every field, every season, is where it dies. The Automated Yield Report in GeoPard runs the whole check from the field’s Yield Report tab: it lines up the cleaned yield dataset with the season’s zones map or as-applied map, shows yield against rate zone by zone, prices every rate step with the formulas above, flags the verdict for each step, and writes a plain-language summary with suggestions that open the next workflow. Export PDF gives you the same report for the grower meeting or the landlord.

If you would rather ask than click, the GeoPard AI Assistant works on the same yield, zones, and as-applied data: ask why a zone underperformed, or have it build next season’s zones from this harvest. And if you only want a quick look at a yield or as-applied file before importing anything, the Field Data Explorer reads it in the browser.
Frequently asked questions
Do I need the zones map or the as-applied map?
Both, ideally. The zones map validates the prescription as designed; the as-applied map validates what the machine did. Where they differ, the as-applied comparison gives the truer economics because it prices the product that actually went out.
What if my zones map has no rates on it?
You can still compare zone performance against the field average and see whether the zones hold together, but the rate-step economics need rates. Use the as-applied map from that season for the money view.
How many seasons before I trust the result?
One season tells you what happened in that season’s weather. Two or three that agree tell you something about the field. Treat a single-season verdict as a reason to run a trial strip, not as a reason to change the whole farm.
Economics








 English
  German
  Ukrainian
  French
  Kazakh
  Portuguese
  Spanish
  Arabic
  Swedish
  Serbian
  Romanian
  Norwegian
  Finnish
  Lithuanian
  Estonian
  Latvian
  Croatian
  Slovenian
  Slovak
  Japanese
  Polish