Cropped raster data based on field boundary sounds very simple. Some data sources are rasters with pixels and a resolution of 3m/10m/30m, others – are vectors with polygons or multipolygons.


The accurate boundary of the cropped raster data is tricky. The default output most gis and precision agriculture software have is a pixelated raster. Precise data evaluation close to the field boundary helps you better to understand, for example, canopy conditions, slope value.
Examples of pixelated rasters:
Is it possible to improve and to make it more accurate?
Yes, GeoPard does that and even makes data available for further integration via API. Some examples:
- Crop of raw (RedGreenBlue and NearInfrared views) satellite imagery based on field boundary:


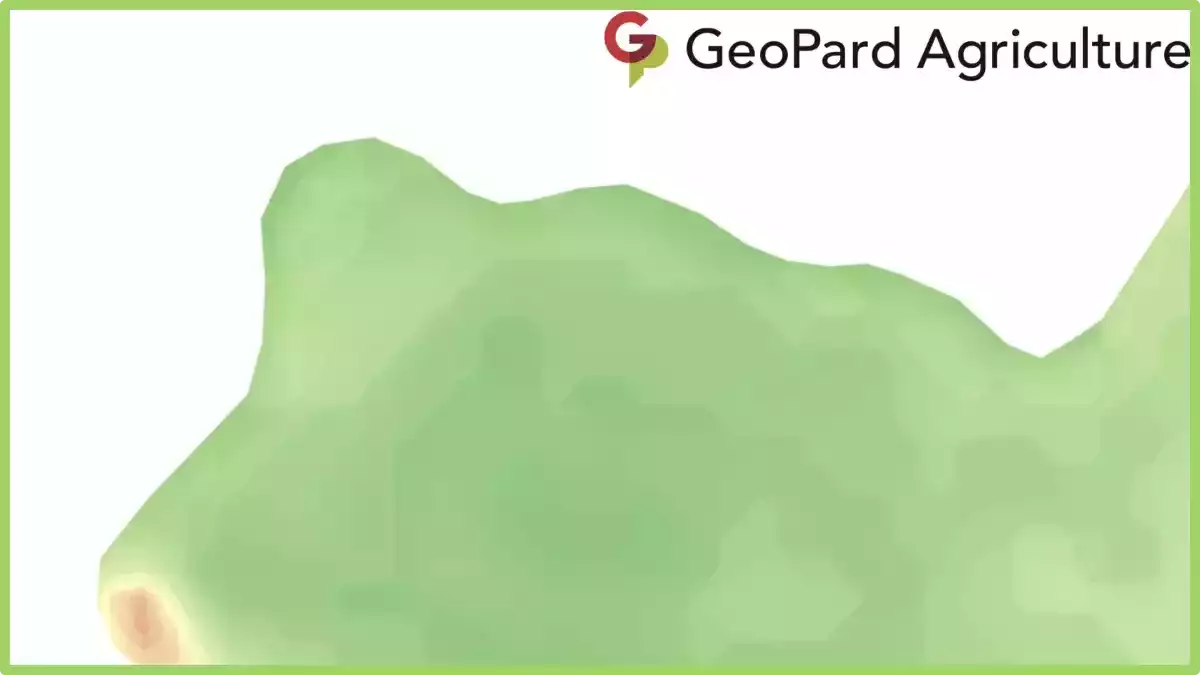
- Crop of satellite imagery with vegetation index like WDRVI based on the field boundary:

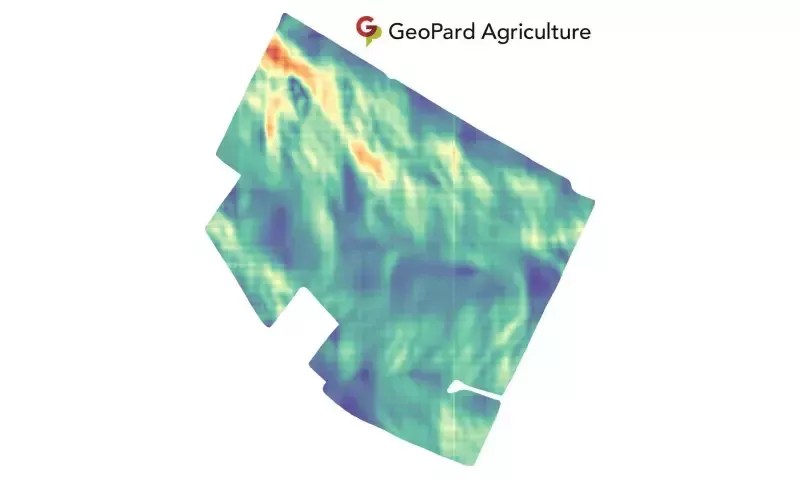
- Crop of digital topography dataset (elevation and roughness) based on the field boundary:

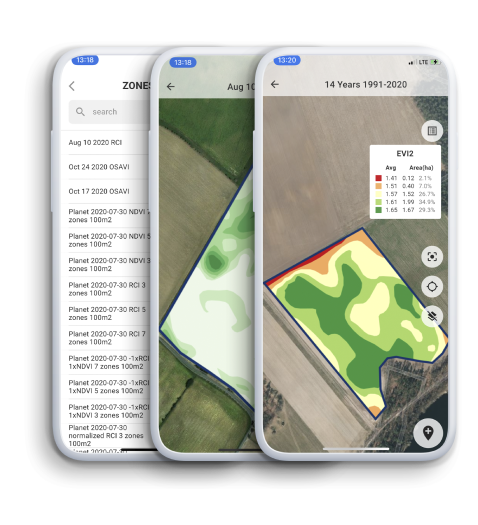
How it looks in GeoPard interface and how it can be integrated in your ag tech solution:


We at GeoPard understand the value of such details and are constantly working to improve the solution.
What is Raster Data?
Raster data is a type of digital image data that is represented by a grid of pixels or cells, where each cell corresponds to a specific location on the earth’s surface. Each pixel in a raster image is assigned a value that represents a particular attribute or characteristic of that location, such as elevation, temperature, or land cover.
It is commonly used in geographic information systems (GIS) and remote sensing applications to represent and analyze various types of spatial data. It can be collected from a variety of sources, including satellite and aerial imagery, digital cameras, and ground-based sensors.
It is often stored in various formats, such as GeoTIFF, JPEG, and PNG, which are designed to compress and store the data efficiently. GIS software and image processing tools can be used to manipulate and analyze data, such as by performing calculations on the pixel values or applying filters to enhance certain features.
Examples of applications include mapping land use and land cover, analyzing changes in vegetation over time, and predicting crop yields based on environmental factors.
How Raster Data Used In Precision Agriculture?
It is an essential component of precision agriculture, as it provides detailed information about crop health, soil properties, and environmental factors that can be used to make more informed decisions about crop management. Here are some examples of how raster data is used in precision agriculture:
- Crop health analysis: Remote sensing data in the form of satellite imagery or drone imagery can be used to generate data layers that show vegetation indices such as NDVI (Normalized Difference Vegetation Index) or NDRE (Normalized Difference Red Edge). These indices help identify areas of the field with healthy vegetation, as well as areas where crops may be under stress due to disease, pests, or nutrient deficiencies.
- Soil analysis: Soil data, such as soil moisture content or soil texture, can be collected using sensors that generate data layers. These layers can help identify areas of the field with varying soil characteristics, which can inform decisions about fertilization, irrigation, and other soil management practices.
- Environmental analysis: Data layers that show environmental factors such as temperature, precipitation, and wind speed can be used to model crop growth and predict yield. These layers can also help identify areas of the field that are prone to erosion, flooding, or other environmental problems.
- Variable rate application: It can be used to generate prescription maps for variable rate application of inputs such as fertilizer or pesticides. By applying inputs at varying rates according to the needs of different areas of the field, farmers can reduce waste and optimize crop growth.
Overall, raster data is a crucial tool in precision agriculture, as it provides detailed information about crop and soil conditions that can be used to make more informed decisions about crop management.
Crop monitoring