There are several vegetation indices that are commonly used, including the Normalized Difference Vegetation Index (NDVI), Wide Dynamic Range Vegetation Index (WDRVI), and Green Chlorophyll Index (GCI).
- Which vegetation index reflects more details?
- Which vegetation index shows variation better?
- Is NDVI the best in the multispectral vegetation index family?
The questions are known and coming up very often. Let’s investigate.


What is vegetation index?
Vegetation index is a numerical measure that quantifies the amount and condition of vegetation in a specific area based on remote sensing data.
Vegetation indices are calculated by combining different spectral bands from satellite imagery or aerial photography, which reflect the amount of energy absorbed and reflected by plants in the visible and near-infrared regions of the electromagnetic spectrum.
These indices can provide information about the health, density, and productivity of vegetation, which is useful for a wide range of applications, including agriculture, forestry, land management, and climate monitoring.
What is Normalized Difference Vegetation Index (NDVI)?
NDVI (Normalized Difference Vegetation Index) is the most famous and widely used in industries related to biomass and remote sensing.
NDVI saturation affects the accurate distinguishing of vegetation at biomass peaks. Another issue with NDVI is the soil noise effect on the early stages of crop development.
It is calculated using satellite or aerial remote sensing data, based on the difference in the reflectance of two spectral bands: the near-infrared (NIR) and the red band.
The NDVI formula is NDVI = (NIR-Red) / (NIR+Red).
Where NIR is the reflectance in the near-infrared band and Red is the reflectance in the red band.
The resulting NDVI value ranges from -1 to +1, with higher values indicating a higher density of vegetation. A value of zero indicates no vegetation, while negative values indicate water bodies or other non-vegetated surfaces.
NDVI values close to +1 indicate dense and healthy vegetation, while values closer to zero indicate sparse vegetation or areas with significant stress or damage.
It is widely used in agricultural and ecological applications to monitor vegetation growth, estimate crop yields, and assess the health and productivity of forests and other ecosystems.
It can also be used to detect and monitor drought, soil erosion, and other environmental factors that affect vegetation cover.
It, for example, is calculated by subtracting the reflectance in the near-infrared (NIR) band from the reflectance in the red band and dividing the result by the sum of the two. The resulting value ranges from -1 to +1, with higher values indicating higher levels of vegetation.
Furthermore, the idea of WDRVI (Wide Dynamic Range Vegetation Index) was created to resolve NDVI saturation issues. It was reached by expanding the range of possible WDRVI values via the introduction of the mathematical coefficient (α).

The NDVI (normalized difference vegetation index) formula was transformed into WDRVI = (α∗NIR-Red) / (α∗NIR+Red).

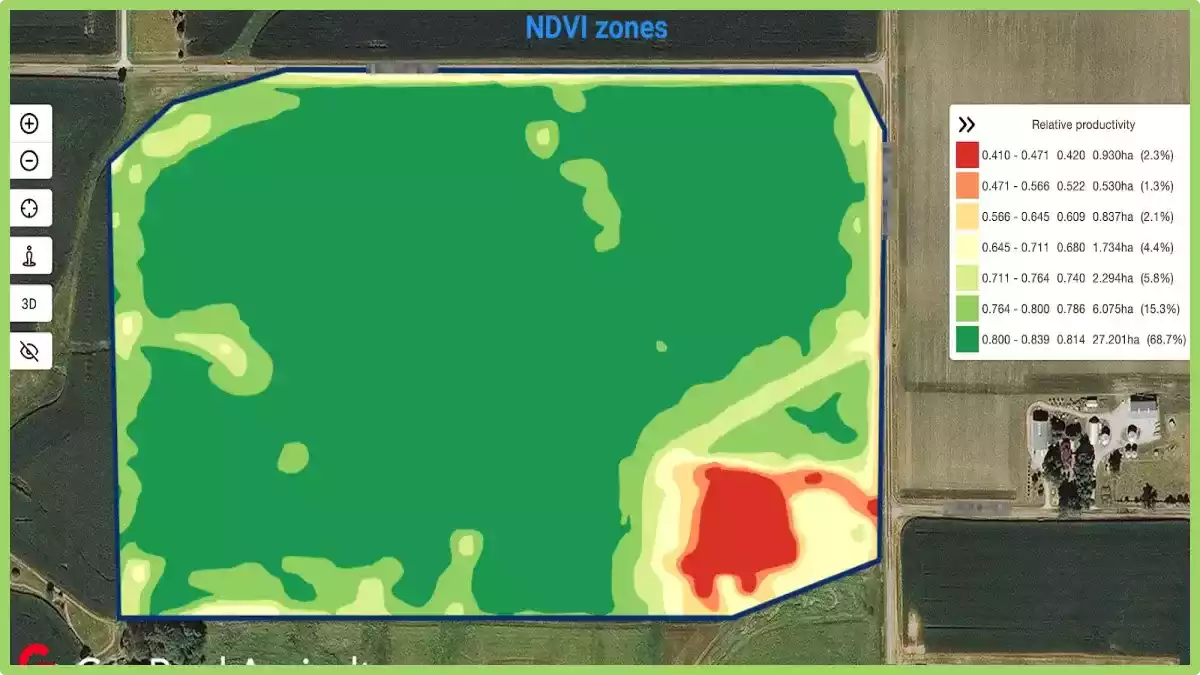
Zones built based on WDRVI are better compared to NDVI zones. Nevertheless, they are still not ideal because of too high biomass.
GCI (Green Chlorophyll Index) is used to estimate leaf chlorophyll content in the plants based on near-infrared and green bands. In general, the chlorophyll value directly reflects the vegetation.
The GCI formula looks like GCI = NIR / Green – 1.

Zones built based on GCI better distinguish high biomass spots compared to NDVI and WDRVI. The details help to manage the field more accurately and efficiently.
RCI (Red Chlorophyll Index) incorporates the same chlorophyll content knowledge base as GCI and reflects it via the red multispectral band.
The RCI formula looks like RCI = NIR / Red – 1.

Zones based on RCI are accurate as GCI zones.
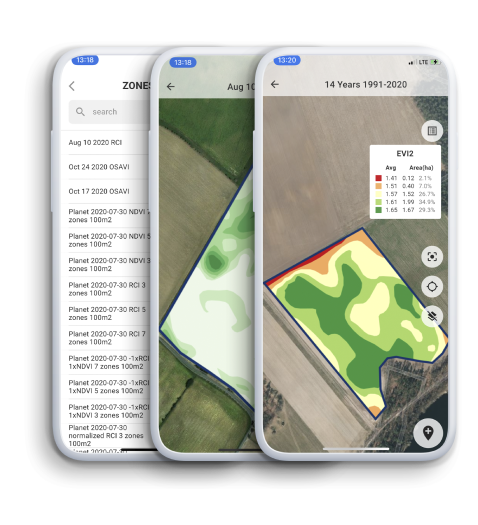
Keep tracking your fields and utilize the right vegetation index at the right moment during the season. A large family of vegetation indices is available in GeoPard right now.
Precision Farming