Delineation of Site-Specific Management Zones to Enhance Growth of Onion

Global green onion production surpassed 105 million metric tonnes in 2024, yet field-level nutrient use efficiency in most commercial farms remains below 40%, according to the FAO’s 2024 crop nutrition report — a gap that site-specific management zones directly address.

The delineation of site-specific management zones for green onion (Allium cepa L.) is emerging as one of the most actionable strategies in precision horticulture, allowing growers to match fertilizer inputs precisely to the spatial variability of their soils.  By combining geostatistical analysis, cluster algorithms, GIS mapping, and crop-based indicators such as NDVI and SPAD values, farmers can divide a single field into distinct treatment units, each receiving the exact nutrient blend it needs.

Why Green Onion Farming Demands a New Approach to Nutrient Management

Green onion (Allium cepa L.) ranks among the world’s most economically significant vegetable crops, generating an estimated USD 14.8 billion in global trade value in 2025, according to the International Trade Centre. Beyond its commercial weight, green onion is a dietary staple across Asia, the Middle East, and Latin America, where it contributes critical micronutrients and bioactive compounds to millions of diets.

Its short growth cycle — typically 60 to 90 days from planting to harvest — makes it attractive for intensive cropping systems, but that same compactness leaves almost no margin for poor nutrient timing or spatial mismanagement. The central challenge in green onion production is that no field is uniform.

Soil organic matter, pH, available nitrogen, drainage capacity, and microbial activity all vary from one corner of a field to the next, sometimes dramatically within a few meters. When farmers apply fertilizer at a single uniform rate across the entire field — the conventional approach — they inevitably over-fertilize some zones and under-fertilize others.

The result is wasted input costs, environmental pollution from excess nutrient leaching, and inconsistent crop quality that fails to meet the grading standards of modern export markets. This is where delineation of site-specific management zones (SSMZs) steps in as a transformative solution.

The concept comes from the broader field of precision agriculture, and it works by identifying areas within a field that share similar soil characteristics and crop response potential, then treating each zone as an independent management unit. For green onion specifically, this approach aligns nutrient supply with the crop’s spatially variable demand — and the science behind it is now robust enough for practical farm implementation.

Understanding Site-Specific Management Zones in Precision Agriculture

A site-specific management zone (SSMZ) (a discrete sub-area of a field that exhibits relatively homogeneous soil properties and crop production potential) is the foundational unit of precision agriculture. The logic is straightforward: if you cannot manage what you cannot measure, you certainly cannot improve what you treat as uniform when it is not.

SSMZs replace the assumption of field-level homogeneity with spatial reality derived from actual data. Spatial variability — the natural and human-induced differences in soil and environmental properties across a field — drives almost every aspect of crop performance.

In a conventionally managed field, a patch of compacted, low-organic-matter soil and an area of deep, fertile loam receive identical fertilizer applications. The compacted patch may reach toxic salt levels while the fertile patch remains underfed. This mismatch is both a productivity loss and an environmental liability.

The factors that drive field variability in vegetable production are numerous. Soil texture determines water-holding capacity and nutrient retention. Organic matter governs nitrogen mineralization rates and biological activity. Elevation and slope influence drainage, erosion history, and microclimate.

Fertility history — past application patterns, crop rotations, erosion events — leaves lasting fingerprints on nutrient availability. For green onion, which is particularly sensitive to nitrogen, potassium, and sulfur levels, these variations translate directly into yield and quality differences visible at harvest.

Delineating SSMZs provides concrete benefits for vegetable crop farmers. It reduces total fertilizer expenditure by targeting inputs only where needed. It improves environmental compliance by minimizing off-field nutrient movement. It raises the uniformity of produce, which is critical for meeting supermarket grade specifications. And it gives farmers a documented, map-based record of their field’s productivity potential that can be refined season after season.

What Makes Zone-Based Management So Relevant For Onion Biology

Green onion’s nutrient demands are not constant — they shift substantially across its growth stages, making spatial precision in fertilizer placement even more important. During early vegetative establishment (weeks one through three), the crop prioritizes phosphorus for root elongation and nitrogen for leaf initiation.

In the rapid bulbing and leaf-expansion phase (weeks four through seven), potassium demand surges to regulate turgor pressure and carbohydrate partitioning. In the final maturation stage, sulfur becomes critical for the synthesis of the cysteine sulfoxide compounds that give onion its characteristic pungency and shelf life.

The root system of green onion is shallow and fibrous, typically extending no deeper than 30 to 40 centimeters, with the bulk of active uptake occurring in the top 15 to 20 centimeters of soil. This means the crop is entirely dependent on the nutrient status of the topsoil horizon — which is also the layer most affected by spatial variability in

  • organic matter,
  • compaction, and
  • irrigation distribution.

A zone with lower water-holding capacity will experience faster nutrient leaching from this critical root zone, meaning the same fertilizer dose delivers significantly less benefit than in adjacent, better-structured soil.

Green onion is notably sensitive to soil salinity. At electrical conductivity (EC) values above 1.2 dS/m (a threshold equivalent to roughly 770 mg/L of dissolved salts), growth and bulb development are measurably suppressed.

In fields with variable irrigation history or where fertilizer has accumulated unevenly over seasons, EC can vary from 0.6 to above 2.0 dS/m within a single 1-hectare block. Without zone delineation, blanket fertilizer applications will push high-EC zones further into stress while leaving low-EC zones under-nourished.

The quality parameters that define marketable green onion — bulb diameter, leaf length, chlorophyll content, total soluble solids (TSS), and pungency score — are all directly modulated by the adequacy and spatial precision of nutrient supply. Crops receiving balanced, zone-appropriate nutrition consistently produce tighter size grades and superior post-harvest shelf life, directly improving farm revenue.

The Data Foundation for Zone Delineation

1. Soil Properties That Drive Zone Boundaries

Soil sampling is the starting point for any SSMZ delineation exercise. The choice of sampling design matters enormously. Grid soil sampling (collecting samples at regular spatial intervals, typically every 0.5 to 1 hectare) generates the density of data points needed for reliable interpolation. Each sample is analyzed for soil texture (sand, silt, clay fractions), organic matter content, pH, electrical conductivity, and available macro- and micronutrients including

  • nitrogen (N),
  • phosphorus (P),
  • potassium (K),
  • sulfur (S),
  • zinc (Zn), and
  • iron (Fe).

Soil organic matter is particularly important as a zone-defining variable because it integrates multiple processes — water retention, cation exchange capacity, nitrogen mineralization, and biological activity — into a single measurable indicator. Fields where organic matter ranges from 0.8% to 2.5% across a 2-hectare block will exhibit profoundly different nitrogen availability even under identical fertilizer regimes.

Similarly, soil pH governs phosphorus availability in ways that dwarf the influence of applied P rates: at pH 5.5, phosphorus fixation by aluminum and iron can immobilize up to 80% of applied phosphate, while at pH 6.5 the same dose achieves 70 to 80% plant availability. Key soil properties used for zone delineation in green onion production include the following:

  • Soil texture and bulk density, which determine hydraulic conductivity and root penetration resistance, directly affecting nutrient movement through the profile and the crop’s physical ability to access deeper moisture reserves.
  • Soil organic matter content, which is the primary driver of native nitrogen supply and microbial activity, and which can be mapped cost-effectively using visible-near-infrared (VNIR) soil spectroscopy across a field.
  • Soil pH and electrical conductivity (EC), which control the chemical availability of all major and minor nutrients and can be measured in real time with GPS-linked mobile sensors dragged across the field surface.
  • Macronutrient status (N, P, K, S) and micronutrient levels (Zn, Fe, Mn, B), which represent the immediate nutritional starting point for each zone and determine the corrective amendment rate required before planting.

2. Crop-Based Indicators for Validating Zone Boundaries

Soil data alone does not tell the complete story. Crop response indicators collected during the growing season validate and refine the zone boundaries identified from soil maps. NDVI (Normalized Difference Vegetation Index, a satellite or drone-derived measure of green biomass and photosynthetic vigor) is the most widely used crop indicator in SSMZ work.

It quantifies how much light a crop canopy absorbs in the near-infrared range relative to visible red light, producing values between -1 and +1 where well-nourished green onion typically scores 0.55 to 0.75 during peak vegetative growth.

SPAD values — readings from a hand-held chlorophyll meter (Soil Plant Analysis Development meter) that estimate leaf chlorophyll content non-destructively — provide a direct proxy for nitrogen nutritional status at the leaf level.

Research published in the journal Agronomy (2023) demonstrated that SPAD values in green onion leaves below 42 reliably indicated nitrogen deficiency requiring corrective top-dressing, while values above 55 signaled luxury consumption and potential N loading into the soil. Mapping SPAD variation across a field produces a real-time nitrogen status map that complements pre-season soil nitrate data.

Plant height, leaf number, and fresh biomass per unit area are additional crop-based indicators collected at zone-representative sampling points. These physical measurements ground-truth the zone classifications derived from remote sensing data and soil chemistry, ensuring that the final zone map reflects actual crop performance rather than predicted performance alone.

3. Environmental and Topographic Factors

Topographic data collected by GPS-enabled surveying or derived from digital elevation models (DEMs) adds a critical physical layer to zone delineation. Elevation differences as small as 0.5 meters within a flat-looking field can create meaningful differences in

  • drainage,
  • cold air pooling, and
  • irrigation run-off patterns.

Slope aspect influences soil temperature and evapotranspiration, while concave landscape positions accumulate water, organic matter, and leached nutrients over time, making them systematically more fertile than convex ridgeline positions. Soil moisture variability, measured with time-domain reflectometry (TDR) sensors or estimated from thermal infrared imagery, captures the dynamic water availability across zones.

Since nutrient uptake by green onion roots is primarily mass-flow driven (nutrients move to roots dissolved in soil water), zones with chronically lower moisture content deliver less nutrient mass to roots even when the chemical concentration in soil solution is identical to wetter zones.

Moshia et al. (Journal of Plant Nutrition, 2024) found that fields delineated into three SSMZ classes based on combined soil EC, organic matter, and NDVI data achieved a 31% reduction in total nitrogen applied compared to uniform-rate management, while simultaneously increasing marketable yield by 18% in the high-potential zone and maintaining yield parity in the medium zone.

Growers can cut nitrogen costs by nearly one-third without sacrificing yield by redirecting savings from over-fertilized zones to correctly dosed high-potential areas.

Methods for Delineating Management Zones

Raw soil and crop data collected from grid sampling and remote sensing must be transformed into actionable zone maps. This transformation follows a logical sequence of analytical steps that moves from raw point data to smooth continuous maps to discrete management classes.

1. Grid soil sampling at a spatial density of 1 sample per 0.5 to 1 hectare produces georeferenced data points. Each point carries coordinates from GPS and laboratory values for the measured soil properties.

2. Geostatistical analysis (a family of spatial statistics methods that model the structured spatial dependence between sample points) begins with variogram modeling. A variogram quantifies how soil property similarity decreases as the distance between two points increases. The fitted variogram model then defines the interpolation weights used in the next step.

3. Kriging (an optimal spatial interpolation method that uses variogram parameters to estimate values at unsampled locations with a measurable prediction uncertainty) converts point data into continuous raster maps of each soil property. Unlike simpler methods such as inverse distance weighting, kriging also produces a prediction error map that tells the analyst where more sampling is needed.

4. K-means clustering (an unsupervised machine learning algorithm that groups raster cells into k classes by minimizing within-cluster variance across multiple input layers) is then applied to the stack of kriged soil property maps. Each raster cell is assigned to the cluster whose centroid it is closest to in multivariate space, producing a discrete zone map with a user-specified number of zones — typically two to five for practical management purposes.

5. GIS software (Geographic Information Systems platforms such as QGIS, ArcGIS, or SAGA) serves as the integration environment where kriged soil maps, satellite NDVI layers, topographic data, and historical yield maps are combined, analyzed, and visualized as final SSMZ maps ready for field use.

6. Zone validation is conducted by comparing predicted zone class with field-observed crop performance metrics (SPAD, plant height, NDVI) collected from representative transects crossing zone boundaries. Boundaries that do not correspond to observable crop transitions are refined by adjusting the number of clusters or the weight assigned to individual input layers.

Nutrient Management Strategies Specific to Each Management Zone

1. Variable Rate Fertilization by Zone

Variable rate fertilization (VRF) (the practice of applying different fertilizer rates to different field zones based on spatially explicit soil and crop data) is the direct operational output of SSMZ delineation. Each zone receives a prescription rate calculated from the difference between its current soil nutrient status and the crop’s documented uptake requirement per unit yield target.

This agronomic principle — sometimes called the sufficiency approach — avoids both under-supply and the economically and environmentally damaging practice of applying insurance-style excess nutrients.

Nitrogen management under VRF requires particular care in green onion because the crop’s N demand peaks sharply during the rapid leaf-elongation phase and nitrogen availability in soil is highly dynamic. Zones with higher organic matter content mineralize more native nitrogen over the season, reducing the need for synthetic N applications.

Research in Scientia Horticulturae (2025) reported that green onion plots in high-organic-matter zones required on average 35 kg N/ha less synthetic nitrogen than identical plots in low-organic-matter zones to reach equivalent SPAD targets and final leaf nitrogen concentrations.

Phosphorus and potassium adjustments by zone are based on soil-test P and K levels relative to sufficiency thresholds established for Allium crops — typically 25 to 40 mg P/kg soil and 150 to 200 mg K/kg soil for optimal green onion performance.

Zones testing above these thresholds receive maintenance doses only; zones below receive corrective applications calibrated to soil buffer capacity. Micronutrient corrections, particularly for zinc in alkaline soils above pH 7.2 and iron in calcareous, high-bicarbonate conditions, are assigned zone by zone based on DTPA-extractable micronutrient soil tests.

2. Organic Amendments and Biofertilizers by Zone

Organic amendments — compost, farmyard manure, or municipal biosolids — are most effectively targeted to zones with the lowest organic matter content and weakest soil structure. The rationale is that the benefit-to-cost ratio of organic matter additions is highest in degraded, low-carbon soils, while already organic-matter-rich zones gain diminishing returns from the same investment.

A zone-specific compost targeting strategy, applying 15 to 20 t/ha to the lowest-OM zones and 5 to 8 t/ha to medium zones, typically restores field-level organic matter uniformity within two to three cropping seasons.

Biofertilizers — products containing phosphate-solubilizing bacteria (PSB) or nitrogen-fixing organisms such as Azospirillum — can be applied at variable rates to zones where soil biological activity is the limiting factor for nutrient availability, rather than the total nutrient content.

In zones with low microbial biomass carbon, biofertilizer application has been shown in multiple trials to improve P uptake efficiency by 20 to 30% without additional synthetic P input.

3. Fertigation and Water-Use Efficiency by Zone

Fertigation (the simultaneous delivery of fertilizers dissolved in irrigation water through drip or sprinkler systems) gives growers the highest spatial precision in nutrient delivery. When the irrigation system is designed with zone-specific valve control — a straightforward addition to modern drip systems — fertilizer concentrations in the irrigation water can be adjusted independently for each zone during each irrigation event.

This eliminates the over-watering that concentrates salts in low-infiltration zones and the under-watering that leaves nutrients immobile in high-permeability zones.

Al-Harbi et al. (Agricultural Water Management, 2024) reported that green onion grown under zone-specific fertigation management achieved a 22% improvement in water-use efficiency and a 19% increase in bulb yield uniformity compared to uniform-rate drip fertigation across a field with two distinct SSMZ classes.

Zone-specific fertigation creates a compounding advantage — it simultaneously conserves water, reduces fertilizer costs, and improves produce grading, all from the same infrastructure investment.

Impact on Nutrient Status of Green Onion Across Zones

The most immediate measurable benefit of SSMZ-based management is an improvement in the nutritional status of the crop itself. Leaf nutrient concentration — measured by tissue analysis at the critical growth stage and expressed as percentage dry weight for N, P, and K and parts per million for micronutrients — becomes more uniform across the field when zones receive tailored inputs rather than a blanket rate.

Precision nutrient management does not add more fertilizer to the best zones — it removes the waste from the worst-managed ones, and that difference is where both profit and environmental protection are found.

Nutrient uptake efficiency (NUpE, defined as the total nutrient absorbed by the crop divided by the total nutrient applied) increases under zone-based management for a simple mechanistic reason: fewer nutrients are applied to zones that already have adequate supply, reducing the denominator of the efficiency ratio while maintaining or improving uptake.

Studies reviewed in Frontiers in Plant Science (2024) found that NUpE for nitrogen in Allium species increased from an average of 42% under uniform management to 61 to 67% under SSMZ-based variable rate management — a gain that directly reduces the nitrate load available for leaching into groundwater.

Effects on Green Onion Growth Parameters

Zone-specific nutrient management produces measurable improvements in plant height, leaf area index, and biomass accumulation. The mechanism is straightforward: when each zone receives the nitrogen dose matched to its supply-demand gap, nitrogen is neither diluted by luxury application nor limiting in deficient zones, and the crop allocates carbon to above-ground growth rather than to compensatory root exploration for scarce nutrients.

In field trials conducted in Egypt’s Nile Delta region (published in the Journal of Horticultural Science and Biotechnology, 2023), green onion plots managed under a three-zone SSMZ regime showed statistically significant improvements in growth metrics.

  • Plant height in the high-potential zone increased by 14.3% over the field-average height recorded under uniform management, attributed to optimized nitrogen delivery during the rapid vegetative growth phase.
  • Leaf area index at 45 days after transplanting was 18% higher in the medium-potential zone under zone-specific management compared to the same zone under uniform management, because the corrected phosphorus application improved root development and water uptake capacity.
  • Total above-ground fresh biomass at harvest was 12.7% greater in the SSMZ-managed field compared to the conventionally managed control, primarily driven by improvements in the previously under-fertilized low-potential zone.

Root development improvements are harder to measure destructively at scale, but rhizotron studies show that zone-appropriate potassium nutrition increases root hair density and elongation, improving the physical contact surface between roots and soil particles where mass-flow nutrient delivery is most critical.

Effects on Yield and Quality of Green Onion

Yield improvements from SSMZ management in green onion accrue from two distinct pathways. First, zones that were previously over-fertilized — typically the high-organic-matter, naturally fertile patches — are protected from salinity stress and luxury nutrient toxicity, which can reduce yields even in inherently productive soils.

Second, zones that were previously under-fertilized receive corrective rates that lift their performance toward their genetic yield potential, raising the field average without requiring additional total fertilizer expenditure. The key quality parameters that improve under zone-based management tell a commercially important story:

1. Bulb diameter and uniformity improve because zone-specific potassium supply ensures consistent carbohydrate partitioning to the bulb across the entire field, rather than only in the areas that happened to have adequate native K availability.

2. Chlorophyll content at harvest — measured by SPAD or destructive extraction and expressed as mg chlorophyll per gram fresh weight — is higher and more uniform in SSMZ-managed crops, producing the deep green leaf color that commands premium prices in fresh markets and export chains.

3. Total soluble solids (TSS), a direct indicator of sugar accumulation and flavor intensity, increase by 8 to 12% under zone-optimized potassium and sulfur management, according to data published in the Journal of the Science of Food and Agriculture (2024).

4. Pungency score — quantified as pyruvic acid concentration (mmol/100g fresh weight), the accepted biochemical marker of onion pungency intensity — responds directly to adequate sulfur nutrition. Zone-specific sulfur application in sulfur-deficient zones has been shown to increase pyruvic acid content by 15 to 22%, improving both flavor profile and the shelf-stable sulfur compounds that extend post-harvest life.

EcoEnvironmental Implications of Zone-Based Management

The economic case for SSMZ adoption in green onion production is anchored in the cost-benefit structure of precision input management. The upfront investment includes soil sampling (typically USD 12 to 25 per hectare for grid sampling), laboratory analysis, GIS mapping software (with open-source QGIS available at no cost), and variable rate application equipment.

For a 10-hectare commercial green onion enterprise, total setup costs range from USD 800 to 2,500 depending on sampling density and equipment choices. Against this investment, growers can expect measurable financial returns. Fertilizer savings from eliminating over-application in high-fertility zones typically range from 15 to 25% of total fertilizer expenditure.

Premium-grade yield improvements — the proportion of harvest meeting export or supermarket grade specifications — increase by 10 to 20%, which commands price premiums of 20 to 35% per kilogram in premium vegetable markets. Combined, these benefits produce a return on SSMZ investment of 2.5 to 4.5 times the setup cost within a single growing season for commercial-scale producers.

The environmental implications are equally significant. Nitrate leaching into groundwater, the principal environmental externality of intensive vegetable production, is reduced by 40 to 60% under zone-specific nitrogen management compared to uniform blanket applications, according to a meta-analysis published in the European Journal of Agronomy (2024).

Phosphorus runoff, which drives eutrophication of surface water bodies, decreases proportionally as over-applied P in high-fertility zones is eliminated. The reduction in total synthetic fertilizer use also lowers the carbon footprint of the production system, since synthetic nitrogen manufacture accounts for approximately 1.5 kg CO2-equivalent per kg of urea produced.

Challenges and Limitations That Growers Should Anticipate

SSMZ delineation is not without practical barriers, and honest recognition of these limitations is essential for realistic adoption planning.

i. Data collection costs represent the primary barrier for smallholder producers. Grid soil sampling at sufficient density for reliable kriging interpolation requires 15 to 30 samples per hectare in highly variable fields, and laboratory analysis for a full nutrient profile can cost USD 30 to 80 per sample. For a 1-hectare smallholder plot, this single cost item may exceed the entire input budget.

ii. Technical expertise in geostatistics, GIS software operation, and variable rate equipment calibration is not widely available in most vegetable-producing regions. Extension services rarely cover spatial data analysis, and private agronomic consultants with SSMZ competency charge premium fees that are accessible only to larger operations.

iii. Smallholder applicability is structurally limited by plot size. Kriging interpolation requires a minimum of 10 to 15 sample points per variable to generate reliable maps, setting a practical lower limit of approximately 2 to 3 hectares for cost-effective SSMZ work with conventional soil sampling. Below this threshold, directed composite sampling by visible field zones is a more pragmatic alternative.

iv. Temporal variability of soil properties — particularly nitrate nitrogen, which can change by 50% or more within a single month depending on rainfall and temperature — means that zone maps derived from pre-season sampling may not accurately reflect conditions at the time of in-season top-dressing decisions. Crop sensor technologies (NDVI drone flights, real-time SPAD readings) are necessary to update nutrient prescriptions within the season.

Future Perspectives: Where SSMZ Science Is Heading

The next generation of SSMZ science for vegetable crops is converging on three technological frontiers that will substantially reduce the cost and increase the accuracy of zone delineation.

Drone-based multispectral and hyperspectral imaging is replacing time-intensive manual soil sampling as the primary data source for rapid SSMZ delineation. A single drone flight at 30 to 50 meters altitude can capture canopy reflectance data at 5 to 10 cm spatial resolution across an entire farm in under an hour.

When calibrated with targeted soil samples at representative points, drone imagery can generate NDVI, red-edge chlorophyll index, and canopy temperature maps that identify zone boundaries with accuracy comparable to dense grid sampling at a fraction of the cost.

Machine learning algorithms — particularly random forest classifiers and neural networks trained on multi-year datasets of soil properties, yield history, and satellite imagery — are transforming zone delineation from a single-season snapshot into a dynamic, predictive system.

Models trained on five or more years of field data can predict zone boundaries for the upcoming season before any new soil sampling is conducted, allowing prescription maps to be prepared weeks before planting and reducing the season-start time pressure on growers.

Climate-smart nutrient management represents the conceptual frontier of SSMZ work. As seasonal temperature and precipitation patterns become less predictable, the ability to adjust zone-specific fertilizer prescriptions in response to real-time weather forecasts — reducing N applications in zones facing waterlogging risk before a heavy rainfall event, or increasing K in heat-stressed zones during a dry spell — will become a core function of farm management systems.

Integration with cloud-based decision support platforms that combine weather data, crop models, soil sensor readings, and market price signals is already underway in early-adopter farming enterprises in the Netherlands, Israel, and Australia.

Conclusion

The delineation of site-specific management zones for green onion (Allium cepa L.) is no longer a research curiosity — it is a commercially validated strategy for improving nutrient status, growth uniformity, and produce quality while simultaneously reducing input costs and environmental impact. The evidence base reviewed demonstrates that SSMZs, when properly delineated using combined soil chemistry, geostatistical analysis, crop-based sensors, and GIS integration, consistently outperform uniform management across the metrics that matter most to commercial producers: nitrogen use efficiency, marketable yield, bulb grade uniformity, and post-harvest shelf life. For agronomists and crop consultants advising on green onion enterprises, the practical recommendations are clear. Begin with grid soil sampling at 1 sample per hectare minimum, prioritizing pH, organic matter, EC, and available NPK as the primary zone-defining variables.

Visualizing Economic Impacts of Sustainable Farming Using GeoPard in Precision Agriculture

Researchers from Bayerische Landesanstalt für Landwirtschaft (LfL) and GeoPard Agriculture teamed up to look into the economics of strip-intercropping systems for sustainable farming. They shared their findings at the University of Hohenheim’s event on “Promote Biodiversity through Digital Agriculture,” focusing on eco-friendly farming practices and their financial impacts.

Their project, “Future Crop Farming,” aimed to explore new ways of farming, with a special focus on strip-intercropping. This technique involves growing different crops side by side in strips within the same field, which could reduce the need for chemicals and increase biodiversity. The researchers wanted to find ways to make farming more eco-friendly while still being profitable for farmers.

Led by Olivia Spykman and Markus Gandorfer from LfL, along with Victoria Sorokina from GeoPard, this collaboration started during the EIT Food Accelerator program. Using their knowledge in farming, digital tools, and data analysis, they set out to study the economic side of sustainable farming practices.

While addressing the reduction of synthetic inputs and the increase of biodiversity they found that the ecological potential of strip-intercropping is well-researched. However, its mechanization and labor economics, especially with autonomous equipment, require further evaluation.

They found that farmers were unsure about its practicality, especially with new technology. To address this, they talked with farmers at a strip-intercropping field lab to understand their concerns and communicate better.

Furthermore, changes to the landscape can make farmers hesitant, so providing clear information upfront is important. Therefore, digital tools, like visualizations, can facilitate communication between farmers and their communities, generating acceptance and appreciation for ecologically beneficial landscape transformations.

For example, in New Zealand, farmers used virtual reality (VR) goggles to visualize suitable areas for afforestation, aiding farm-scale planning by illustrating impacts on farm profitability, landscape aesthetics, and rural communities. Such visualizations can enhance farmers’ understanding and interest in landscape changes, though successful implementation also depends on farmers’ self-confidence.

Similarly, in this research, the cloud-based program GeoPard was used to analyze a strip intercropping production system from multiple perspectives. GeoPard’s equations were parametrized with empirical data from the Future Crop Farming project. Initial results include visualizations of herbicide and nitrogen input and yield output, with more complex calculations planned.

Herbicide application map displaying

Furthermore, the system integrated various data sources, including:

  • Yield and applied-input datasets
  • Price information for crops and plant protection (provided by the user)
  • Satellite imagery (Sentinel-2, Landsat, Planet)
  • Topography data
  • Zone maps of historical data available in GeoPard

Meanwhile, the main techniques utilized involved spatial analysis and efficient handling of spatial data using the NumPy framework. Data was sourced from .xlsx and .shp files. However, the shape file lacked specific details about individual strips, necessitating the integration of various data formats.

GeoPard facilitated organizing data spatially to link strip-specific details with their respective locations in the field. Hence, the integrated dataset, displaying the strips, formed the basis for the descriptive trial analysis in GeoPard.

Although the research didn’t examine variable-rate application of inputs, GeoPard’s high-resolution mapping (pixel size: 3×3 meters) enabled detailed visualization at the pixel level, adding complexity. This detailed mapping is valuable for future applications, like combining multiple layers or integrating more spatially variable information such as ‘yield profiles’ based on small-scale yield data collected by plot combines in the research project.

Yield-per-crop map in full view and zoomed-in to show pixel-level details

Researchers have also discovered that although GeoPard has primarily served descriptive functions, it possesses the potential for more complex visualizations. For example, incorporating sub strip-level yield data and price information could help create profit maps, showing edge effects between neighboring crop strips.

Furthermore, integrating labor economic data could reveal the impacts of reducing economies of scale to promote biodiversity. Such data can aid scenario modeling, allowing exploration of various crop rotations, strip widths, and mechanization types, focusing on field-specific outcomes to improve agricultural management and decision-making.

Hence, the setup could function as a digital twin, with real-time data transfer from field machines and sensors to GeoPard, a capability already achievable with some commercial technologies and satellite data. However, farmers’ concerns about technology compatibility emphasize the need to integrate additional data sources for broader applicability.

Management Zone Maps and Corn Growers: How Much Do They Matter?

During multiyear analysis, researchers have tested if management zone maps based on soil conditions, topography, or other landscape features can reliably predict which parts of a cornfield will benefit most from increased seeding rates or nitrogen application.

The study revealed that, contrary to common assumptions, crop-plot responses to the same inputs vary significantly from year to year. The most unpredictable factor, the weather, seemed to have the biggest impact on how the crops responded to these inputs. However, farmers can still take steps to manage the impacts of weather on their crops.

Management zone mapping came about due to a rise in interest in digital agriculture – the use of new data-gathering and analysis technologies to better understand the interplay of factors affecting crop yields, explained University of Illinois Urbana-Champaign crop sciences professor Nicolas Martin, who conducted the analysis with former postdoctoral researcher Carlos Agustin Alesso.

These methods involve using field-based sensors, satellite data, and other digital tools to track how crops respond to local conditions, fertilizer, seed rates, and other inputs. The aim is to minimize wasteful or destructive practices while maximizing yield, Martin added.

The recent study employed a unique method to validate the predictions of management zone maps.

“We utilized our farm machinery as a printer, generating a patchwork of inputs akin to a quilt with various colors,” explained Martin. “We implemented our experiment across multiple sites, employing a completely randomized design.”

The researchers carried out their study on seven typical non-irrigated corn production sites in Illinois. Each site was divided into numerous plots. Different rates of corn seeding and nitrogen application were randomly assigned to each plot.

Additionally, the researchers measured the soil composition, topography, and other landscape features specific to each site. They standardized all variables except for weather conditions across the fields. This study was conducted from 2016 to 2021.

The researchers gauged the yield of each plot at harvest time over several years. This helped them identify which plots responded best to various inputs each year. They employed an advanced random-forest algorithm to ascertain which factors – like weather conditions, soil characteristics, or slope – most accurately predicted whether increasing nitrogen application or using a higher seeding rate would boost yields.

Martin explained that weather variables are the primary factors influencing the spatial patterns of response to nitrogen or seed rates, with landscape and soil attributes following closely. Additionally, he noted that these responses vary annually due to weather effects, resulting in inconsistency, at least in the fields we examined.

“This means that a plot which responds well to a higher nitrogen rate one year might not respond as well the next time it is planted with corn,” he said. “This makes the management zone mapping concept an unreliable predictor of crop responses to inputs.”

“We believe that these findings can partially explain why precision agriculture technologies have not been uniformly adopted by farmers,” Martin said.

The researchers believe that gathering more data over multiple years and using better tools for on-site analysis could enhance the accuracy of management zone mapping.

This research was supported by the U.S. Department of Agriculture’s Natural Resources Conservation Service and National Institute of Food and Agriculture.

Management Zones In Precision Agriculture To Optimize Yields

Precision agriculture is a way of farming that uses technology to optimize the use of inputs. By applying inputs at the right amount, time and place, it can improve crop yield, quality, profitability and sustainability. And one of the key concepts in precision agriculture is management zones.

What are management zones and why are they used?

A management zone is a sub-region of a field that has similar characteristics and responds similarly to inputs. They can be based on factors such as soil type, texture, organic matter, electrical conductivity, elevation, slope, crop health, yield history and more.

Management zones are used to divide a field into smaller units that can be managed differently according to their needs and potential. For example, a field may have areas with different soil textures, such as clay, loam and sand.

These areas may have different water holding capacity, nutrient availability and drainage. Applying the same amount of water or fertilizer to the whole field may result in over-irrigation or under-fertilization in some areas, and vice versa in others.

This can lead to wasted resources, reduced crop performance and environmental problems. By creating MZ’s based on soil texture, the farmer can adjust the irrigation and fertilization rates for each zone to match the soil conditions and crop requirements. This can increase water use efficiency, nutrient use efficiency and crop yield.

Delineation of management zones in precision agriculture

Delineation of management zones in PA is a process of making different zones in a field based on what’s similar in that area. These zones help farmers decide how to use things like water, fertilizers, and pesticides more effectively.

What are management zones and why are they used

To do this, farmers collect data about the soil, the land’s shape, or how well crops grow in different spots. Then, they use computer programs to group together areas that are alike. For example, places with similar soil or places where crops always grow well become their own zones.

Once they have these zones, farmers can be smarter about how they use resources. They might give more water to zones that need it or use fewer chemicals in places that don’t need as much. This helps save money, protect the environment, and grow better crops.

There are different methods and tools for delineating MZs in PA, but one of the most common and recommended ones is cluster analysis. Cluster analysis is a data mining technique that groups data points into clusters based on their similarity or dissimilarity.

Cluster analysis can be applied to spatial data, such as soil samples, yield maps or satellite images, to identify homogeneous areas within a field. It involves the following key steps:

  • Data Collection: Collect data about the field, like soil info, yield records, and more.
  • Data Analysis: Use technology (like GIS) to study the data, finding patterns and differences in the field.
  • Clustering: Group similar areas together based on the data. For example, areas with similar soil types become zones.
  • Boundary Definition: Set clear boundaries between these zones to avoid mixing resources.
  • Zone Characterization: Each zone gets described by its unique traits, such as soil type or nutrient levels.
  • Data Integration: Combine data from different sources, like soil surveys and satellite images, to make the zones even more accurate.

How management zones are created?

There are different methods for creating management zones in precision agriculture. Some of the common methods are:

  • Using existing soil maps or surveys that provide information on soil properties and boundaries.
  • Using soil sensors or probes that measure soil parameters such as electrical conductivity, moisture, pH and more.
  • Using remote sensing or aerial imagery that capture crop health indicators such as vegetation indices, biomass, chlorophyll content and more.
  • Using yield monitors or maps that record crop yield and quality data over multiple years.
  • Using data analysis or modeling tools that integrate multiple data sources and apply statistical or spatial techniques to identify patterns and clusters.

1. Soil maps or surveys

In precision agriculture, MZ’s are crafted by harnessing existing soil maps or surveys, which provide essential data on soil properties and boundaries.

methods for creating management zones in precision agriculture.

Two primary soil sampling methods are employed: grid sampling, breaking the field into squares for soil samples, and zone sampling, grouping areas with similar soil properties. Grid sampling offers detailed insights into field variability but comes with higher costs due to increased samples.

Zone sampling’s effectiveness depends on method and size. By integrating this data with sampling approaches, precision farming optimizes resource allocation to specific soil conditions within zones, promoting sustainability and crop productivity.

2. Soil electrical conductivity

In precision agriculture, soil sensors and probes measure essential soil parameters such as electrical conductivity (EC), moisture, and pH. Soil EC, expressed in mS/m, gauges a soil’s electrical conductivity ability.

By sending controlled currents into the soil and geotagging the measurements with GPS coordinates, these tools help quantify soil texture variations and yield potential. They inform decisions on nutrient management, seeding rates, depths, and irrigation schedules.

Soil EC data also offers rapid, cost-effective insights into soil properties like texture, cation exchange capacity (CEC), drainage, organic matter, and salinity, enabling the creation of precise MZ’s for optimized farming practices.

3. Remote sensing or aerial imagery

Creating management zones in precision farming involves the utilization of remote sensing or aerial imagery to capture crucial crop health indicators such as vegetation indices, biomass, chlorophyll content, and more.

How MZ's are used The Benefits

This is achieved through the use of airplanes or drones equipped with imaging technology capable of generating high-resolution images. By employing sophisticated image analysis techniques, these images are processed to delineate zones within the field.

4. Yield monitors

In precision agriculture, zones are established through the use of yield monitors and maps that collect vital crop yield and quality data over several years.

This process, known as yield mapping, involves real-time monitoring on harvesters, capturing information on crop mass, moisture levels, and the area covered.

Subsequently, this data is harnessed to create comprehensive yield maps, driving more precise and efficient farming practices.

5. Data analysis or modeling tools

In precision farming, we create MZ’s carefully using advanced tools that analyze data. These tools bring together lots of different information and help us see patterns in the farm. They use math and maps to find out where we should focus our attention. This helps farmers make smart choices about where to use resources like water and fertilizer. It makes farming better and helps crops grow well.

However, the choice of method depends on the availability of data, the type of input to be varied, the size of the field, the cost of the technology and the farmer’s preference. The goal is to create zones that are meaningful, consistent and practical.

How MZ’s are used? The Benefits

Once zones are created, they can be used to guide variable rate applications (VRA) of inputs such as seeds, fertilizers, water and pesticides. VRA is a technique that allows changing the rate of input application within a field based on the management zone information.

To implement VRA, the farmer needs:

  • A variable rate controller that can adjust the application rate according to a prescription map or a sensor feedback.
  • A global positioning system (GPS) that can locate the position of the applicator within the field.
  • A geographic information system (GIS) that can store, display and analyze spatial data such as MZ’s and prescription maps.

Using VRA based on MZ’s can help the farmer to:

  • Apply inputs where they are most effective and avoid over-application or under-application.
  • Improve productivity of fertility-limited or water-limited soils.

Optimize management zones with GeoPard 

Furthermore, by customizing input application rates, farmers can reduce input costs on soils that are unresponsive or have low productivity potential. This cost-effective approach ensures that resources are invested wisely.

It is also worth noting that precision agriculture, with MZ’s and variable rate applications (VRA), benefits the environment by minimizing nutrient leaching, reducing runoff of chemicals into water bodies, and preventing soil erosion.

Optimize management zones with GeoPard

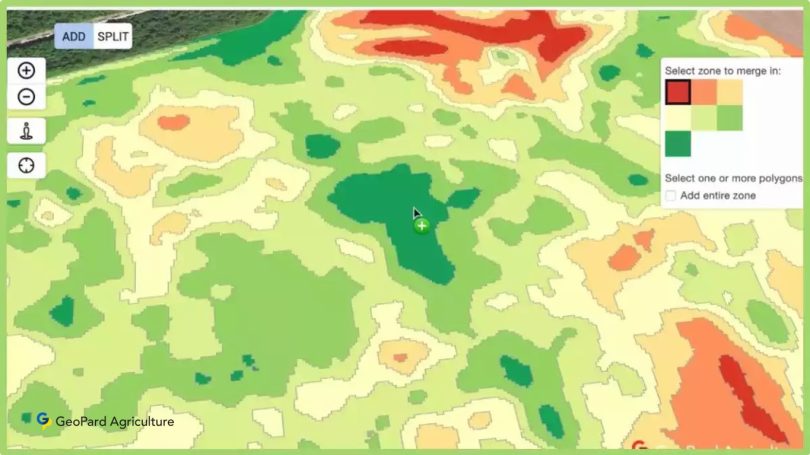
GeoPard Agriculture simplifies precision farming with its Management Zones & VRA Maps feature, allowing users to create customized zones and prescription maps based on various data layers like satellite imagery, soil analysis, and more.

These maps are compatible with agricultural equipment and machinery. Users can also conduct multi-layer analytics, identify areas with higher or lower yield potential, and detect field stability trends. The platform offers cross-layer maps to uncover dependencies between different zone maps and facilitates easy zone adjustments.

Additionally, GeoPard supports Variable Rate Application (VRA) mapping for precise agricultural operations and provides statistics on zone-level accuracy. It offers data compatibility for export and allows manual zone customization and equation-based prescriptions for cost calculation.

Conclusion

Precision agriculture is a transformative approach to farming that harnesses technology and data-driven insights to enhance crop production. Whether by utilizing data from soil sensors, remote sensing, yield monitors, or data analysis tools, it empowers farmers to create management zones tailored to their fields. These zones optimize resource allocation, leading to improved crop yields, reduced costs, and sustainable agricultural practices.

LfL Leverages GeoPard Platform for Its Future Crop Farming Project

Agriculture today faces major challenges. It has to produce high-quality food and raw materials, but increasingly it also has to take into account requirements for the protection of soil, water, climate, and biodiversity.

The Bavarian State Research Center for Agriculture (LfL) has long been conducting research on these challenges and is now testing the GeoPard precision agriculture platform for its Future Crop Farming project.

Dmitry Dementiev, CEO and Co-Founder of GeoPard: “Traditional crop farming methods often face challenges such as inefficient resource management and limited access to real-time data. These factors can lead to suboptimal crop yields, increased costs, and environmental strain.”

GeoPard’s platform provides LfL with a centralized platform to visualize and analyze critical farming data. The platform’s user-friendly interface permits the combination of satellite data and experimental data from the field trial, simplifying complex data interpretation and empowering users to make informed choices that optimize productivity and sustainability.

The field was divided into sections to showcase a specific setup for the trial: LfL has implemented a strip intercropping system, i.e., the simultaneous cultivation of multiple crops in parallel strips in the same field.

These strips can subsequently be employed separately in equations for inputs (such as fertilizer and plant protection) and yield results, enabling the computation of overall field

profit. Moreover, the profits generated by individual crops and the possible impacts at the edges between strips can be assessed.

The collaboration between LfL and GeoPard through the Future Crop Farming project can move forward analysis tools for unconventional field structures.

By leveraging GeoPard’s advanced platform, it can complement its research results and create valuable visualizations for communicating insights from the project to the public.

With a focus on precision farming, productivity, and environmental stewardship, the innovative LfL project showcases the potential for a more sustainable future in crop farming.

PD Dr. Markus Gandorfer, Head of Digitalization and Project Lead at LfL: “It is a pleasure for us to work with the enthusiastic GeoPard team. Deeper insights into our strip-intercropping data enabled by the GeoPard tool are very valuable to us.”

About

Bavarian State Research Center for Agriculture (LfL) The Bavarian State Research Center for Agriculture (LfL) is the knowledge and service center for agriculture in Bavaria. The applied research of the LfL takes up issues of agricultural practice and provides applicable solutions for agricultural enterprises in various ways.

The interdisciplinary Future Crop Farming project is located in Ruhstorf a.d. Rott in southeastern Bavaria. More information about the project can be found on the project website: http://www.future-crop-farming.de

GeoPard Agriculture is a leading provider of precision farming software. The company was founded in 2019 in Cologne, Germany, and is represented globally. The company offers a range of solutions that help farmers to optimize their operations and increase yields.

With a focus on sustainability and regenerative economics, GeoPard Agriculture aims to promote precision farming practices around the world.

The company’s partners include such well-known brands as John Deere, Corteva Agriscience, ICL, Pfeifer & Langen, IOWA Soybean Association, Kernel, MHP, SureGrowth, and many others.

GeoPard’s Crop Development Graphs for Precision Agriculture

Today’s agricultural industry requires not only hard work and understanding of the land, but also the smart application of technology. I am thrilled to share an insight into one of the tools making a significant difference in sustainable farming practices: GeoPard’s Crop Development Graphs.

Our Crop Development Graphs offer a comprehensive, user-friendly display of crop growth data since 1988. Automatically generated for any field, these graphs are designed to ensure precision and accuracy.

The data is calculated solely for the cloud and shadow-free area of the field. A simple hover reveals the average NDVI (Normalized Difference Vegetation Index) value, providing an instant snapshot of crop health.

But what sets our tool apart? The capability to switch views. GeoPard’s interface allows users to alternate between Yearly and Monthly views. This level of detail ensures you are equipped with the essential data to make well-informed decisions about crop management, harvest timing, and yield prediction.

In the hands of a farmer, this precise insight can guide field management strategies, helping to detect the optimal harvest time, monitor crops at scale, and overall, optimize productivity and sustainability.

This is an exciting step forward in precision farming, a path that leads not only to improved yields but also to more sustainable practices that consider our environmental footprint.

Stay tuned for more updates as we continue to develop and refine our tools to serve the agricultural community better. We’re on a journey to make precision farming more accessible and efficient, and we’re thrilled to have you join us. Together, let’s redefine the future of farming!

Planet Imagery (daily, 3m resolution) for Management Zones Creation

Access to Planet imagery became simpler, faster, and more affordable with GeoPard Agriculture. Since August 2022 GeoPard has released the capabilities to search and analyze only requested Planet images from the user’s preferred date range.

So a GeoPard user requests only preferred Planet images and can use them in GeoPard analytical toolbox.

Planet images extend Sentinel and Landsat coverages (provided by default) and can be mixed with other data layers (harvesting/spraying/seeding machinery datasets, topography profile) via existing Multi-Layer, Multi-Year, and Equation tools


Planet Imagery for Management Zones Creation


Planet is the largest earth observation satellite network delivering a near-daily global dataset and enables its high-resolution and high-frequency satellite imagery data.

Management Zones Based on Planet Scope (3.5m resolution) imagery.

Read more about GeoPard / Planet Partnership.

What is Planet Imagery And Its Use for Management Zones Creation?

It refers to the satellite imagery provided by Planet Labs, a private company that operates a fleet of small satellites called Doves. These satellites capture high-resolution images of Earth’s surface on a daily basis. The term “3m resolution” means that each pixel in the image represents a 3×3 meter area on the ground. This level of detail allows for detailed analysis and monitoring of various features and changes on the Earth’s surface.

When it comes to management zones creation, Planet Imagery with daily 3m resolution can be highly beneficial for various industries and applications, such as:

  • Agriculture: High-resolution imagery can help in creating management zones in agriculture, where different areas of a field may require different treatments, like irrigation, fertilization, or pest control. By analyzing the imagery, farmers can identify patterns related to crop health, soil moisture, and other factors, enabling them to make better decisions about resource allocation.
  • Environmental management: Satellite imagery can be used to identify and monitor environmentally sensitive areas, such as wetlands, forests, and wildlife habitats. This information can be used to create management zones that protect these areas and ensure sustainable land use practices.
  • Urban planning: High-resolution imagery can help urban planners identify areas of growth, land use patterns, and infrastructure development. This information can be used to create management zones that guide future development and ensure efficient use of resources.
  • Disaster management: Satellite imagery can help in identifying and monitoring disaster-prone areas, such as floodplains or wildfire hotspots. Management zones can be created to establish evacuation routes, allocate resources for disaster response, and inform land use policies that minimize the risk of future disasters.
  • Natural resource management: High-resolution imagery can help in monitoring and managing resources like water, minerals, and forests. By identifying areas of high resource value or scarcity, management zones can be created to ensure the sustainable use and conservation of these resources.

In summary, Planet Imagery with daily 3m resolution is a valuable tool for creating management zones in various fields, providing up-to-date and detailed information that can help decision-makers optimize resource allocation and ensure sustainable land use practices.


Frequently Asked Questions


1. What can the use of imagery help establish?

The use of imagery can help establish a more efficient and effective farming system. By utilizing technologies like drones or satellite imaging, imagery can provide valuable insights into crop health, soil conditions, and irrigation needs.

It aids in identifying areas of concern, such as pest infestations or nutrient deficiencies, allowing farmers to take targeted actions. Furthermore, imagery helps in monitoring crop growth and development, enabling precise decision-making and maximizing yields. 

Equation-based Analytics in Precision Agriculture

With the release of the Equation-based analytics module, the GeoPard team has taken a big step forward in empowering farmers, agronomists, and spatial data analysts with actionable insights for each square meter. The module includes a catalog of over 50 predefined GeoPard precision formulas that cover a wide range of agriculture-related analytics.

The precision formulas have been developed based on multi-year independent agronomic university and industry research and have been rigorously tested to ensure their accuracy and usefulness. They can be easily configured to be executed automatically for any field, providing users with powerful and reliable insights that can help them to optimize their crop yields and reduce input costs.

The Equation-based analytics module is a core feature of the GeoPard platform, providing users with a powerful tool to gain a deeper understanding of their operations and make data-driven decisions about their farming practices. With the ever-growing catalog of formulas and the ability to customize formulas for different field scenarios. The GeoPard can meet the specific needs of any farming operation.


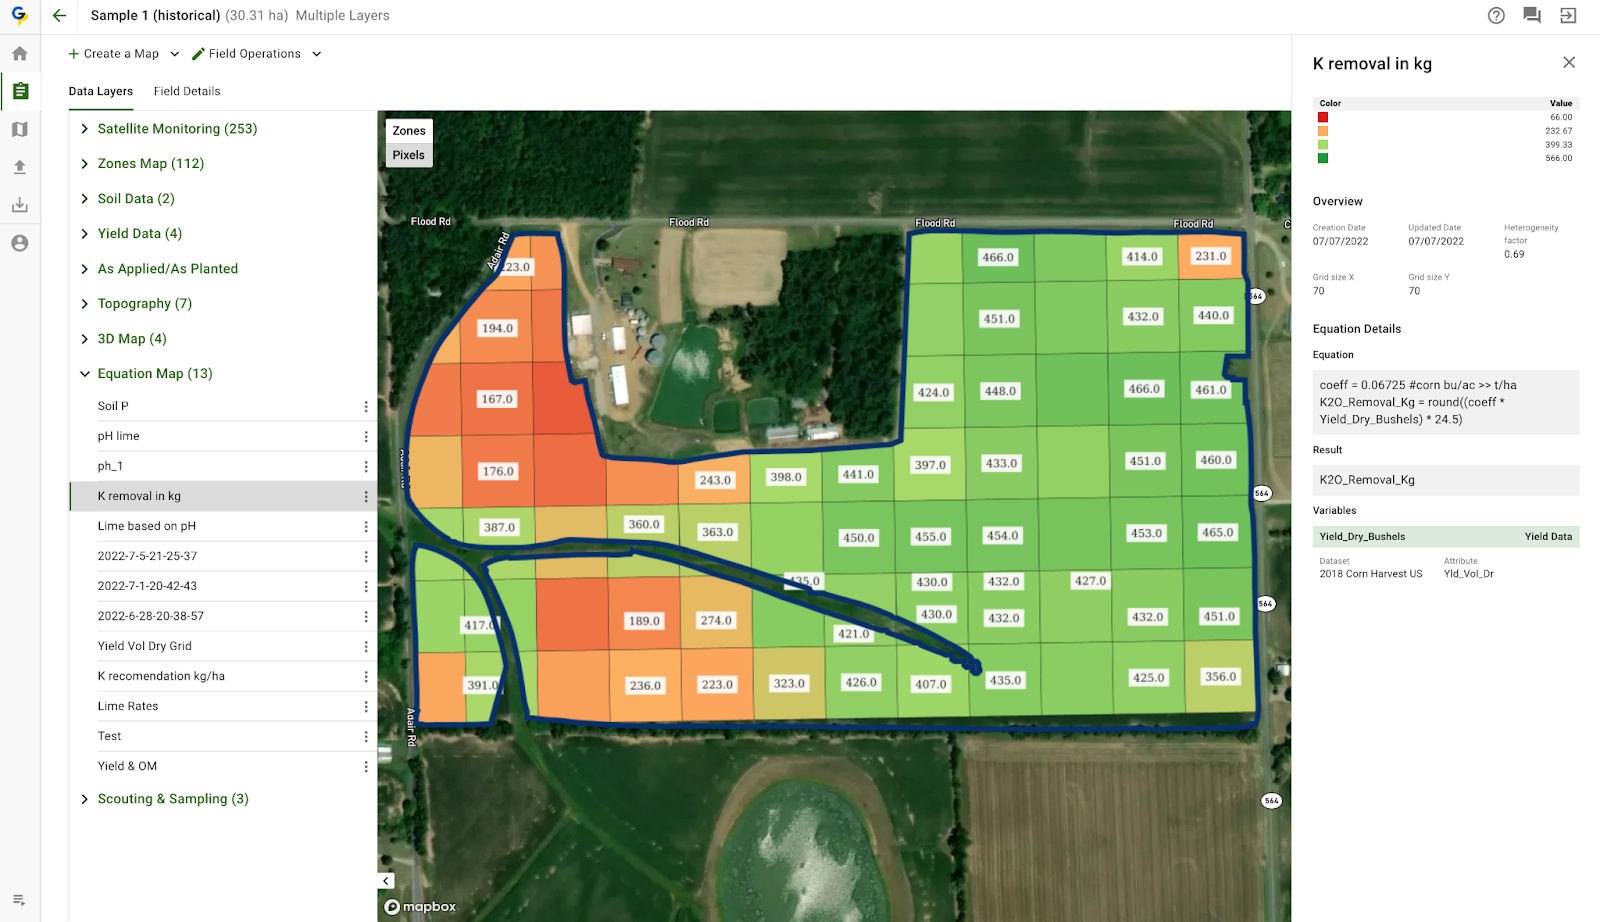
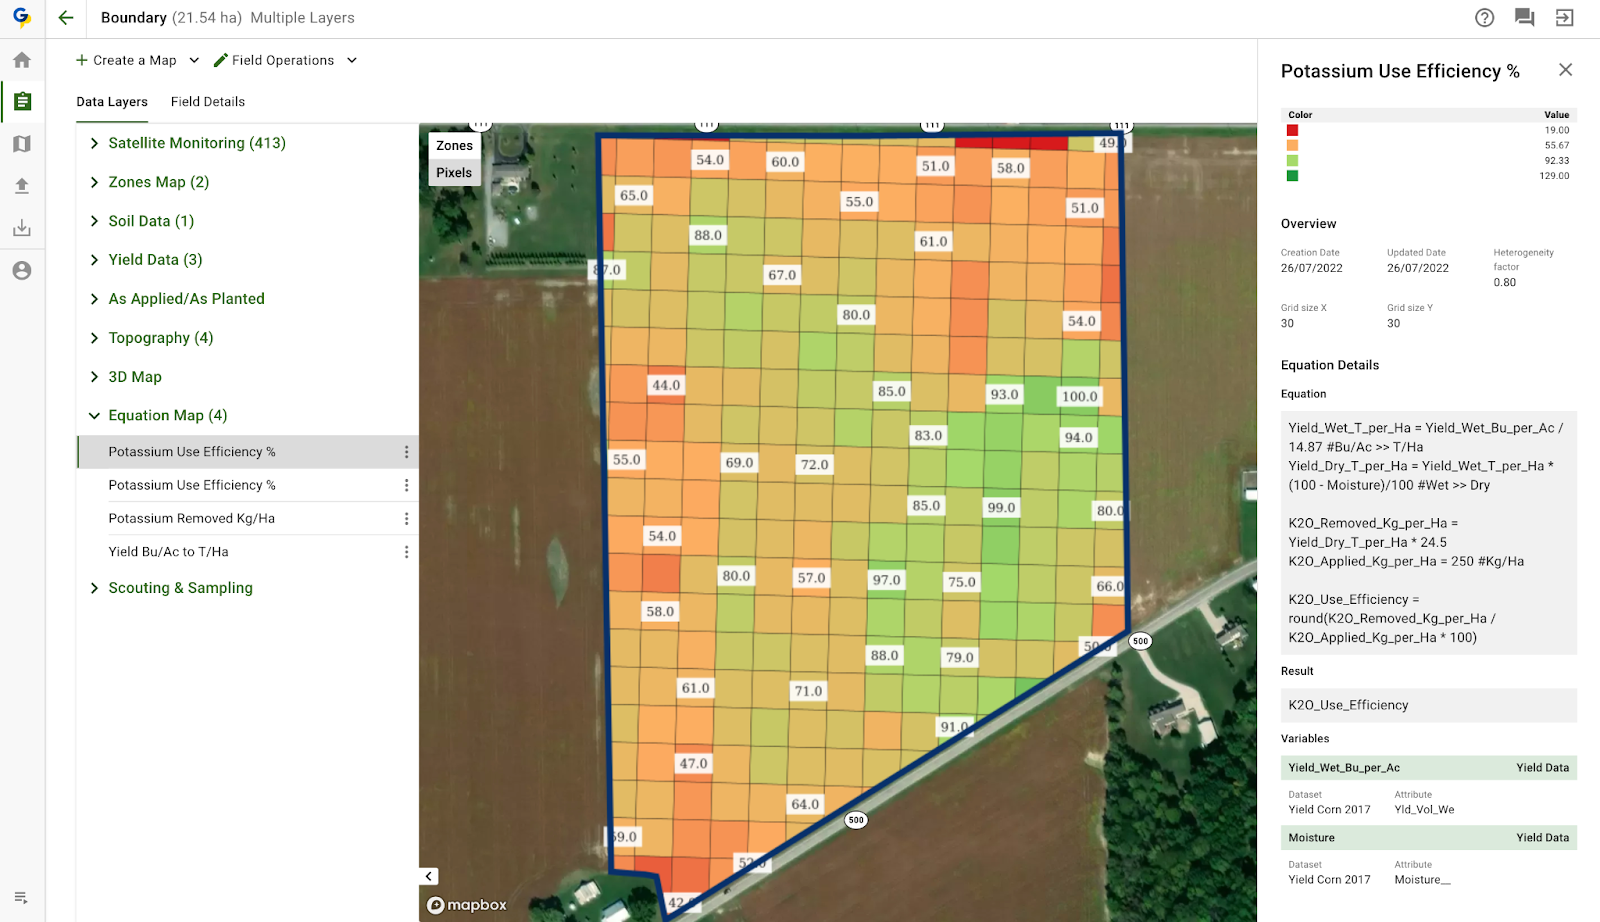
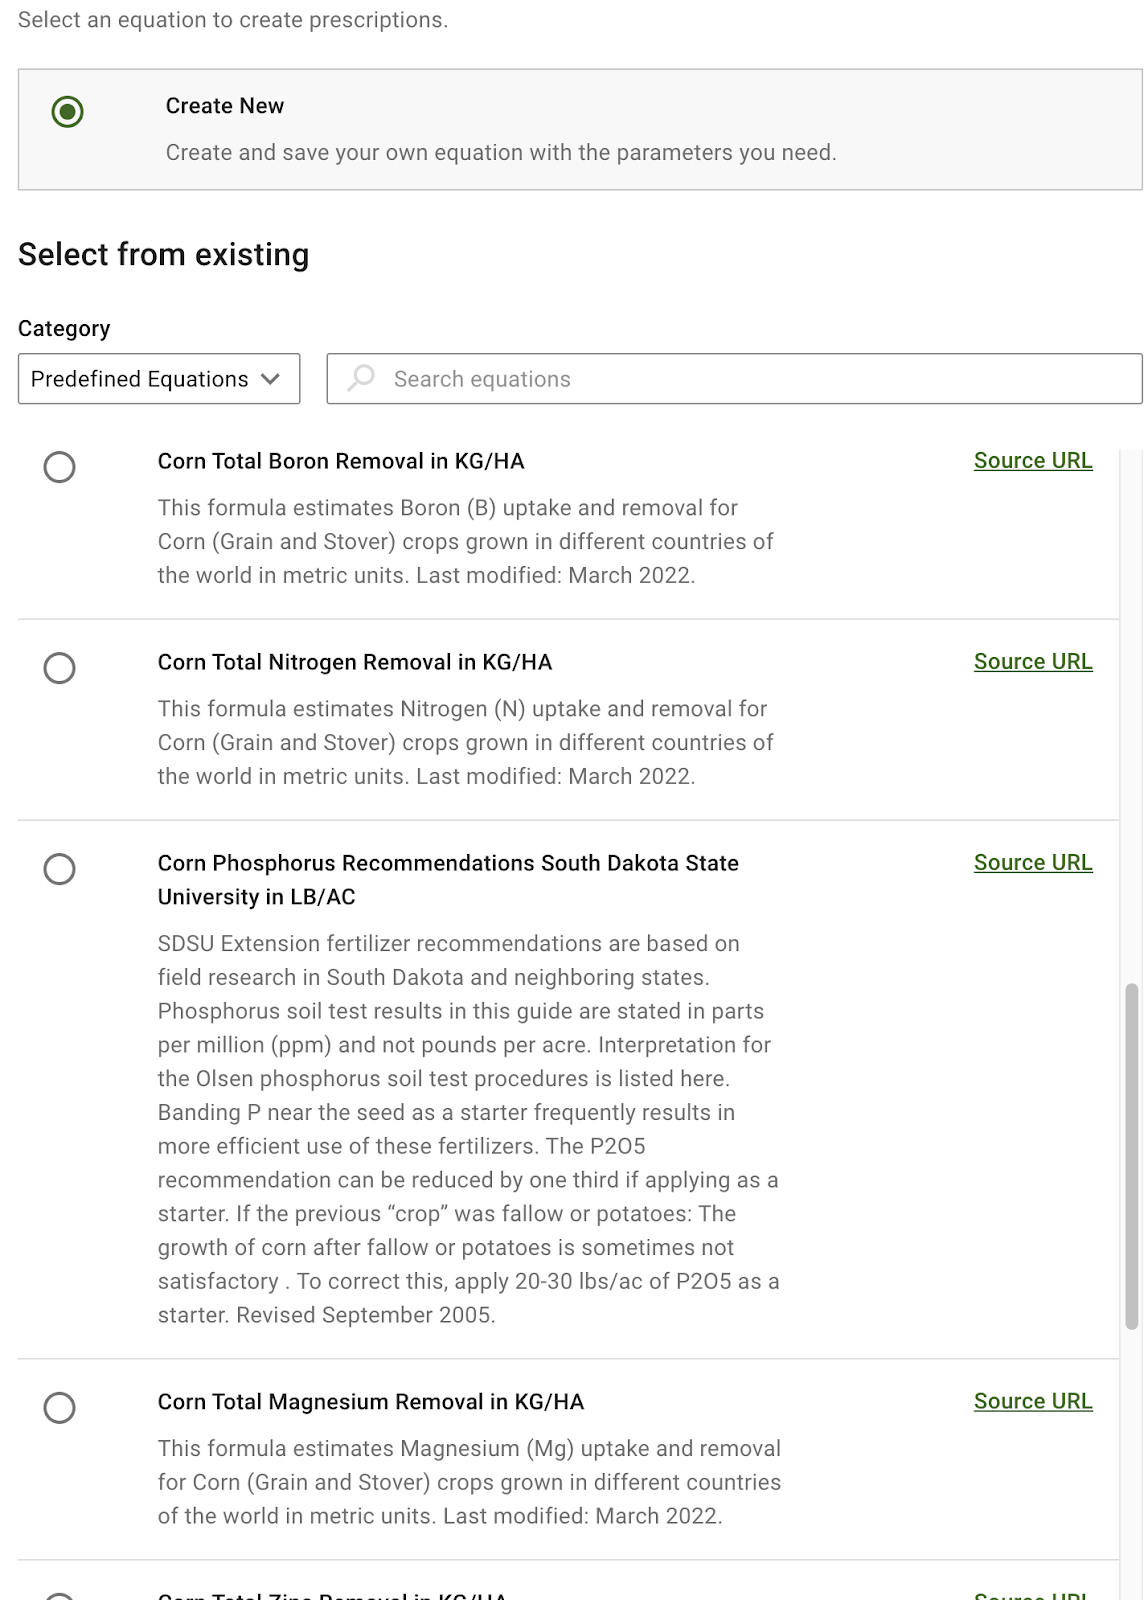
Potassium Removal based on Yield data

Potassium Removal based on Yield data


Use Cases (see examples below):

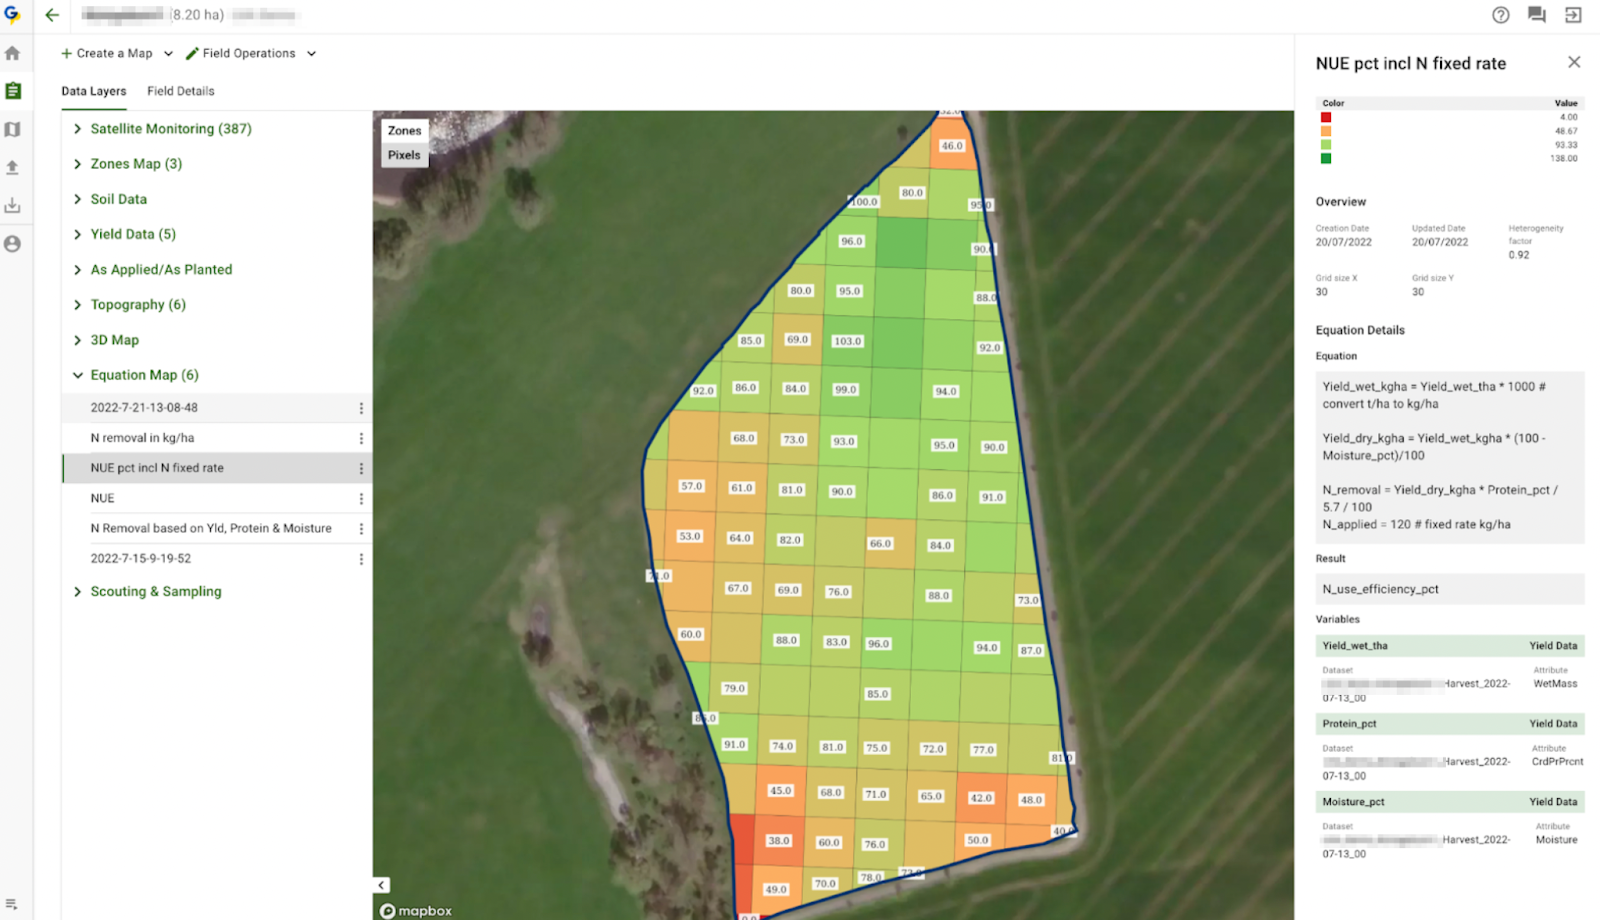
  • Nitrogen Uptake in absolute numbers using Yield and Protein data
  • Nitrogen Use Efficiency (NUE) and Excess calculations with Yield and Protein data layers
  • Lime recommendations based on pH data from soil sampling or soil scanners
  • Sub-field (zones or pixel-level ROI maps)
  • Micro and Macro nutrients fertilization recommendations based on Soil sampling, Field Potential, Topography, and Yield data
  • Carbon modeling
  • Change detection and alerting (calculate difference between Sentinel-2, Landsat8-9 or Planet imagery)
  • Soil and grain moisture modeling
  • Calculation of dry yield out of wet yield datasets
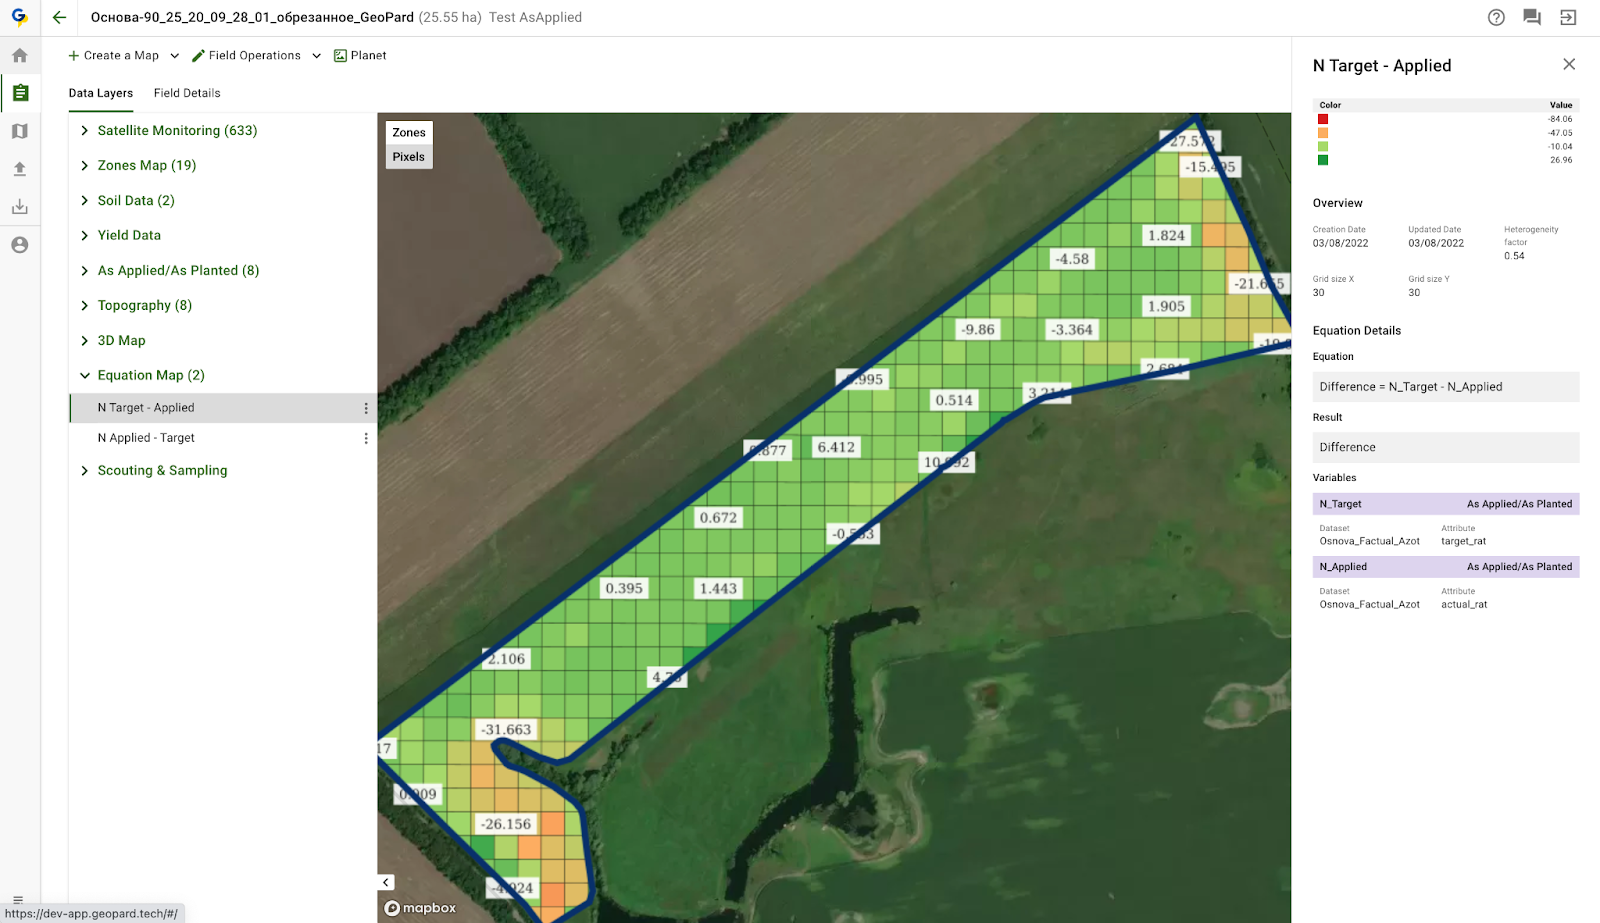
  • Target Rx vs As-applied maps difference calculation


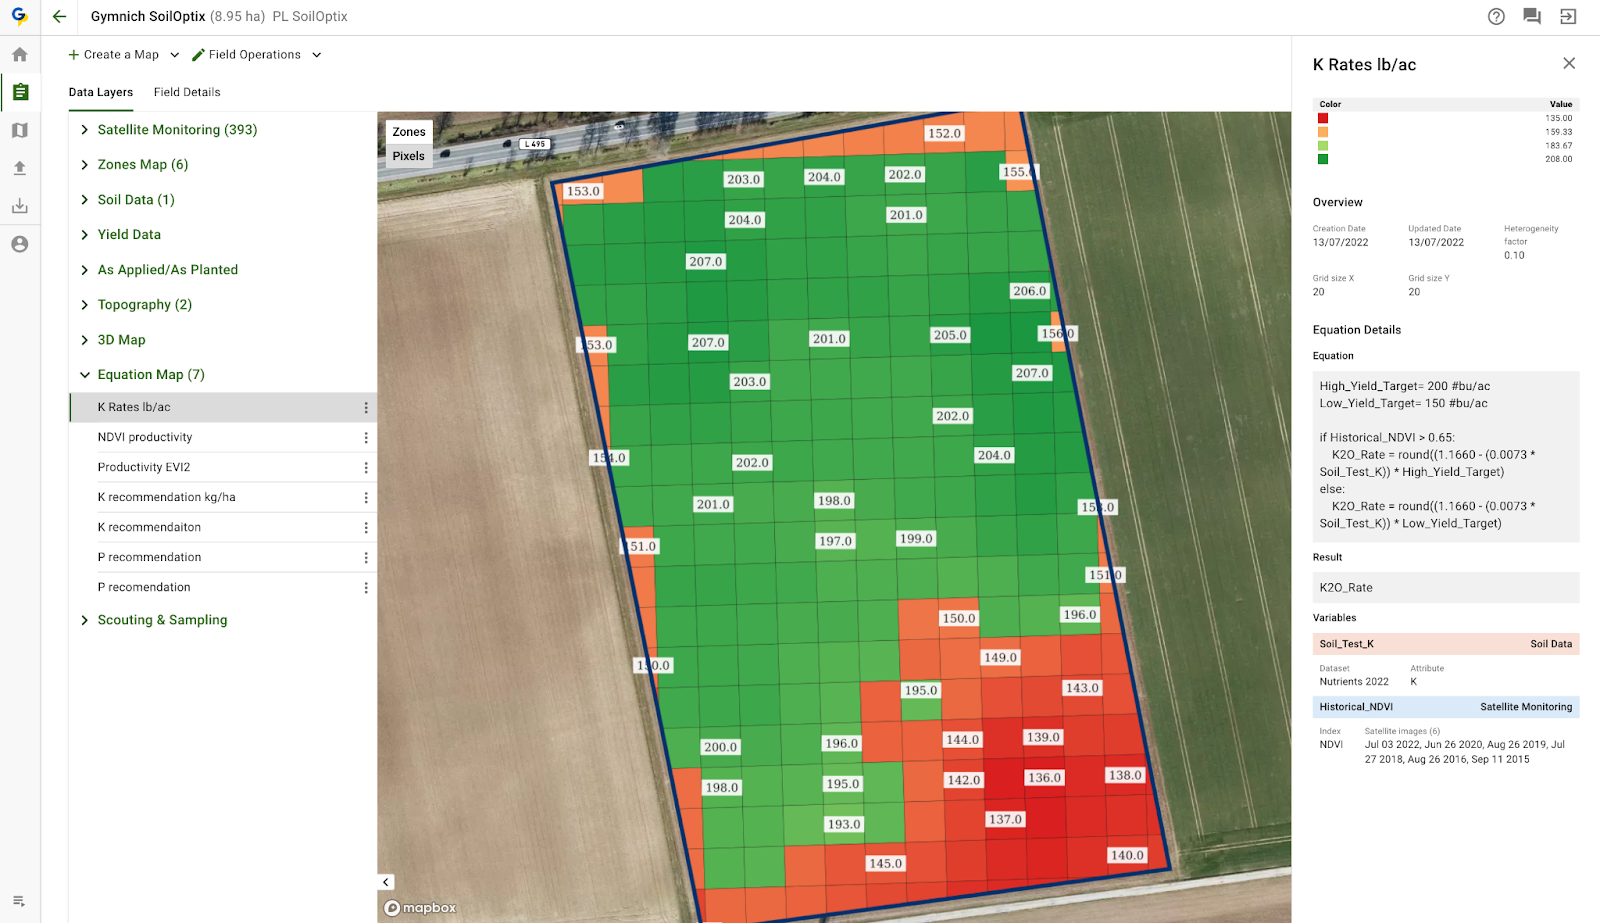
Potassium Recommendations based on Two Yield Targets (Productivity Zones)

Potassium Recommendations based on Two Yield Targets (Productivity Zones)


Fertilizer: Recommendations Guide. Potassium / Corn.

Fertilizer: Recommendations Guide (South Dakota State University): Potassium / Corn. Review and Revision: Jason Clark | Assistant Professor & SDSU Extension Soil Fertility Specialist


Potassium Use Efficiency in Kg/Ha

Potassium Use Efficiency in Kg/Ha


Nitrogen Use Efficiency in percentage. Calculation is based on Yield, Protein and Grain Moisture data layers

Nitrogen Use Efficiency in percentage. Calculation is based on Yield, Protein and Grain Moisture data layers


Nitrogen: Target Rx vs As-Applied

Nitrogen: Target Rx vs As-Applied


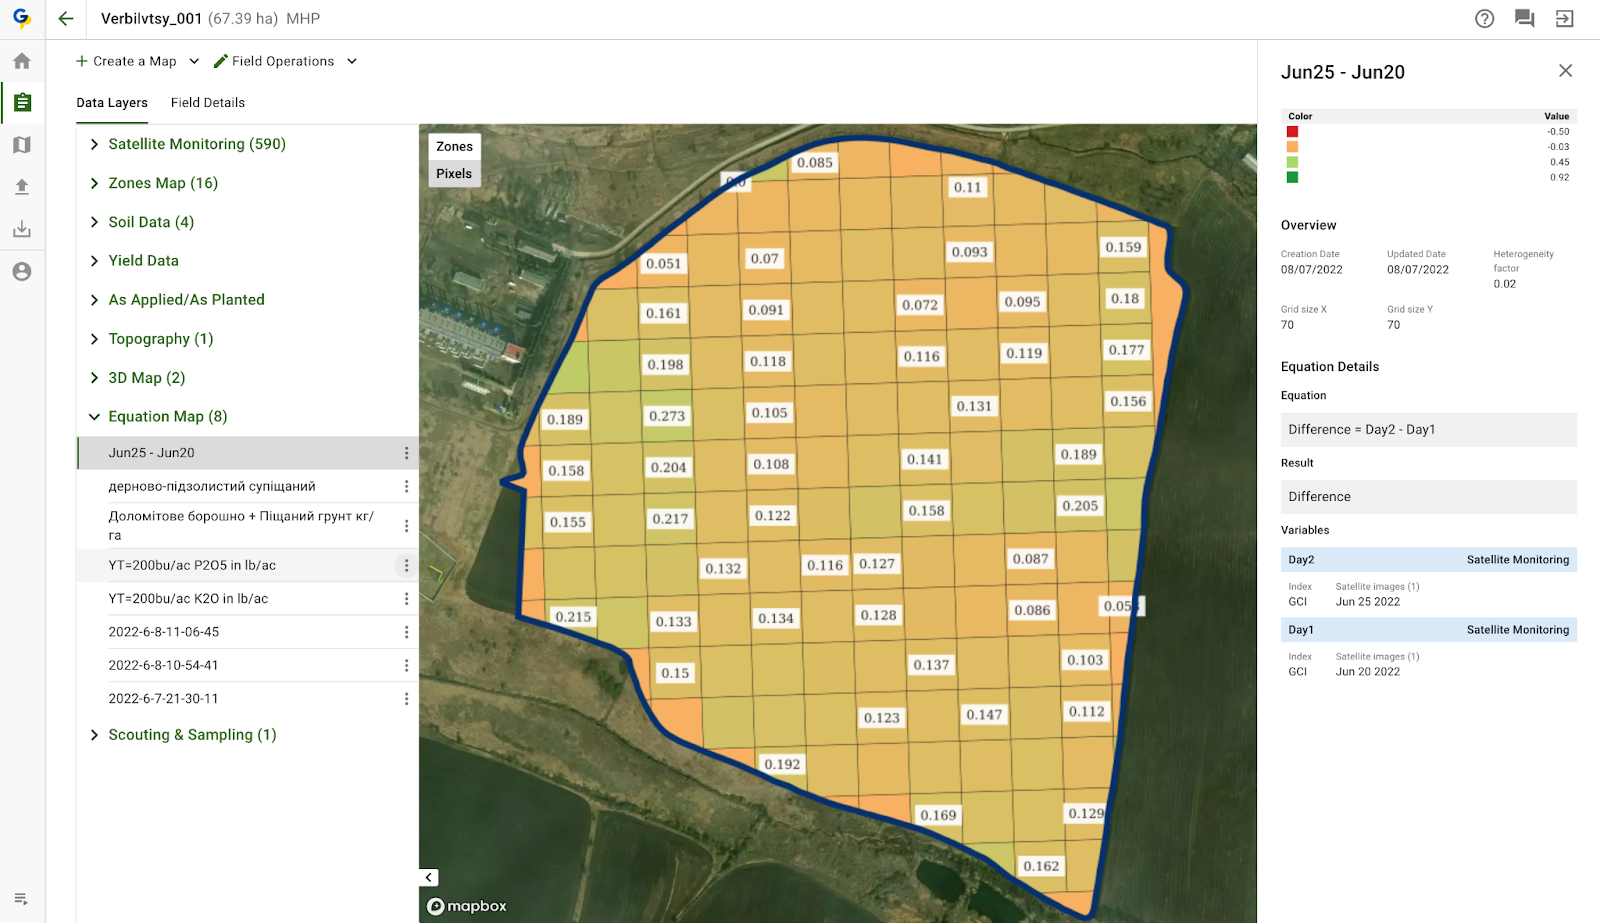
Chlorophyll difference between two satellite images

Chlorophyll difference between two satellite images


A user of GeoPard can adjust existing and create their private formulas based on Imagery, Soil, Yield, Topography, or any other data layers GeoPard supports. 

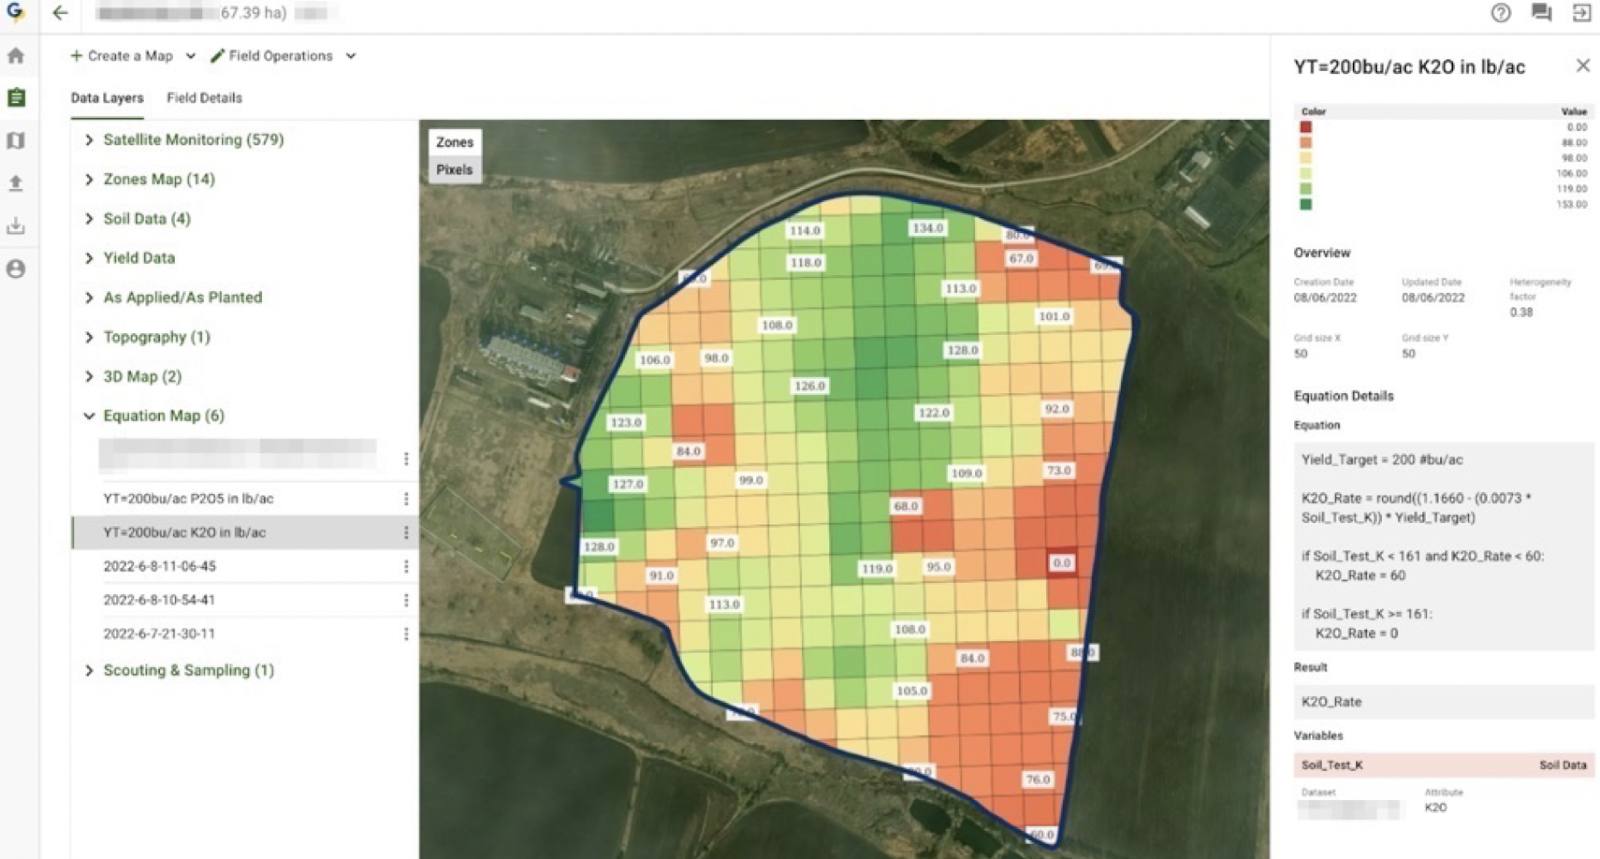
Examples of the template GeoPard Equations

Examples of the template GeoPard Equations


Formula-based analytics helps farmers, agronomists, and data scientists to automate their workflows and make decisions based on multiple data and scientific research to enable easier implementation of sustainable and precision agriculture.

What is Equation-based Analytics in Precision Agriculture? The Use of Precision Formula

Equation-based analytics in precision agriculture refers to the use of mathematical models, equations, precision formula, and algorithms to analyze agricultural data and derive insights that can help farmers make better decisions about crop management.

These analytics methods incorporate various factors such as weather conditions, soil properties, crop growth, and nutrient requirements to optimize agricultural practices and improve crop yields, while minimizing resource waste and environmental impact.

Some of the key components of equation-based analytics in precision agriculture include:

  • Crop growth models: These models describe the relationship between various factors such as weather, soil properties, and crop management practices, to predict crop growth and yield. Examples of such models include the CERES (Crop Environment Resource Synthesis) and APSIM (Agricultural Production Systems sIMulator) models. These models can help farmers make informed decisions about planting dates, crop varieties, and irrigation scheduling.
  • Soil water models: These models estimate the water content in the soil profile based on factors such as rainfall, evaporation, and crop water use. They can help farmers optimize irrigation practices, ensuring that water is applied efficiently and at the right time to maximize crop yields.
  • Nutrient management models: These models predict nutrient requirements for crops and help farmers determine the optimal rates and timing of fertilizer application. By using these models, farmers can ensure that crops receive the right amount of nutrients, while minimizing the risk of nutrient runoff and environmental pollution.
  • Pest and disease models: These models predict the likelihood of pest and disease outbreaks based on factors such as weather conditions, crop growth stages, and management practices. By using these models, farmers can make proactive decisions about pest and disease management, such as adjusting planting dates or applying pesticides at the right time.
  • Remote sensing-based models: These models use satellite imagery and other remote sensing data to monitor crop health, detect stress factors, and estimate yield. By integrating this information with other data sources, farmers can make better decisions about crop management and optimize resource use.

In summary, equation-based analytics in precision agriculture uses mathematical models and algorithms to analyze complex interactions between various factors that affect crop growth and management. By leveraging these analytics, farmers can make data-driven decisions to optimize agricultural practices, improve crop yields, and minimize environmental impact.


Frequently Asked Questions


1. How can precision agriculture help address resource use and pollution issues in agriculture?

It can help address resource use and pollution issues in agriculture through targeted resource application, efficient resource management, enhanced monitoring, and the adoption of conservation practices. By applying inputs such as fertilizers and pesticides only where needed, farmers can reduce waste and minimize pollution.

Data-driven decision-making enables optimal resource management, while real-time monitoring allows for timely interventions to prevent pollution incidents. Additionally, the implementation of conservation practices promotes sustainable agriculture and reduces environmental impacts.

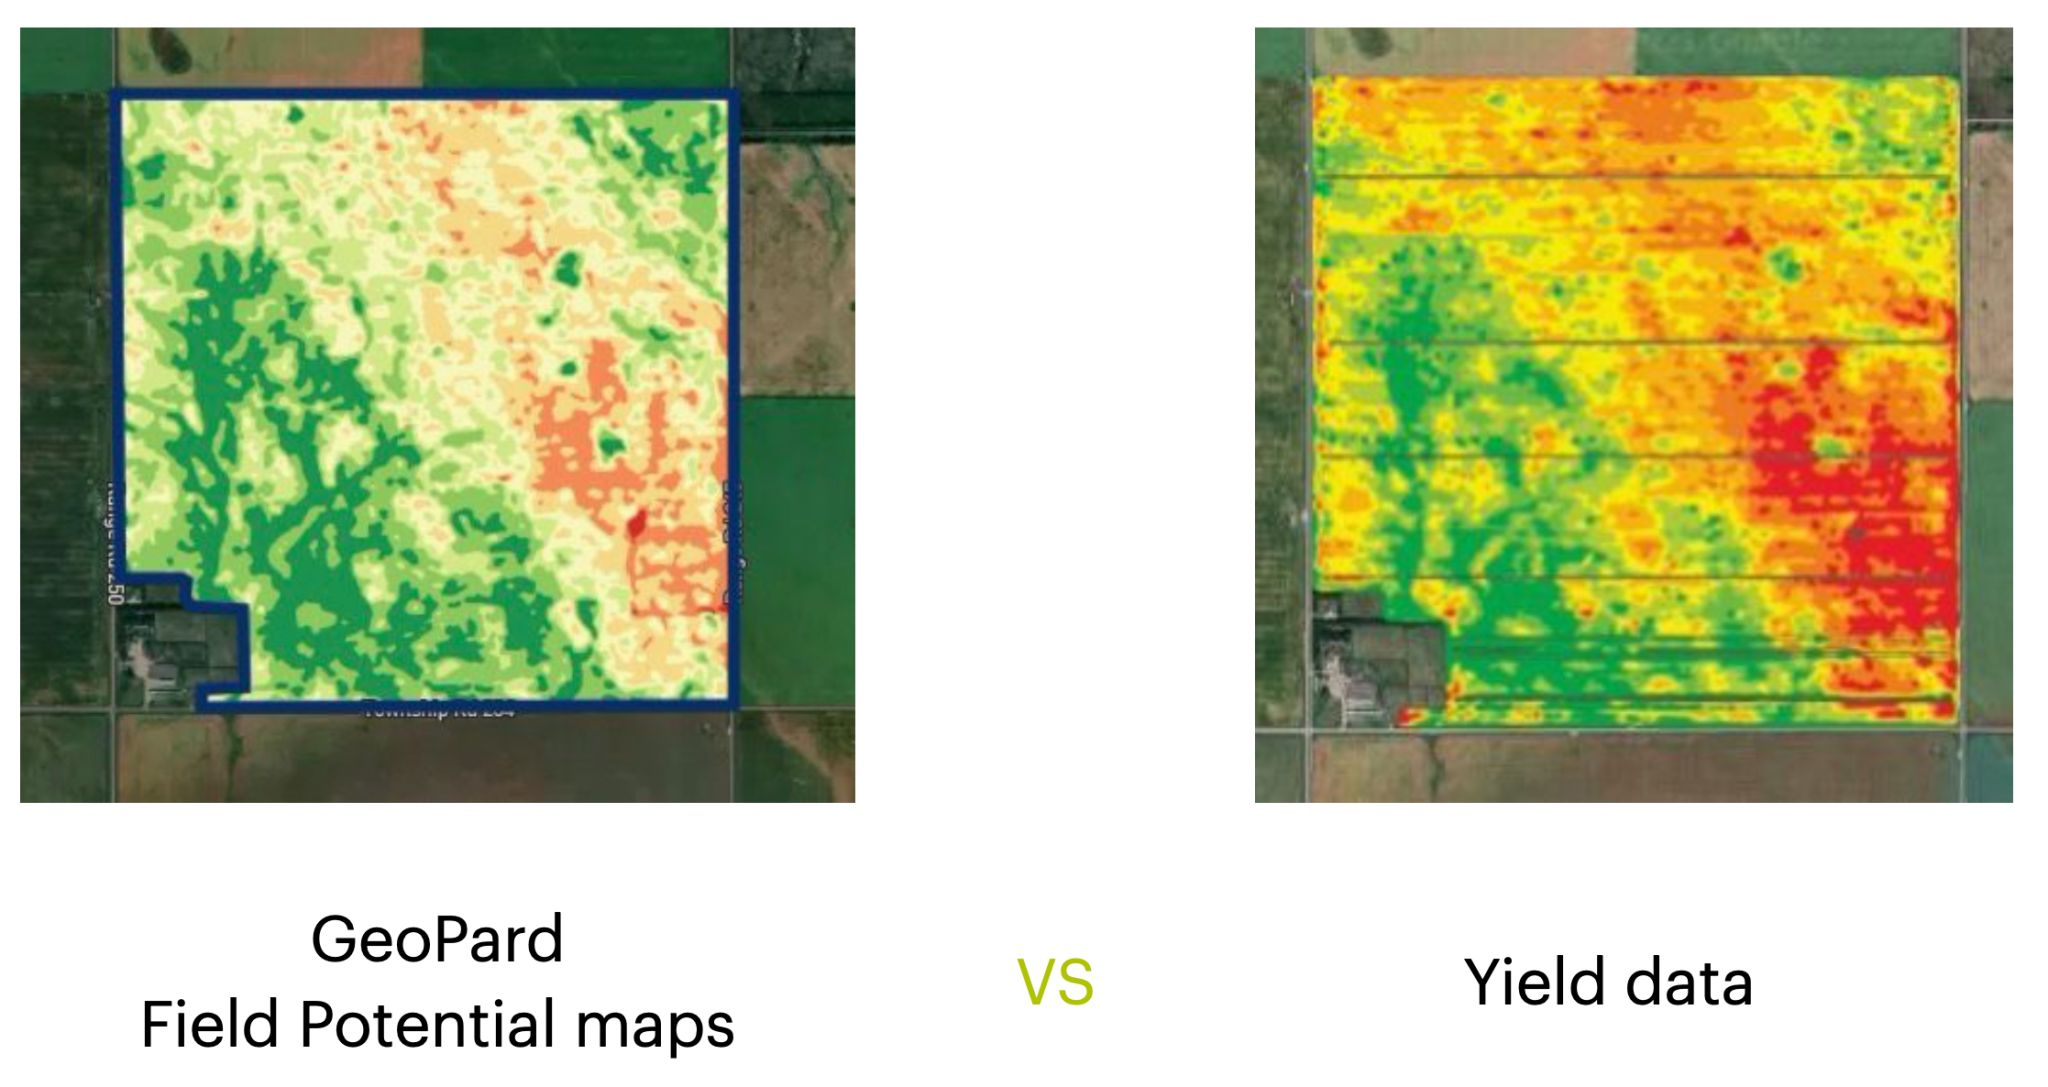
GeoPard Field Potential maps vs Yield data

GeoPard Field Potential maps very often look exactly like yield data.

We create them using multi-layer analytics of historical information, topography, and bare soil analysis.

The process of such synthetic Yield maps is automated (and patented) and it takes about 1 minute for any field in the world to generate it.


GeoPard Field Potential maps vs Yield data

Can be used as the basis for:

What are Field Potential maps?

Field potential maps, also known as yield potential maps or productivity potential maps, are visual representations of the spatial variability in potential crop yield or productivity within a field. These maps are created by analyzing various factors that influence crop growth, such as soil properties, topography, and historical yield data.

These maps can be used in precision agriculture to guide management decisions, such as variable-rate application of fertilizers, irrigation, and other inputs, as well as to identify areas that require specific attention or management practices.

Some key factors that are typically considered when creating field potential maps include:

  1. Soil properties: Soil characteristics such as texture, structure, organic matter content, and nutrient availability play a significant role in determining crop yield potential. By mapping soil properties across a field, farmers can identify areas of high or low productivity potential.
  2. Topography: Factors like elevation, slope, and aspect can influence crop growth and yield potential. For example, low-lying areas may be prone to waterlogging or have a higher risk of frost, while steep slopes may be more susceptible to erosion. Mapping these topographical features can help farmers understand how they affect productivity potential and adjust their management practices accordingly.
  3. Historical yield data: By analyzing historical yield data from previous years or seasons, farmers can identify trends and patterns in productivity across their fields. This information can be used to create these maps that highlight areas of consistently high or low yield potential.
  4. Remote sensing data: Satellite imagery, aerial photography, and other remote sensing data can be used to assess crop health, vigor, and growth stage. This information can be used to create these maps that reflect the spatial variability in crop productivity potential.
  5. Climate data: Climate variables such as temperature, precipitation, and solar radiation can also influence crop growth and yield potential. By incorporating climate data into these maps, farmers can better understand how environmental factors affect productivity potential in their fields.

They are valuable tools in precision agriculture, as they help farmers visualize the spatial variability in productivity potential within their fields. By using these maps to guide management decisions, farmers can optimize the use of resources, improve overall crop yields, and reduce the environmental impact of their agricultural operations.

Difference between Field Potential maps vs Yield data

Field potential maps and yield data are both used in precision agriculture to help farmers understand the spatial variability in their fields and make better-informed management decisions. However, there are some key differences between the two:

Data sources:

These maps are created by integrating data from various sources, such as soil properties, topography, historical yield data, remote sensing data, and climate data. However, this data is collected using yield monitors installed on harvesting equipment, which record the crop yield as it is harvested.

Temporal aspect:

These maps represent an estimation of the potential productivity of a field, which is generally static or changes slowly over time, barring significant changes in soil properties or other influencing factors. However, yield data is specific to a particular growing season or multiple seasons and can vary significantly from year to year based on factors like weather conditions, pest pressure, and management practices.

In summary, field potential maps and yield data are complementary tools in precision agriculture. These maps provide an estimate of the potential productivity of a field, helping farmers identify areas that may require different management practices. Yield data, on the other hand, documents the actual crop output and can be used to assess the effectiveness of management practices and inform future decision-making.

To compare field potential zones with the harvest they produced, open the Automated Yield Report: it puts yield next to the zones map, shows each zone against the field average, and prices every rate step.

Vegetation Indices and Chlorophyll Content

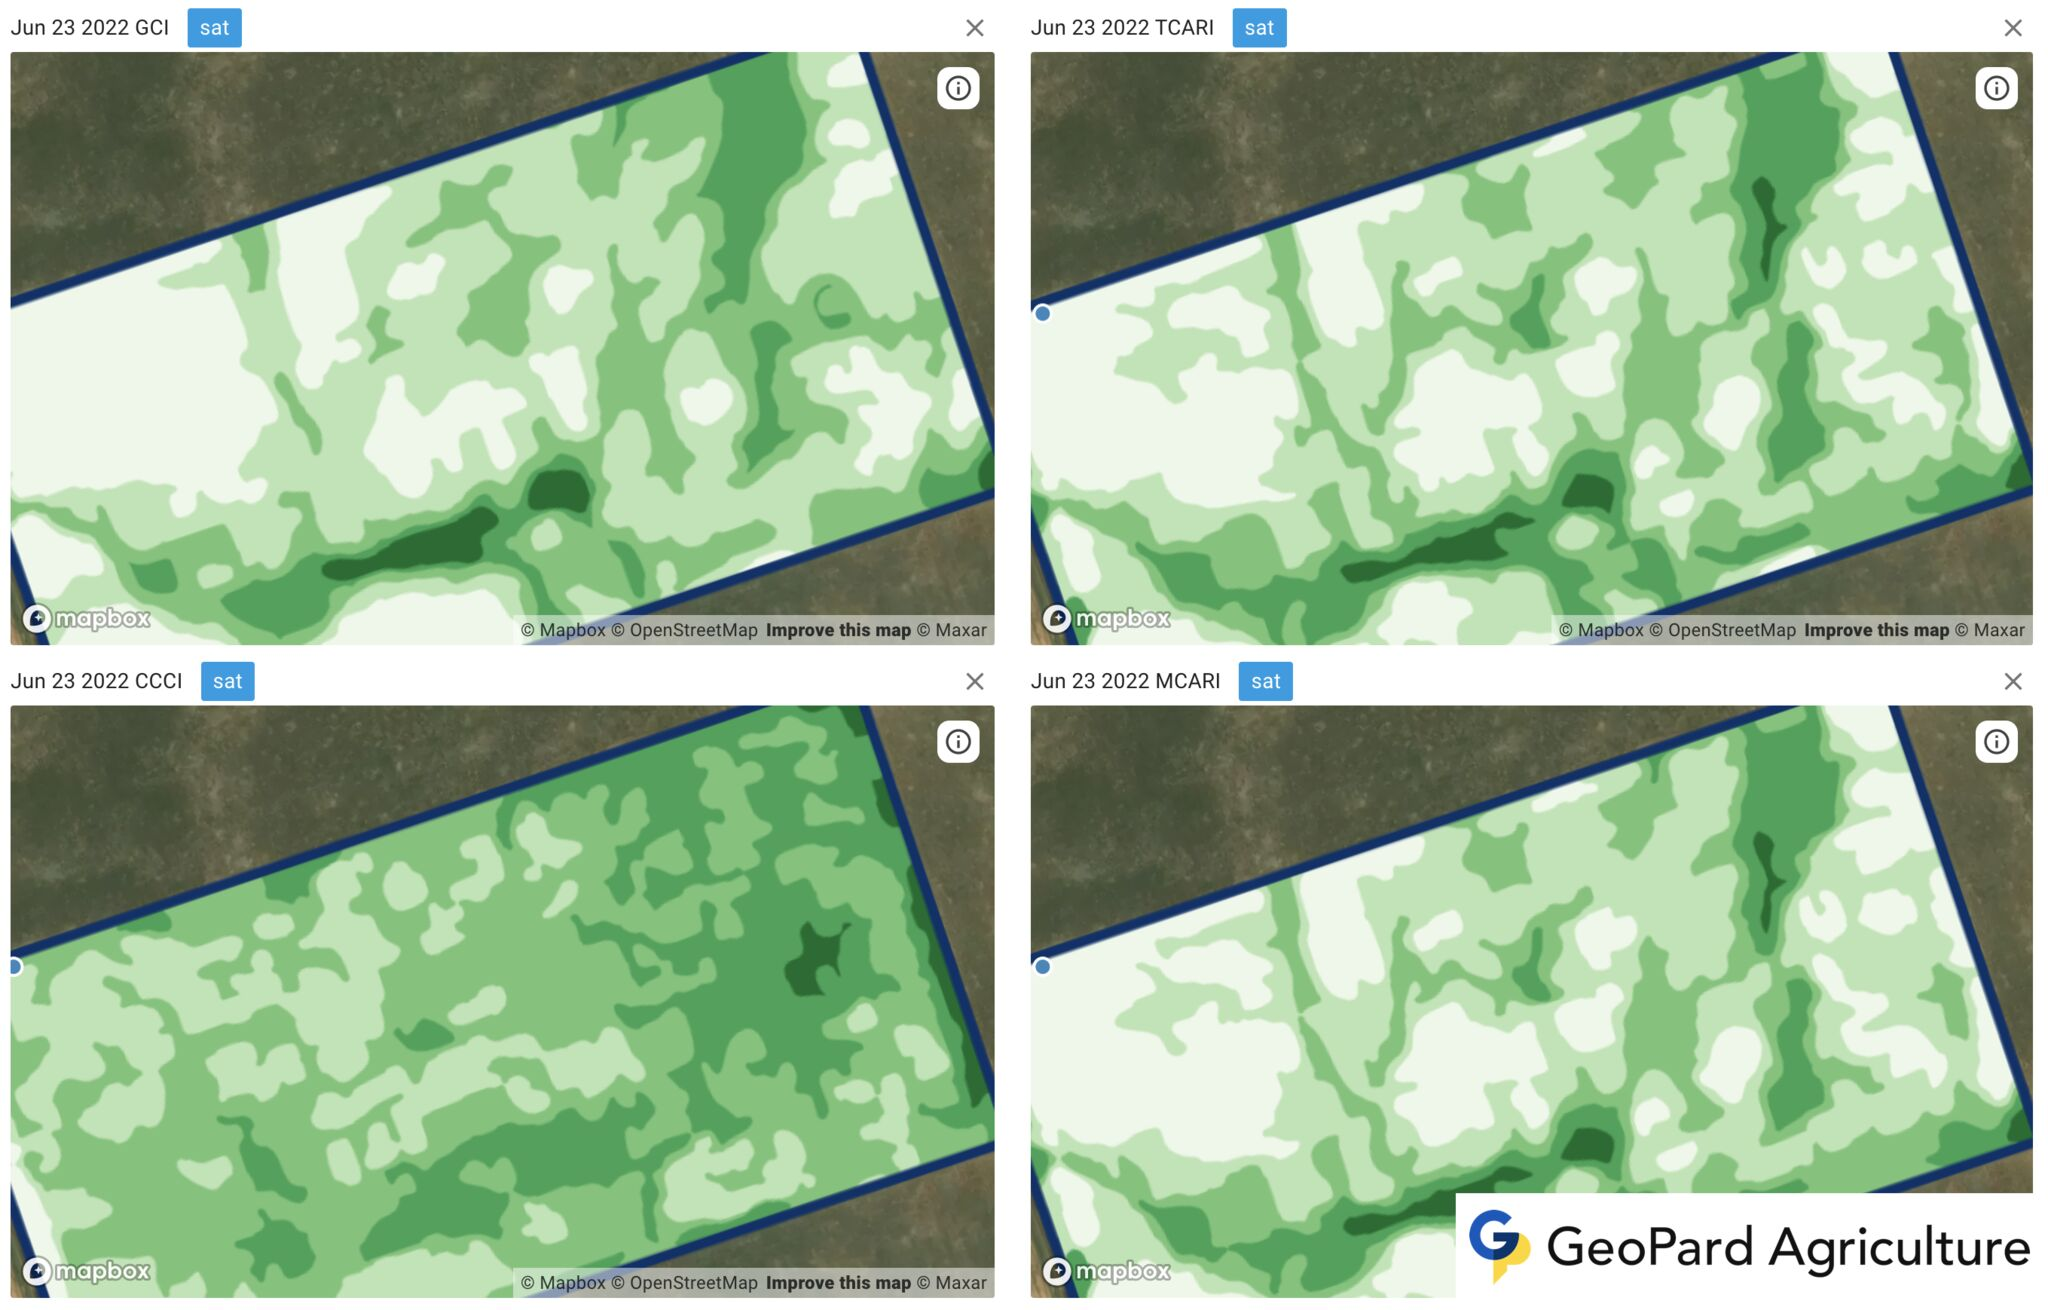
GeoPard extends the family of supported chlorophyll-linked vegetation indices with

  • Canopy Chlorophyll Content Index (CCCI)
  • Modified Chlorophyll Absorption Ratio Index (MCARI)
  • Transformed Chlorophyll Absorption in Reflectance Index (TCARI)
  • ratio MCARI/OSAVI
  • ratio TCARI/OSAVI

They help to understand the current crop development stage including

  • identification of the areas with nutrient demand,
  • estimation of the nitrogen removal,
  • potential yield evaluation,

And the insights are used for precise Nitrogen Variable Rate Application maps creation.


Read More: Which index is the best to use in the precisionAg

Read More: GeoPard vegetation indices


Vegetation Indices and Chlorophyll ContentCanopy Chlorophyll Content Index (CCCI) vs Modified Chlorophyll Absorption Ratio Index (MCARI) vs Transformed Chlorophyll Absorption in Reflectance Index (TCARI) vs Ratio MCARI/OSAVI

What is Vegetation Indices?

Vegetation indices are numerical values derived from remotely sensed spectral data, such as satellite or aerial imagery, to quantify the density, health, and distribution of plant life on the Earth’s surface.

They are commonly used in remote sensing, agriculture, environmental monitoring, and land management applications to assess and monitor vegetation growth, productivity, and health.

These indices are calculated using the reflectance values of different wavelengths of light, particularly in the red, near-infrared (NIR), and sometimes other bands.

The reflectance properties of vegetation vary with different wavelengths of light, allowing for the differentiation between vegetation and other land cover types.

Vegetation typically has strong absorption in the red region and high reflectance in the NIR region due to chlorophyll and cell structure characteristics.

Some widely used vegetation indices include:

  • Normalized Difference Vegetation Index (NDVI): It is the most popular and widely used vegetation index, calculated as (NIR – Red) / (NIR + Red). NDVI values range from -1 to 1, with higher values indicating healthier and denser vegetation.
  • Enhanced Vegetation Index (EVI): This index improves upon NDVI by reducing atmospheric and soil noise, as well as correcting for canopy background signals. It uses additional bands, such as blue, and incorporates coefficients to minimize these effects.
  • Soil-Adjusted Vegetation Index (SAVI): SAVI is designed to minimize the influence of soil brightness on the vegetation index. It introduces a soil brightness correction factor, enabling more accurate vegetation assessments in areas with sparse or low vegetation cover.
  • Green-Red Vegetation Index (GRVI): GRVI is another simple ratio index that uses the green and red bands to assess vegetation health. It is calculated as (Green – Red) / (Green + Red).

These indices, among others, are used by researchers, land managers, and policymakers to make informed decisions regarding land use, agriculture, forestry, natural resource management, and environmental monitoring.

wpChatIcon
wpChatIcon

    Request Free GeoPard Demo / Consultation


    By clicking the button you agree our Privacy Policy. We need it to reply to your request.

      Subscribe


      By clicking the button you agree our Privacy Policy

        Send us information


        By clicking the button you agree our Privacy Policy