Now, to have a whole conversation about precision agriculture, you need to speak about Vegetation Index, particularly when you’re discussing the role of remote sensing in this form of agriculture.
Vegetation is intimately involved with almost every facet of human existence, including the act of breathing, the provision of clothes and shelter, the production of food, etc. Any shift in the composition of the vegetation can influence the environment and the economy significantly.
Recent technological advances (geographic information systems (GIS), global positioning systems (GPS), remote sensing, and precision agriculture) have been the principal drivers of improved crop management. For instance, precision agriculture provides improved analysis and the discovery and control of both temporal and geographical variations in crop production within a field.
AgTech pioneers revolutionize precision agriculture via vegetation indices. It is of utmost significance in the achievement of the objective of this kind of agriculture, which is to maximize production while minimizing the number of resources used.
This modern use of vegetation indice in precision farming provides several advantages: physicochemical monitoring, real-time data, and farm activity planning. It is also possible to make efficient use of vegetation indexes mapping for future references to indicate the cyclical changes.
What are vegetation indices and their types?
Since 1974, the use of vegetation indexes, which assists in conducting periodic distant surveys of vegetation, has been widespread. Utilizing two or more spectral bands, this statistical model is a spectral transformation that may be used to detect vegetation in its more general meaning.

Using this method, scientists and other curious individuals may efficiently watch photo-centric behaviors and spot differences in the canopy. If necessary, they can also draw reliable comparisons using this information. It involves evaluating a variety of variables, such as the development of the crop, its vigor, its biomass, and its chlorophyll content. Here is the list of vegetation indices:
- NDVI (Normalized Difference Vegetation Index)
- VARI (Visible Atmospherically Resistant Index)
- ReCl (Red-Edge Chlorophyll Vegetation indexes)
- EVI2 (Two-Band Enhanced vegetation index)
- LAI (Leaf Area Vegetation Index)
- WDRVI (Wide Dynamic Range Vegetation Index)
- GNDVI (Green Normalized Difference Vegetation indexes)
- GCI (Green Chlorophyll Vegetation Index)
- RCI (Red Chlorophyll Vegetation indice)
- NDWI (Normalized Difference Water Index)
What can vegetation index be used for?
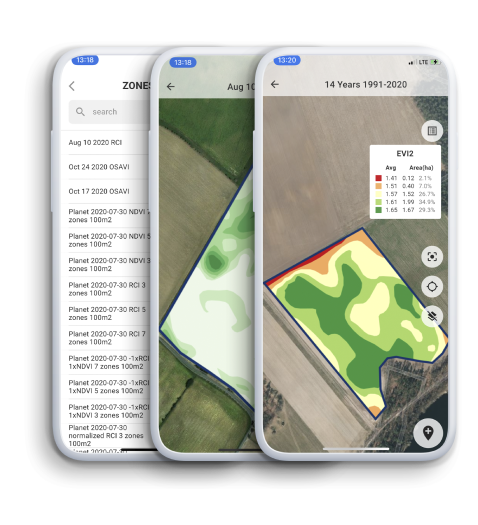
When examining patterns in plant health, agricultural professionals such as farmers, agronomists, crop insurers, researchers, and others might benefit from using a vegetation index such as NDVI or VARI.
Users of the agricultural mapping and analysis tool can implement the index with the click of a button, producing a green or red patch on their aerial images, depending on the results of the index. The regions indicated by the color green have plants that are in good health. Colors such as orange, yellow, and red indicate a loss of energy and vitality.
For instance, a corn farmer may use the program to submit multispectral photographs of their cornfields at any point between the appearance of plants and the harvesting of the crop. The application would then apply the preferred vegetation index.
The colorful output may bring to their attention that a portion of the field has taken on an orange and red hue in certain places. It is an indication that the plants are becoming brown or yellow or that they are getting pockmarked. The plants in this region may be suffering from the effects of an extended period of drought, flooding, insufficient or excessive fertilization, or are infected with a disease.
As was the case before, ground-truthing was the most effective method for diagnosing a specific problem. Nevertheless, the vegetation indice provide the farmer with a hint that they should concentrate their efforts on a particular section of their land. They are free to investigate what caused the problem and consider possible solutions at this point.
Why are hyperspectral vegetation indices so important?
Integrating a reflectance spectrum into a single numerical value, known as the Vegetation Index, is a standard method for determining the qualities of vegetation. Hyperspectral Vegetation Indices, also known as Narrow-band Vegetation indexes, contain characteristics or wavelengths that hyperspectral equipment can only catch because of their shorter bandwidths.
Structure, biochemistry, and plant physiology or stress are the three primary categories that may be used to classify the vegetation attributes that can be assessed using HVIs.
- The proportionate cover, Leaf Area Index (LAI), green leaf biomass, senesced biomass, and proportion of photosynthetically active radiation absorbed are all examples of structural features that may be measured. Most indices for structural analysis were designed for complete band setups and had narrow-band and hyperspectral counterparts.
- Examples of biochemical features comprise water, pigments (such as chlorophyll, anthocyanins, and carotenoids), and other nitrogen-rich products (such as proteins). Plant structural components also fall under this category (lignin and cellulose).
- A stress-induced shift in the status of xanthophylls, variations in chlorophyll content, changes in leaf wetness, and fluorescence are some understated alterations that may be measured using physiological and stress indices.

Generally speaking, biochemical and physiological or stress indicators were developed with the help of laboratory or field equipment (spectral sampling of less than 10 nm). They are aimed at very tiny spectral characteristics. As a direct consequence of this, they are exclusively hyperspectral. Developed indices for water are the only exception to this rule.
Vegetation index and remote sensing technology
Earth-observing satellites supply remote sensing scientists with new data to feed their study and improve upon the analysis that has already been conducted as sensors progress.
Businesses that already have their index-based technology and those that are preparing to introduce a new one can substantially create a market for their agriculture-related products by embracing the latest innovations in spectral vegetation indexes applications. It is valid for companies that already have their index-based software and those planning to launch a new one.
The benefits vegetation indexes offer in remote sensing enhance the overall quality of the customer experience. Comparing satellite photography to different types of aerial data enables the following:
- Reduced expenses of operation, processing, and interpretation of data collected by drones.
- In comparison to aerial images, satellite imagery may cover a wider area.
- Bringing down the costs of doing field inspections: extra UAV (unmanned aerial vehicle) observations are more expensive than standard satellite revisits.
- Obtaining analyses of the data in a suitable format within a shorter amount of time.
- Monitoring the fields regardless of how strong the winds are.
Using satellite imagery enables agricultural software companies to considerably increase the amount of aerial data they already have access to while also saving them time and money and allowing end-users to obtain more data in a shorter time.
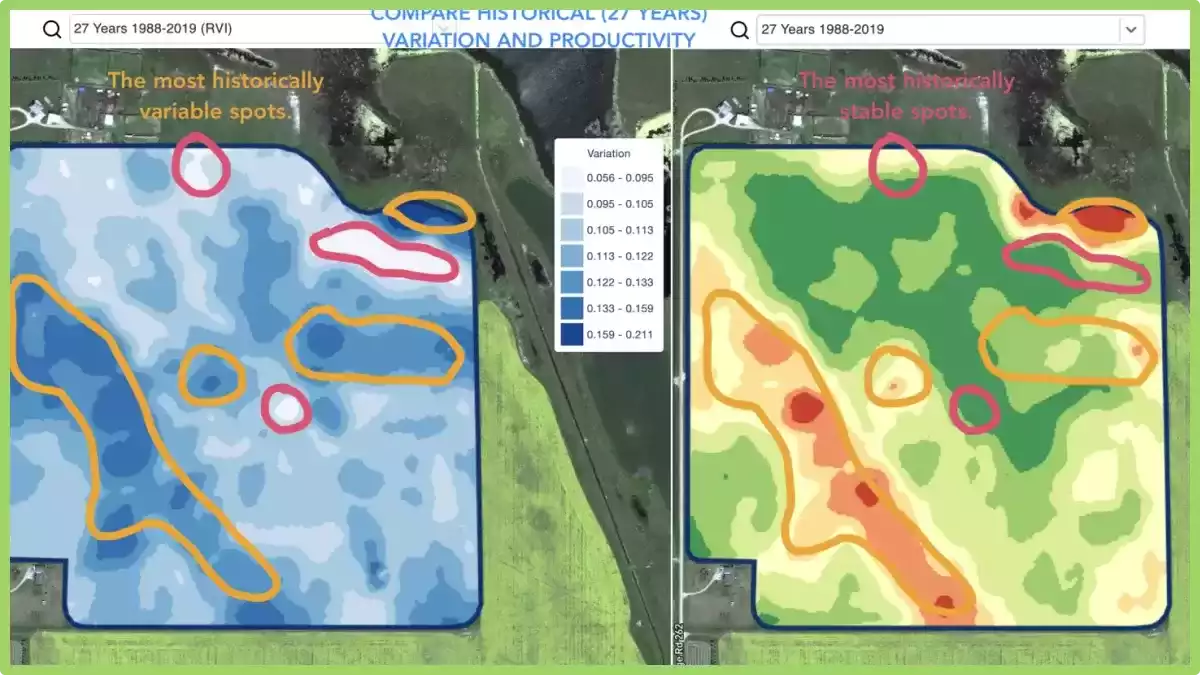
Therefore, vegetation indice in remote sensing and crop monitoring help conduct a high-level, distant examination of the crop status. If there is a problem, farmers may choose to examine the areas that have been noticed rather than the whole field.
Reach out to GeoPard for a solution in your niche
The vast majority of the most critical vegetation indices, which number in the hundreds, have to be included in agricultural software in the form of a long list that can be accessed and used in a single location. GeoPard offers the essential analytics that can be integrated into the already available agriculture software and the planned software.
We will guide you on the optimal choice that will fulfill the requirements set out by you or your clients. No matter how you plan to utilize our product — API, white-label, or bespoke solutions — you can rest confident that the data you receive will be accurate and trustworthy since it was gathered using remote sensing and cutting-edge satellite technology.
GeoPard can provide accurate data-driven analytics on a worldwide scale. As a result, the company has won the satisfaction of many happy clients. Please contact us to discuss the specifics and potential of using remote sensing in your niche or industry.
Crop monitoring is a crucial tool that allows crop growers to detect problem areas and mitigate the risk of yield losses.
Easily monitor your crop development by relying on the latest satellite imagery. Add your field boundary to the system and access the complete satellite imagery archive on one screen:
- Assessment of crop development conditions.
- Detection of vegetation anomalies in near-real time.
- Scout spots with different levels of crop development.
- View through the clouds.
Translate the satellite imagery crop monitoring insights into fieldwork actions and benefit from making the data-driven decisions:
- Detect the difference in crop vegetation between the latest images and scout the focused areas for tissue sampling.
- Create Variable Rate Application maps for crop protection and in-season fertilization based on near-real-time field assessment and collect the execution report.
- Mark the damaged field areas after a weather disaster or a disease or a pest attack and send reports to the insurance.