When you are hearing of Variable Rate Fertilizer (VRF) for the first time, then, you need to understand that this involves the use of conflicting rates and even types of fertilizers on different soil areas in a given piece of land based on a pre-set field map that is generated depending on all kinds of information. The main goal is to balance fertilizer application and heighten crop production, but again, VRF invites lots of challenges.
Of all the challenges, the first one is mainly for farmers to choose whether there is adequate soil variation within the fields to warrant the financing of coming up with accurate fertilizer maps.
As for the costs, private agronomists do charge about $5 to $15 per acre or even higher amounts for other VRF services. Besides that, the cost varies according to the kind of technologies used, the value of variable rate fertilizer information given, and the extent of analysis and soil sampling done.
The important section of annual cropland across the Prairies of Western Canada possesses adequate variability in surface physical and chemical traits in the lands to allow for the use of a certain quantity of variable rate fertilization.
A general law is that lands with rolling topography possess a good potential for adopting the use of VRF technology, as opposed to the fields having uniform topography always not having adequate soil variation to allow for the use of VRF technology.
Immediately a choice has been made to allow for the use of variable rate fertilizer technology, the tiresome drawback for landowners and crop consultants is to build “effective” variable rate fertilizer prescription maps.
For this to be attained, conflicting soil handling zones have to be known first. Below are some of the questions that farmer-owners have to inquire about:
Which are the most valuable full soil factors that have to be delineated to find site-specific management sections that possess lower, medium, and even higher crop production chances on their field?
These variable factors may include things such as depth of topsoil, present quantities of N, P, K, or S, a variation in the soil texture, soil organic matter quantities, and lastly the depth of the subsoil among many others.
Which are the highly vouched for methods to find site-specific or topography management sections in the lands? The information may involve things such as satellite imagery, land topography map, crop production maps, and aerial photos among many others.
The most crucial is field-specific farmer proficiency and awareness that does not go beyond the $10 per acre when priced by VRF firms.
How variable are soul test N, P, K, and S quantities in a field and across the known soil management sections? How do crops respond to all the applied fertilizers depending on every year?
How will you or even your crop advisor find out about the highest levels of fertilizer types and rates for each of the management sections to balance economic returns for variable lands? For instance, will you use more fertilizer or less fertilizer on eroded knolls or less productivity against higher yield sections?
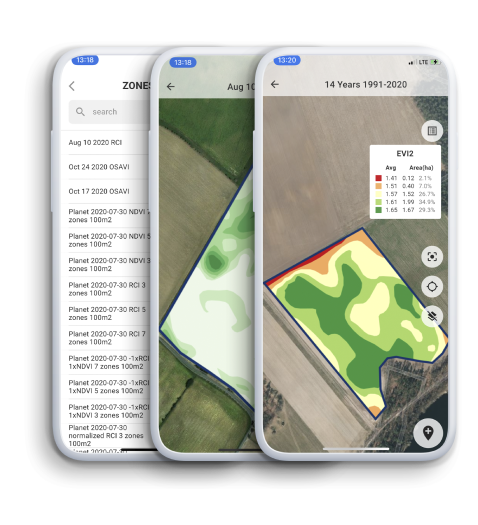
Tools for generating management zones
Firstly, to get to know the soil variability found on their lands, farmers can choose to use aerial photos of their lands, crop yield maps, provincial soil survey maps, and also their general knowledge of crop yields in their lands.
It can be a very good beginning, though always, more deep information may be required. Industry agronomists possess different approaches to the best ways to come up with fertilizer prescription maps. They use a range of approaches to produce different kinds of field maps and each one of them has advantages and drawbacks:
Crop production maps – they can be generated when produced and geographic position data are all keyed in during the harvest with your combine. Yield maps are important to tell the higher, medium, and even lower-productive sections within a piece of land.
The problem is to get to know the major aspects that contribute to higher and lower production chances. Unfortunately, conflicting yielding sections are not necessarily well correlated with differences found in the soil forms and also the level of soil fertility.
Further complicating the process, yield maps always vary mostly every year making it very hard to delineate conflicting land management sections.
Soil texture maps – it is commonly assumed that land sections having higher clay content tend to possess higher water retaining capacity, therefore, possess higher crop production chances. Soil texture maps are produced based on information gathered through an EM 38 or even Veris.
All of the technologies try to measure the available electrical conductivity of the soil via the application of sensors since they are better conductors as compared to sandy textured soils. This makes clay provide higher sensor reading against sandy soils.
But again, the readings are higher on wetter against drier soils, and whenever soil salts are higher against lower. At the moment there are no ways that these instruments can differentiate the causes of higher against lower readings.
Apart from that, such technologies should be avoided whenever the soils are frozen since frozen soil moisture such as ice will not make the instruments respond similarly to liquid moisture such as water. With all that, the ability to find exact soil texture maps is doubted by some researchers and even agronomists regarding their validity and accuracy.
Soil salinity maps – whenever slight to moderate quantities of salts is a most likely problem for your land, coming up with a salinity map by EM 38 or Veris technology can be used.
After that, fertilization rates can be lowered based on the quantities of soil salinity to equal lower crop yield potential. An accurate salinity map is an important tool if soil salinity is a challenge in your land.
Soil organic matter and pH maps – Apart from soil texture, some machines use on-the-go mapping of other soil properties including organic matter and pH. Near-Infrared (NIR) spectral measurements are said to correlate with soil organic matter, soil pH buffer quantity, and soil moisture and soil carbon.
Satellite imagery maps – maps are capable of finding higher against lower yield sections of land. For instance, Near-Infrared satellite imagery is utilized to find much about plant growth. Higher relative biomass production sections in fields are assumed to be related to higher crop production potential. Many firms use imagery to delineate crop management sections in a land.
Besides that, imagery information has a high chance of changing during the planting season and is always variable every year. With that, interpreting this information is difficult. For that given reason, imagery from many good yield years is generally used to find sections with a piece of land having consistent higher or lower yields.
Again, satellite imagery has the same drawbacks as using crop production maps. The main aspects that lead to the differences in crop biomass potential within a piece of land must be known. It is crucial to know if the differences in biomass are associated with the differences in the soil forms and also soil fertility, or even other crop yield aspects.
Topography maps – can be important when creating fertilizer prescription maps. Well, the topography is a big soil-forming aspect that impacts how variable soils have generated on variable sections.
Incorporating variable rate fertilizer application in your farm
Below are the steps that one can use to incorporate variable rate fertilization in his or her land:
Conduct systematic soil sampling on the land and then lab analysis of the soil. Doing so will make you understand the nature of the soil found on your land and from there you can find the rate of fertilizer that you are to use to make the soil properties reach the needed quantity.
Come up with farm-specific maps of the soil nutrient quantities in your field. The maps are to use by the one applying to know the quantity of fertilizer to be applied in certain points of your field according to the needs of every given section.
Utilize the information on analyzed soil properties and farm-specific maps to create a nutrient prescription map that is site-specific. Utilize the nutrient prescription map to regulate and allow the fertilizer variable applicator to complete everything.
Nitrogen application based on multi-layer analytics
Knowing how to achieve maximum yield with the right fertilizer is an ideal way of managing nutrients. A good supply of nitrogen results in healthier roots.
Therefore, more nutrients are captured and those that remain in the soil are reduced. Better precision and timing when fertilizing also reduce residual nitrates that can leach below the root zone and into the groundwater.
By improving the efficiency of nitrogen usage, your farm thrives now and in the future – increasing yields while reducing your impact on the environment. Digital tools can help you accurately choose the right nitrogen application rate, specific to your growing space, in real-time.
As a farmer, you should know that you can calculate the nitrogen use efficiency of your crops with GeoPard. Leopard precision tools are designed to meet the specific needs of your crop and our precision application techniques adapt to different locations and soil types, as well as different weather conditions.
P, K application based on soil sampling data
Potassium and phosphorus fertilization play a fundamental role in plant nutrition. Its deficiency can cause damage to the crop and loss of productivity. It is interesting to keep potassium levels always within the requirements of the plant’s needs and maintain soil fertility.
Potassium fertilization should preferably be carried out at the sowing of the crop, facilitating management and practice. Attention should be paid to symptoms of deficiency and the monitoring of soil fertility using tools such as soil fertility analysis and harvest maps.
How to calculate nitrogen deficiency map based on Target Yield
Nitrogen is key to vegetation: to the formation of chlorophyll, vital for photosynthesis the way plants get food. It is necessary for plant development: amino acids, DNA, membrane proteins, enzymes, most coenzymes, auxins, cytokinins, and cells.
If it is missing, a nitrogen deficiency occurs. On the contrary, its fixation and correct supply guarantee adequate growth and the full production capacity of the crops. Among the consequences of nitrogen deficiency is a low level of protein in cereals, for example, maize and wheat.
When plants lack nitrogen, it can be supplied by organic or chemical methods. This idea is aimed at preventing nitrogen deficiency in plants. The chemical contributions are made with fertilizers that include synthetic nitrogen to try to make the affected plants recover.
Some examples of chemicals that correct nitrogen deficiency are urea or ammonium nitrate. Before thinking of applying any of these chemicals, a soil test must be carried out to adjust the soil’s pH and nutrient content to avoid harming the plants with a different problem at the expense of solving this one.
Calculate N Removal with GeoPard
By knowing the exact amount of removal of one or another element, we can easily calculate the doses of mineral fertilizers to replenish the stock of the content of nutrients.
With the cost of mineral fertilizers, which is only growing every year, one has to think about using additional funds that reduce the number of fertilizers applied.
One of these nutrients is nitrogen. How do you calculate the nitrogen of the current nitrification?
It is easy to calculate. You can take the content of nitrate nitrogen at the start, remove the crop, and at the end measure how much nitrogen has been removed by the removal of the crop. You will get to know the difference accumulated over this period. All values are not fixed, as they depend on many factors.
It seems like a simple formula, but the topic is so extensive that you need to understand each of the indicators, and analyze it personally: how it will be calculated in a particular case, and what component it will have. To know more about this, you can check how to Calculate N Removal with GeoPard.
Summary
GeoPard leads in helping you implement Variable rate fertilizer application on your farm through several services such as:
- Zones creator and managed automation
- Set rates
- Customize
- Multi-layer analytics
- Field Stability maps
- Among many others
Frequently Asked Questions
1. How much to charge for fertilizer application?
The amount to charge for fertilizer application can vary based on several factors. These factors include the size of the area to be treated, the type of fertilizer being used, the equipment and labor required, and local market rates.
It is advisable to research local competitors and consult with industry professionals to determine a fair and competitive price. Consider the costs associated with materials, labor, equipment, and any additional services provided to arrive at a reasonable pricing structure that reflects the value of your expertise and ensures profitability.
2. How to calculate fertilizer rate?
Calculating the fertilizer rate involves a few simple steps. First, determine the nutrient requirement of the specific crop or plant you are fertilizing. This can be based on soil test results or general guidelines.
Next, determine the area to be fertilized in square feet or acres. Divide the nutrient requirement by the area to get the amount of fertilizer needed per unit of area.
Finally, based on the nutrient content of the fertilizer, calculate the quantity of fertilizer needed to meet the desired nutrient rate. Remember to adjust for any variations in application efficiency or specific crop requirements.
3. When to apply fertilizer?
The timing for fertilizer application depends on the type of plant and the specific growth stage. Generally, it is recommended to apply fertilizer during the active growing season. For most plants, this means applying fertilizer in early spring before new growth starts.
However, it’s important to consider the specific recommendations for the plant species and any regional or climate-specific considerations. Additionally, some fertilizers may have specific instructions for application timing, so it’s best to follow the instructions provided on the fertilizer packaging or consult with a gardening expert for optimal results.
Whats