Today’s agricultural industry requires not only hard work and understanding of the land, but also the smart application of technology. I am thrilled to share an insight into one of the tools making a significant difference in sustainable farming practices: GeoPard’s Crop Development Graphs.
Our Crop Development Graphs offer a comprehensive, user-friendly display of crop growth data since 1988. Automatically generated for any field, these graphs are designed to ensure precision and accuracy.
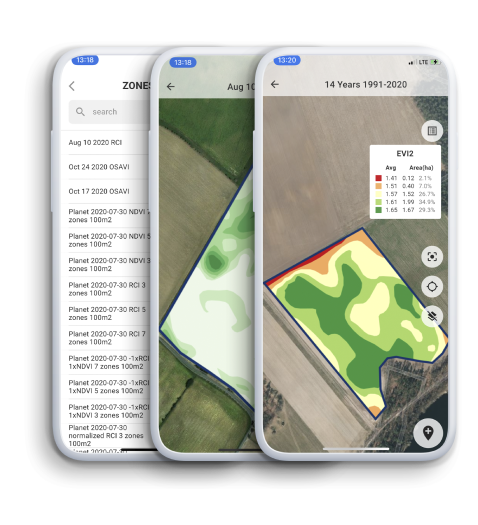
The data is calculated solely for the cloud and shadow-free area of the field. A simple hover reveals the average NDVI (Normalized Difference Vegetation Index) value, providing an instant snapshot of crop health.
But what sets our tool apart? The capability to switch views. GeoPard’s interface allows users to alternate between Yearly and Monthly views. This level of detail ensures you are equipped with the essential data to make well-informed decisions about crop management, harvest timing, and yield prediction.
In the hands of a farmer, this precise insight can guide field management strategies, helping to detect the optimal harvest time, monitor crops at scale, and overall, optimize productivity and sustainability.
This is an exciting step forward in precision farming, a path that leads not only to improved yields but also to more sustainable practices that consider our environmental footprint.
Stay tuned for more updates as we continue to develop and refine our tools to serve the agricultural community better. We’re on a journey to make precision farming more accessible and efficient, and we’re thrilled to have you join us. Together, let’s redefine the future of farming!
Precision Farming