How Integrated Farm Data Analytics Elevate Agronomic Decisions

How Integrated Farm Data Analytics Elevate Agronomic Decisions

You spend hours juggling soil tests, yield maps, satellite images, and machine data—yet your agronomic decisions still feel like guesses. Integrating farm data into one platform changes everything. With GeoPard Agriculture, you get AI powered analytics that turn scattered information into clear management zones and precise VRA maps. Keep reading to see how this unified approach sharpens your agronomic decision making and boosts your ROI. https://www.morningagclips.com/agriculture-data-analytics/

The Power of Integrated Farm Data

Harnessing the full spectrum of farm data can transform your approach to agriculture. Let’s dive into how combining different data types can improve decision-making on the farm.

Yield Data Analysis Insights

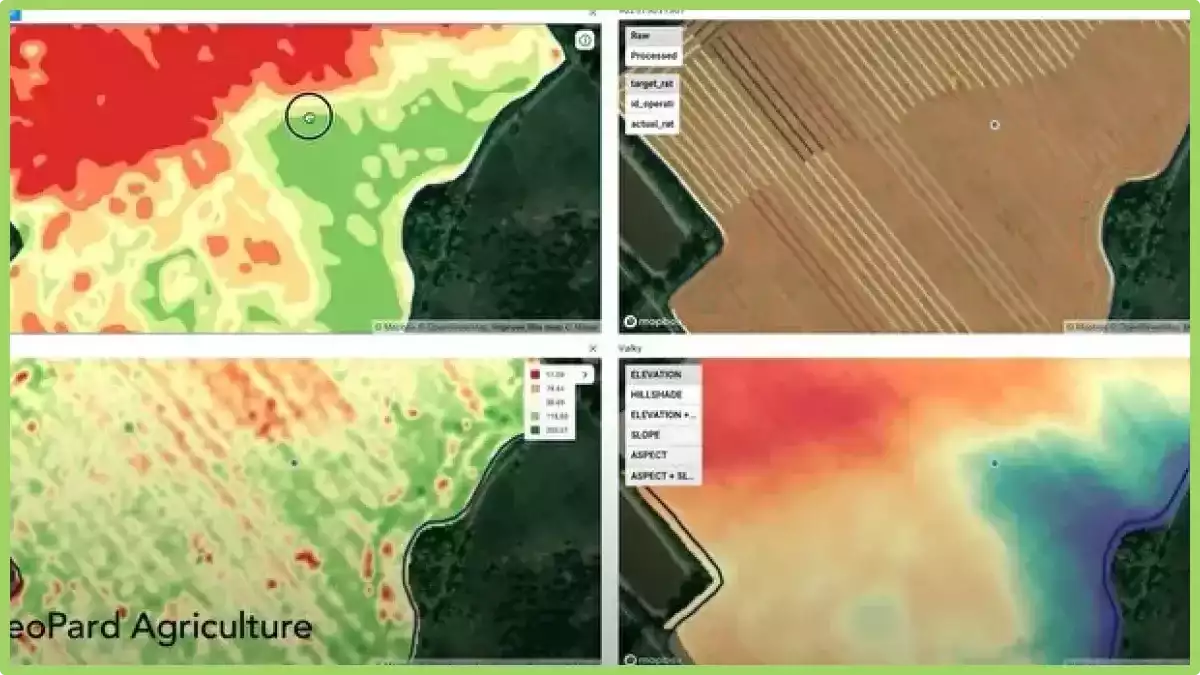
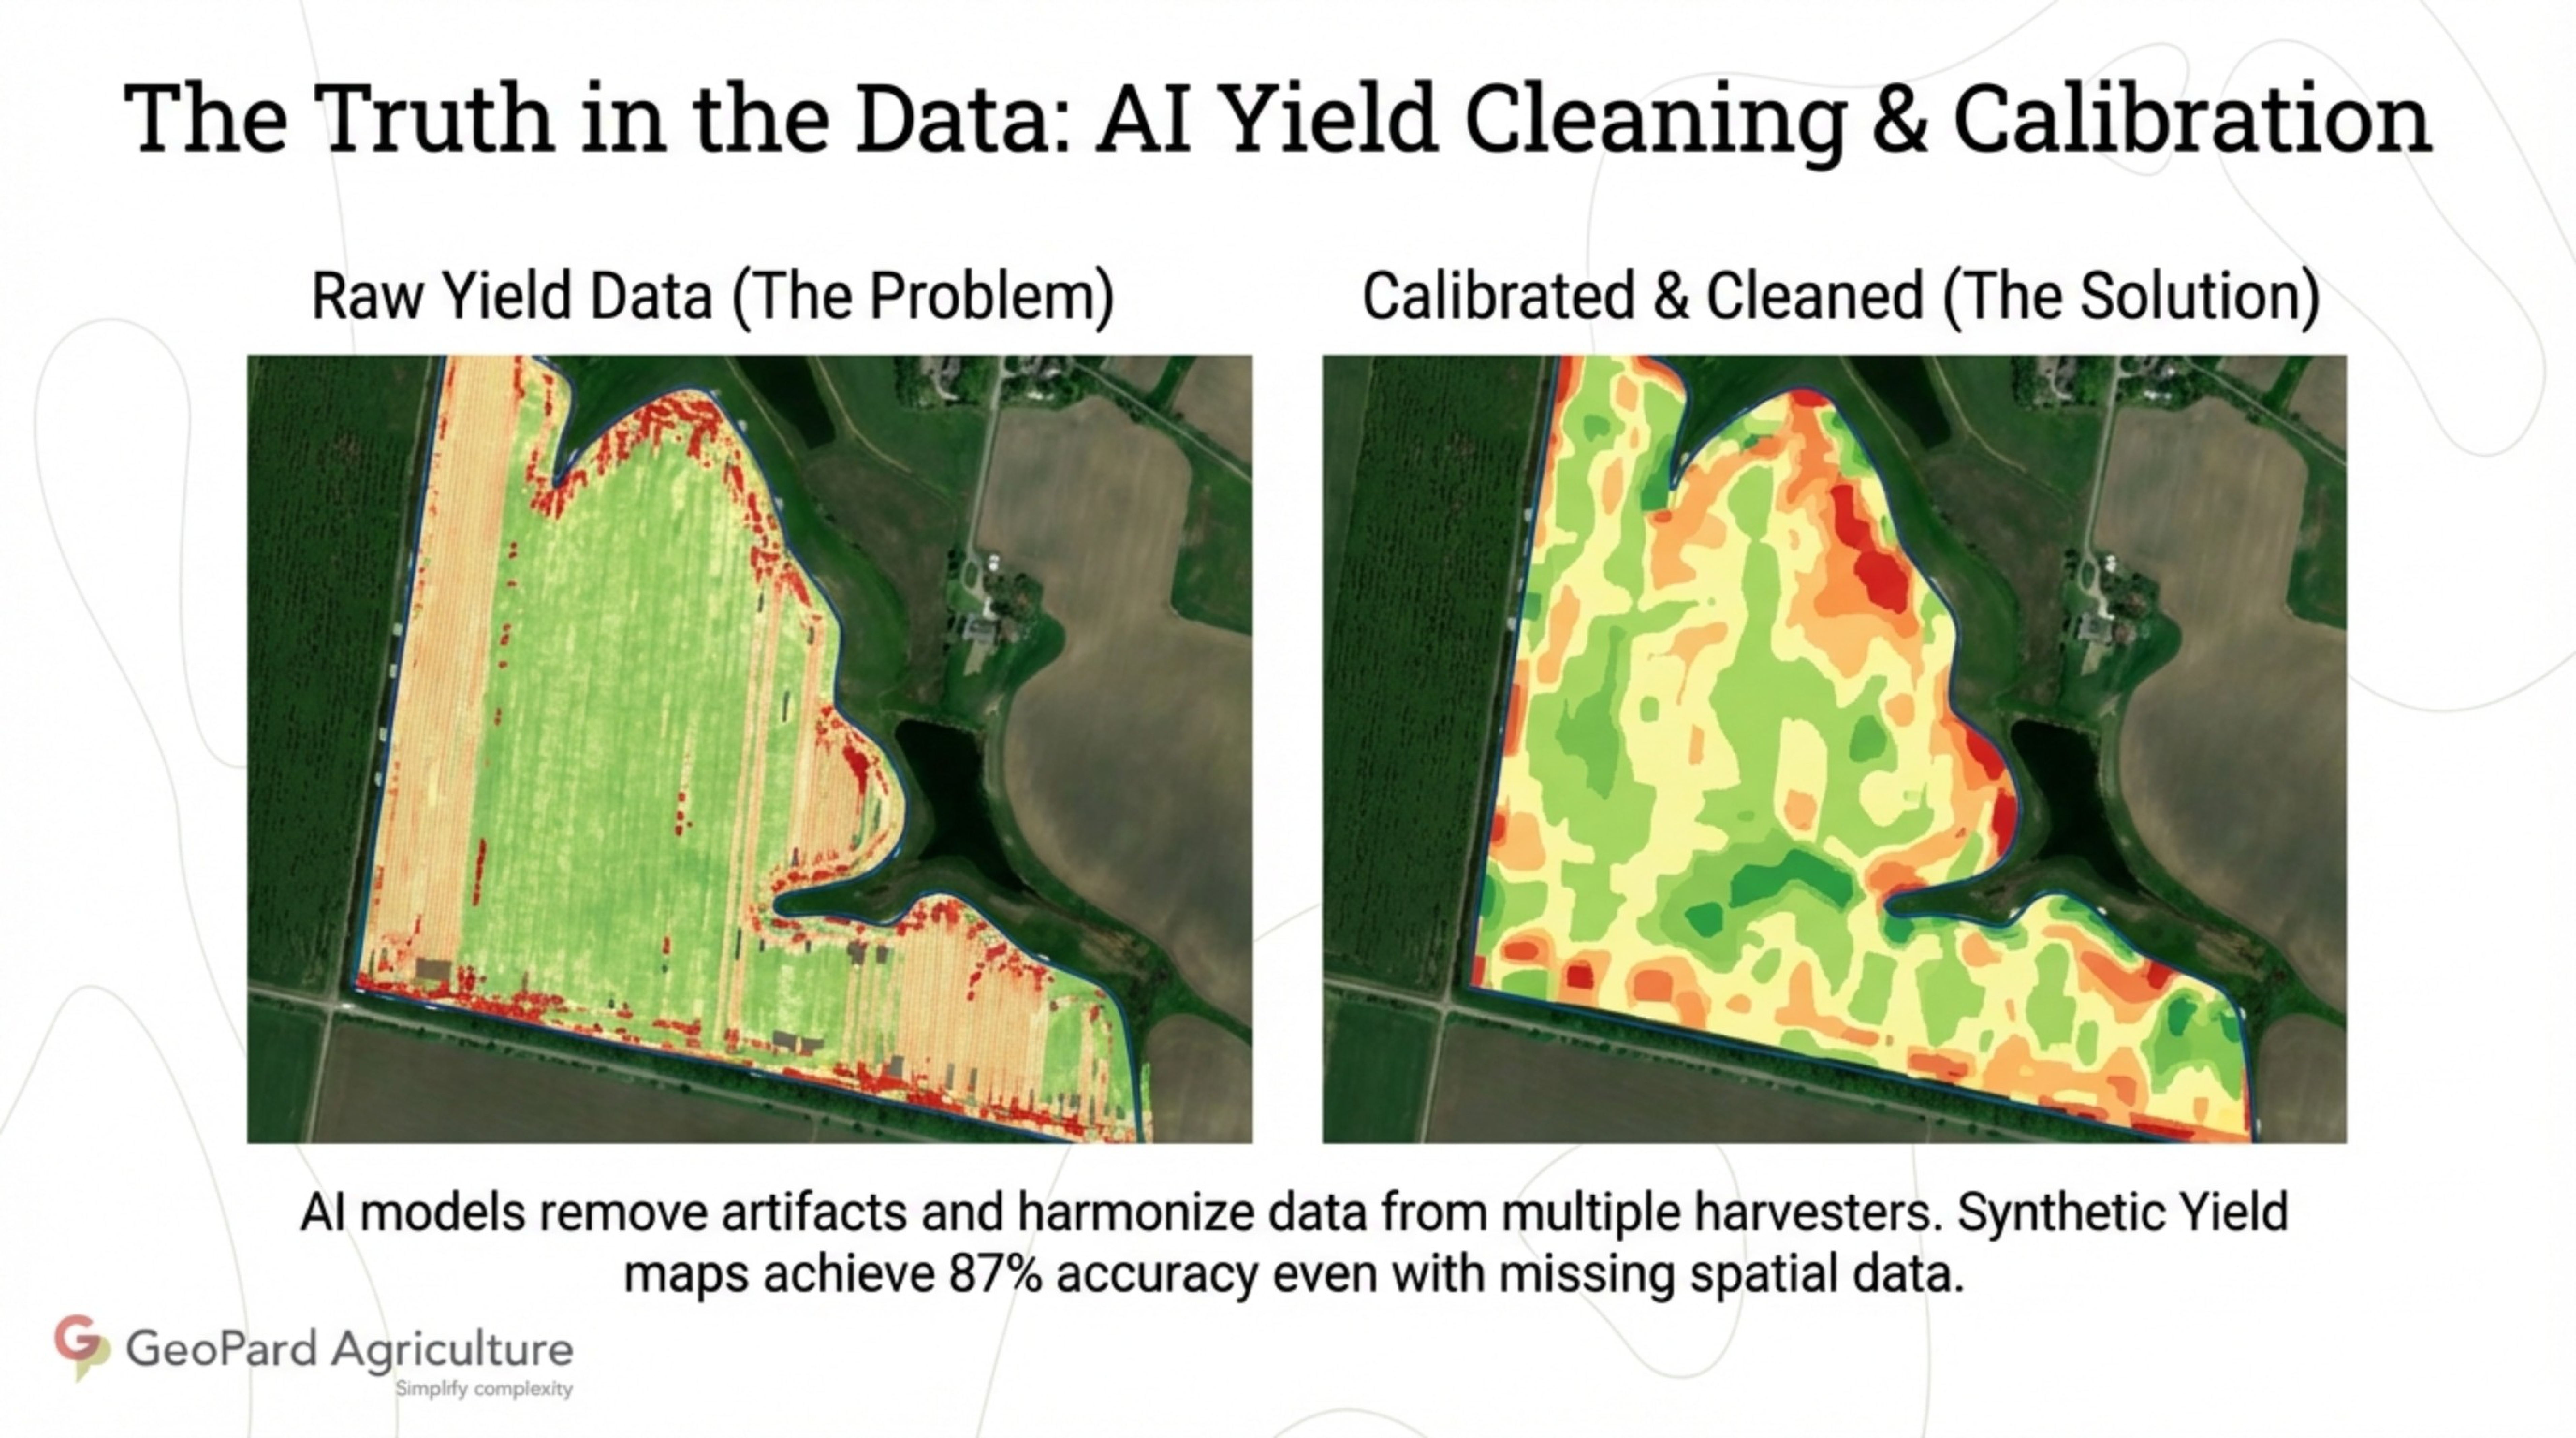
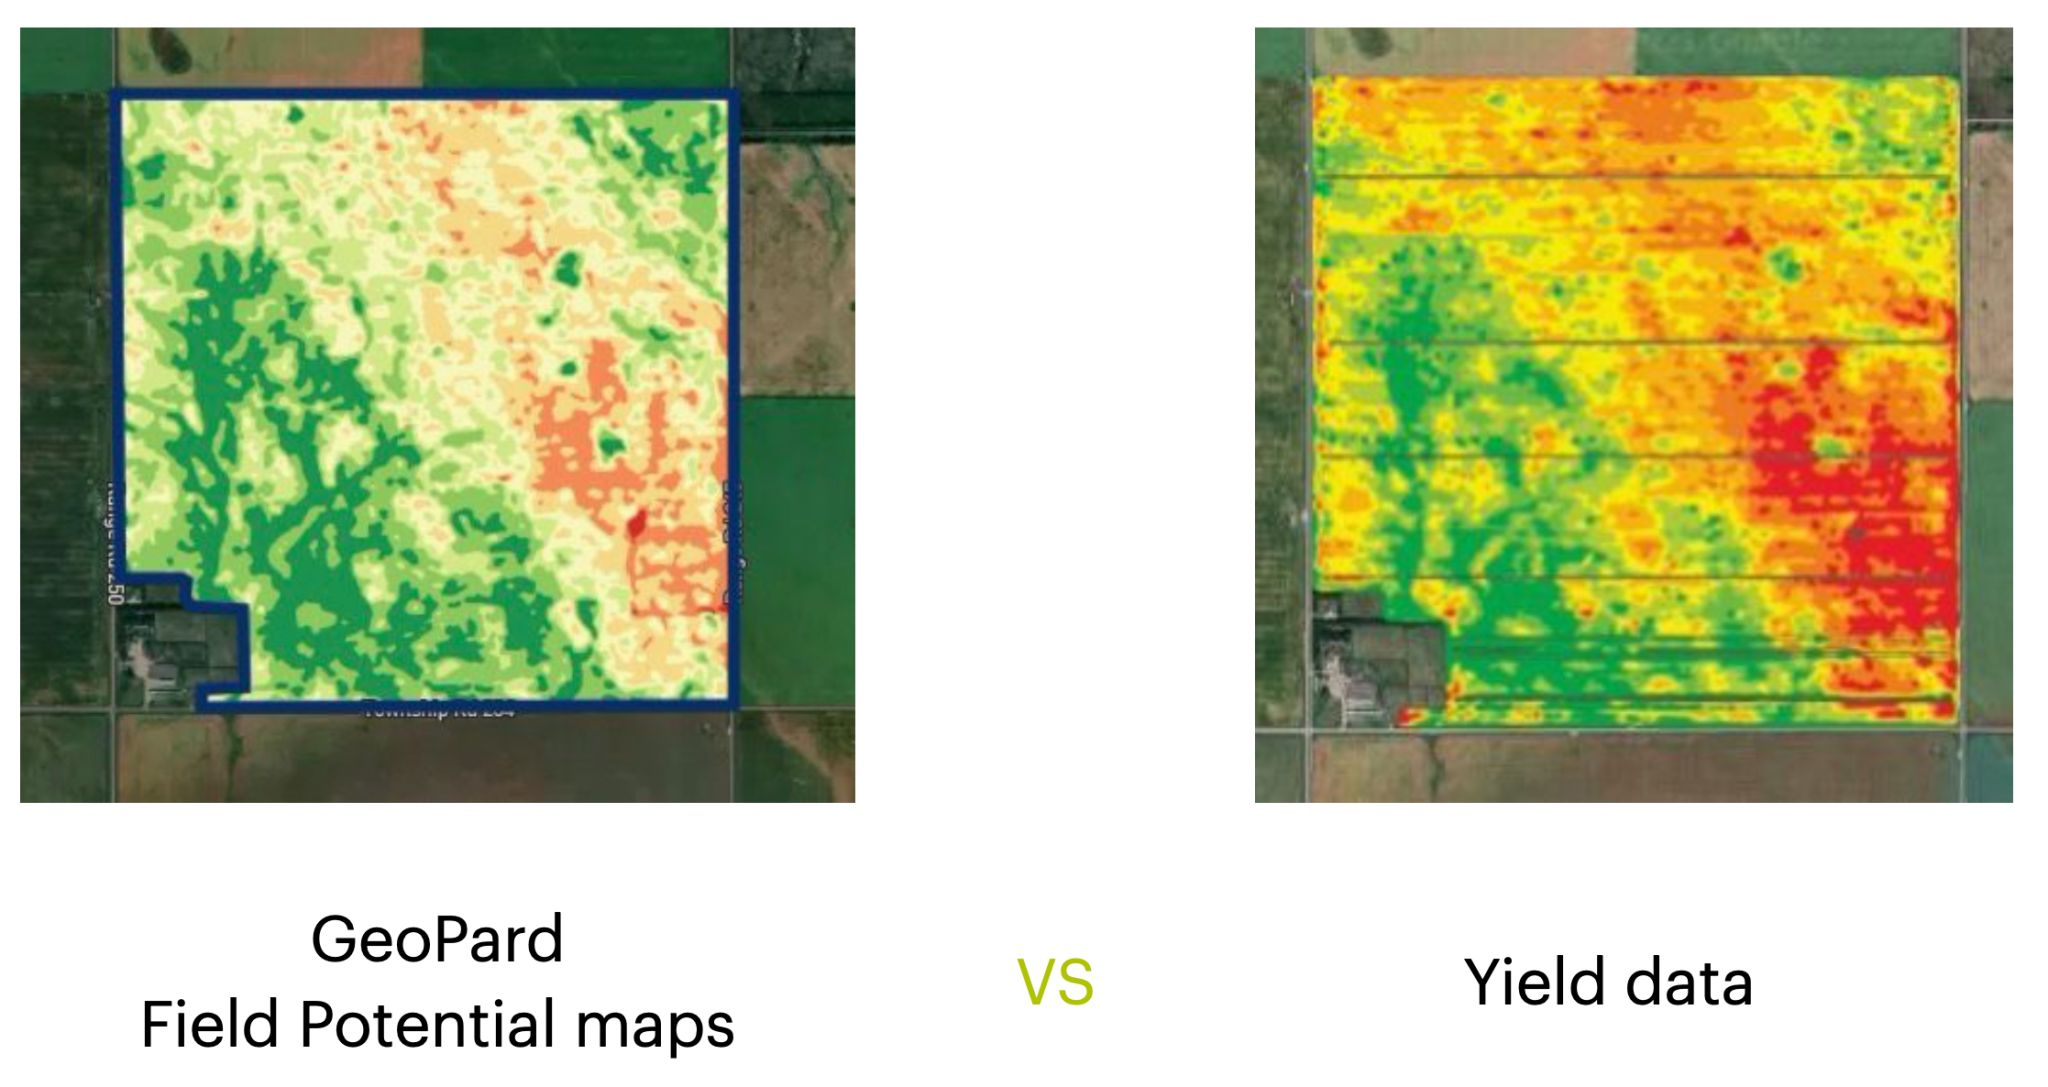
Understanding your yield data is crucial. It tells the story of your farm’s productivity. With detailed analysis, you can spot patterns and identify areas for improvement. Imagine knowing exactly which parts of your field yield best. This is the power of using analytics to break down your yield data. You can boost output where it’s needed most and reduce input where it’s not. By focusing on yield data, you can make informed decisions that directly impact your bottom line.

Soil Test Mapping Techniques

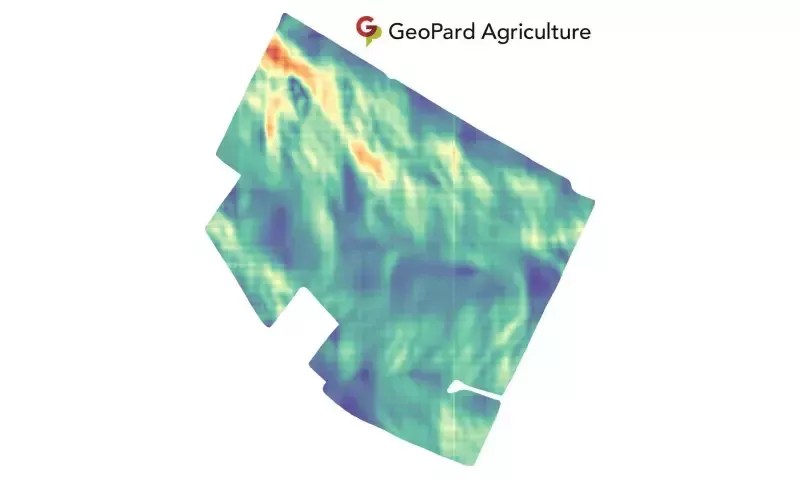
Soil is the foundation of any farm. Knowing its composition and health is vital. Soil test mapping lets you visualize nutrient levels across your fields. This helps in applying the right amount of fertilizer in the right places. By mapping soil quality, you can avoid wasting resources on areas that don’t need them. This precision saves money and supports healthier crops.

Topography and Satellite Imagery Analytics

The lay of the land affects water flow and nutrient distribution. Topography analytics provide insights into these factors. Coupled with satellite imagery, you get a bird’s-eye view of your fields. Satellite data shows changes over time, revealing trends not visible at ground level. This information helps in planning irrigation and preventing erosion, enhancing farm efficiency.

Enhancing Agronomic Decision Making

When you integrate various data sources, your agronomic decisions become more strategic. Let’s explore how this integration can refine your farming practices.

Creating Stable Management Zones

Stable management zones are the key to efficient farming. These zones are areas within a field that respond similarly to management practices. By establishing these zones, you can tailor your approach to each one. This means applying inputs like water and fertilizer more accurately. Stable zones lead to consistent results, reducing guesswork and enhancing productivity.

Variable Rate Application Maps Explained

Variable Rate Application (VRA) maps are a game-changer. They allow you to apply inputs such as seeds and fertilizers precisely where needed. VRA maps are created using data from soil tests, yield data, and topography. This precision ensures that each part of your field gets exactly what it needs. The result is less waste and better crop performance.

Benefits of AI Powered Analytics

AI transforms raw data into actionable insights. With AI, you can process complex datasets quickly and accurately. This technology identifies trends and anomalies you might miss. By leveraging AI, you optimize every decision, from planting to harvesting. The longer you wait to adopt AI, the more opportunities you miss to improve efficiency and boost ROI.

GeoPard Agriculture: Your Agtech Solution

GeoPard Agriculture offers a comprehensive platform that unifies all these capabilities. Let’s see how it supports your farming operations.

John Deere Operations Center Integration

GeoPard integrates seamlessly with John Deere Operations Center, enhancing your existing system. This integration allows for easy data flow between platforms. Your machinery data combines with GeoPard’s analytics for a complete picture of your farm’s performance. This synergy streamlines operations and improves decision-making.

ROI Analysis in Agriculture

Understanding your return on investment is crucial. GeoPard provides tools to analyze ROI across different farm operations. By examining inputs and outputs, you can identify areas to cut costs and maximize profits. This analysis is essential for long-term farm sustainability.

Start Your Free Trial Today

GeoPard Agriculture empowers you to make data-driven decisions with confidence. Unlock the potential of your fields by trying GeoPard today. With access to advanced analytics and integration capabilities, you streamline your farming operations and elevate your agronomic decision-making. Don’t wait—start your free trial now and take the first step towards precision agriculture.

Identify your biggest precision agriculture challenges and start building solutions.

Plan, Apply, Analyze: GeoPard Use Cases for VRA and Post Season ROI

Plan, Apply, Analyze: GeoPard Use Cases for VRA and Post Season ROI

Most precision agriculture tools stop short when it comes to linking pre-season planning with post-season results. You need a platform that ties your management zones and VRA maps directly to yield and ROI analysis. GeoPard Agriculture does exactly that—combining soil, satellite, and machinery data so you can plan smarter, apply precisely, and measure returns with confidence. Let’s explore workflows that put your data to work all season long. For more insights, visit our field potential and yield data analysis page.

GeoPard for Agronomic Planning

GeoPard Field Potential maps vs Yield data

GeoPard Field Potential is your start into Precision Agriculture

Stepping into the world of agronomic planning, GeoPard offers more than just data. It turns your field insights into actionable strategies.

Crafting Management Zones

Creating management zones is crucial. With GeoPard, you can use varied data layers to draw precise zones. This means you can focus your resources exactly where they’re needed. For example, using soil type and crop health data, you’ll know precisely where to increase or reduce inputs. This way, not only do you save costs, but you also boost productivity.

Imagine a farmer using satellite and soil data to craft zones. They notice a patch needing more nutrients. With GeoPard, they adjust their plan, apply the right amount, and watch the crops thrive. This precise application is how you turn data into yield. Want to learn more about creating management zones? Check out our detailed guide.

Precision Agriculture Software Tools

GeoPard’s tools offer more than just data aggregation. They provide a comprehensive look at your farm’s health. From satellite images to soil tests, you have everything at your fingertips. These tools help you plan efficiently, ensuring every seed, drop of water, and ounce of fertilizer is used wisely.

Consider the impact: A user can reduce input wastage by up to 30%. That’s real savings and real impact on your bottom line. Plus, you’re helping the environment by minimizing runoff and over-application. Ready for the next step? Explore how these tools can revolutionize your farm management in our software tools overview.

In-Season Monitoring with GeoPard

Once your plan is in place, in-season monitoring helps ensure everything stays on track. GeoPard offers intuitive tools for real-time insights.

Leveraging NDVI Satellite Imagery

NDVI satellite imagery is a game-changer. By assessing vegetation health, you can spot issues before they become costly problems. Picture this: you notice a field section with declining NDVI values. With GeoPard, you identify a pest issue and address it promptly, saving your crop.

These images update every few days, providing fresh insights into your fields. This frequency means you’re never in the dark about what’s happening on your farm. By staying informed, you make timely decisions that can save you money and maximize yield. For more on NDVI, dive into our satellite monitoring tutorials.

Crop Monitoring with Yield Data

Monitoring doesn’t stop with satellites. Yield data offers another layer of insight. Use it to track performance and make adjustments. Imagine discovering a particular seed variety outperforms others. You can pivot your strategy to focus on what works best.

With GeoPard, you can compare yields year-on-year, identifying long-term trends and making informed decisions. This level of detail is what sets successful farms apart. Curious about maximizing yield data? Visit our analytics tutorials.

Post-Season ROI Analysis

Finally, post-season analysis ties everything together. It’s where strategy meets results, and GeoPard excels in delivering clear insights.

Examining Variable Rate Applications

Evaluating your variable rate applications (VRA) helps you understand what worked and what didn’t. GeoPard provides detailed maps and reports to review application efficiency. Did varying fertilizer rates impact yield as expected? You’ll have the data to know for sure.

This analysis is not just about learning; it’s about growing better next season. By understanding the impact of your VRA decisions, you enhance future outcomes. To see how others have benefited, check out this VRA use case.

Integrating John Deere Operations Center

GeoPard’s integration with the John Deere Operations Center offers seamless data flow. This integration means you can access all your farm data in one place, simplifying management tasks. Picture managing your operations with ease, thanks to synchronized data.

The integration supports data-driven decisions, improving efficiency and boosting your ROI. With everything connected, you’re better equipped to handle challenges and seize opportunities. Learn more about this powerful integration in our John Deere Operations Center overview.

By leveraging GeoPard’s comprehensive suite of tools, you transform your approach to farming. From planning to post-season analysis, each stage is enhanced, ensuring you get the most from your fields. Don’t wait to maximize your farm’s potential—start using GeoPard today!

Learn how precise data can reveal your farm’s hidden challenges.

Automated Field Boundaries Detection Model for Precision Agriculture by GeoPard

GeoPard have completed a successful development of an automated field boundaries detection model using mutli-year satellite imagery, accurate cloud and shadow detection, and advanced proprietary algorithms, including deep neural networks.

The GeoPard field detection model has achieved a state-of-the-art accuracy of 0.975 on the Intersection over Union (IoU) metric, validated across diverse regions and crop types globally.

Check out these images to see the results in Germany (average field size is 7 hectares):

1 - Raw Sentinel-2 image

1 – Raw Sentinel-2 image

3 - Segmented field boundaries

2 – Super-resolution Sentinel-2 image by GeoPard (1 meter resolution)

2 - Super-resolution Sentinel-2 image by GeoPard

3 – Segmented field boundaries, 0.975 Intersection over union (IoU) accuracy metric, across multiple international regions and crop types.


Integration into our API and GeoPard application is coming soon. This automated and cost-effective method helps predict yields, benefits governmental organizations, and assists large landowners who often need to update field boundaries between seasons.

GeoPard’s approach utilizes multi-year crop vegetation trends using multi-factor analysis and crop rotation.


The model is accessible via the GeoPard API on a pay-as-you-go basis, offering flexibility without the need for costly subscriptions.


What is Field Boundaries Delineation?

Field boundaries delineation refers to the process of identifying and mapping the boundary of agricultural fields or parcels of land. It involves using various techniques and data sources to demarcate the limits of individual fields or agricultural plots.

Traditionally, field boundaries were delineated manually by farmers or landowners based on their knowledge and observations.

However, with advancements in technology, particularly in remote sensing and geographic information systems (GIS), automated and semi-automated methods have become increasingly prevalent.

One common approach is the analysis of satellite or aerial imagery. High-resolution images captured by satellites or aircraft can provide detailed information about the landscape, including the boundaries between different land parcels.

Image processing algorithms can be applied to these images to detect distinct features such as changes in vegetation type, color, texture, or patterns that indicate the presence of field boundaries.

Another technique involves using LiDAR (Light Detection and Ranging) data, which uses laser beams to measure the distance between the sensor and the Earth’s surface.

LiDAR data can provide detailed elevation and topographic information, allowing for the identification of subtle variations in terrain that may correspond to field boundaries.

Additionally, geographic information systems (GIS) play a crucial role in delineation of field boundaries.

GIS software allows for the integration and analysis of various data layers, including satellite imagery, topographic maps, land ownership records, and other relevant information. By combining these data sources, GIS can aid in the interpretation and identification of field boundaries.

The accurate delineation of field is essential for several reasons. It facilitates better management of agricultural resources, enables precision farming techniques, and supports the planning and implementation of agricultural practices such as irrigation, fertilization, and pest control.

Accurate field boundary data also assists in land administration, land-use planning, and compliance with agricultural regulations.

How it is useful?

It plays a crucial role in agriculture and land management, providing several benefits and importance supported by evidence and global figures. Here are some key points:

1. Precision Agriculture: Accurate field boundaries help in implementing precision agriculture techniques, where resources such as water, fertilizers, and pesticides are precisely targeted to specific areas within fields.

According to a report by the World Bank, precision agriculture technologies have the potential to increase crop yields by 20% and reduce input costs by 10-20%.

2. Efficient Resource Management: It enables farmers to better manage resources by optimizing irrigation systems, adjusting fertilization practices, and monitoring crop health. This precision reduces resource wastage and environmental impact.

The Food and Agriculture Organization (FAO) estimates that precision agriculture practices can reduce water usage by 20-50%, decrease fertilizer consumption by 10-20%, and reduce pesticide usage by 20-30%.

3. Land Use Planning: Accurate field boundary data is essential for land use planning, ensuring efficient utilization of available agricultural land. It allows policymakers and land managers to make informed decisions regarding land allocation, crop rotation, and zoning.

This can lead to increased agricultural productivity and improved food security. A study published in the Journal of Soil and Water Conservation found that effective land use planning could increase global food production by 20-67%.

4. Farm Subsidies and Insurance: Many countries provide agricultural subsidies and insurance programs based on field boundaries. Accurate delineation helps in determining eligible land areas, ensuring fair distribution of subsidies, and calculating insurance premiums accurately.

For instance, the European Union’s Common Agricultural Policy (CAP) relies on accurate field boundaries for subsidy calculations and compliance monitoring.

5. Land Administration and Legal Boundaries: Field boundaries delineation in agriculture is crucial for land administration, property rights, and resolving land disputes. Accurate maps of field boundaries help establish legal ownership, support land registration systems, and facilitate transparent land transactions.

The World Bank estimates that only 30% of the world’s population has legally documented rights to their land, highlighting the importance of reliable field boundary data for secure land tenure.

6. Compliance and Environmental Sustainability: Accurate field boundaries aid in compliance monitoring, ensuring adherence to environmental regulations and sustainable farming practices.

It helps identify buffer zones, protected areas, and areas prone to erosion or water contamination, enabling farmers to take appropriate measures. Compliance with environmental standards enhances sustainability and reduces negative impacts on ecosystems.

According to the FAO, sustainable farming practices can mitigate up to 6 billion tons of greenhouse gas emissions annually.

These points illustrate its usefulness and importance in agriculture and land management. The evidence and global figures presented support the positive impacts it can have on resource efficiency, land use planning, legal frameworks, environmental sustainability, and overall agricultural productivity.

In summary, field boundaries delineation in agriculture is the process of identifying and mapping the boundary of agricultural fields or parcels of land. It relies on various techniques such as satellite imagery analysis, LiDAR data, and GIS to accurately define and demarcate these boundaries, enabling effective land management and agricultural practices.

Vegetation Indices and Chlorophyll Content

GeoPard extends the family of supported chlorophyll-linked vegetation indices with

  • Canopy Chlorophyll Content Index (CCCI)
  • Modified Chlorophyll Absorption Ratio Index (MCARI)
  • Transformed Chlorophyll Absorption in Reflectance Index (TCARI)
  • ratio MCARI/OSAVI
  • ratio TCARI/OSAVI

They help to understand the current crop development stage including

  • identification of the areas with nutrient demand,
  • estimation of the nitrogen removal,
  • potential yield evaluation,

And the insights are used for precise Nitrogen Variable Rate Application maps creation.


Read More: Which index is the best to use in the precisionAg

Read More: GeoPard vegetation indices


Vegetation Indices and Chlorophyll Content
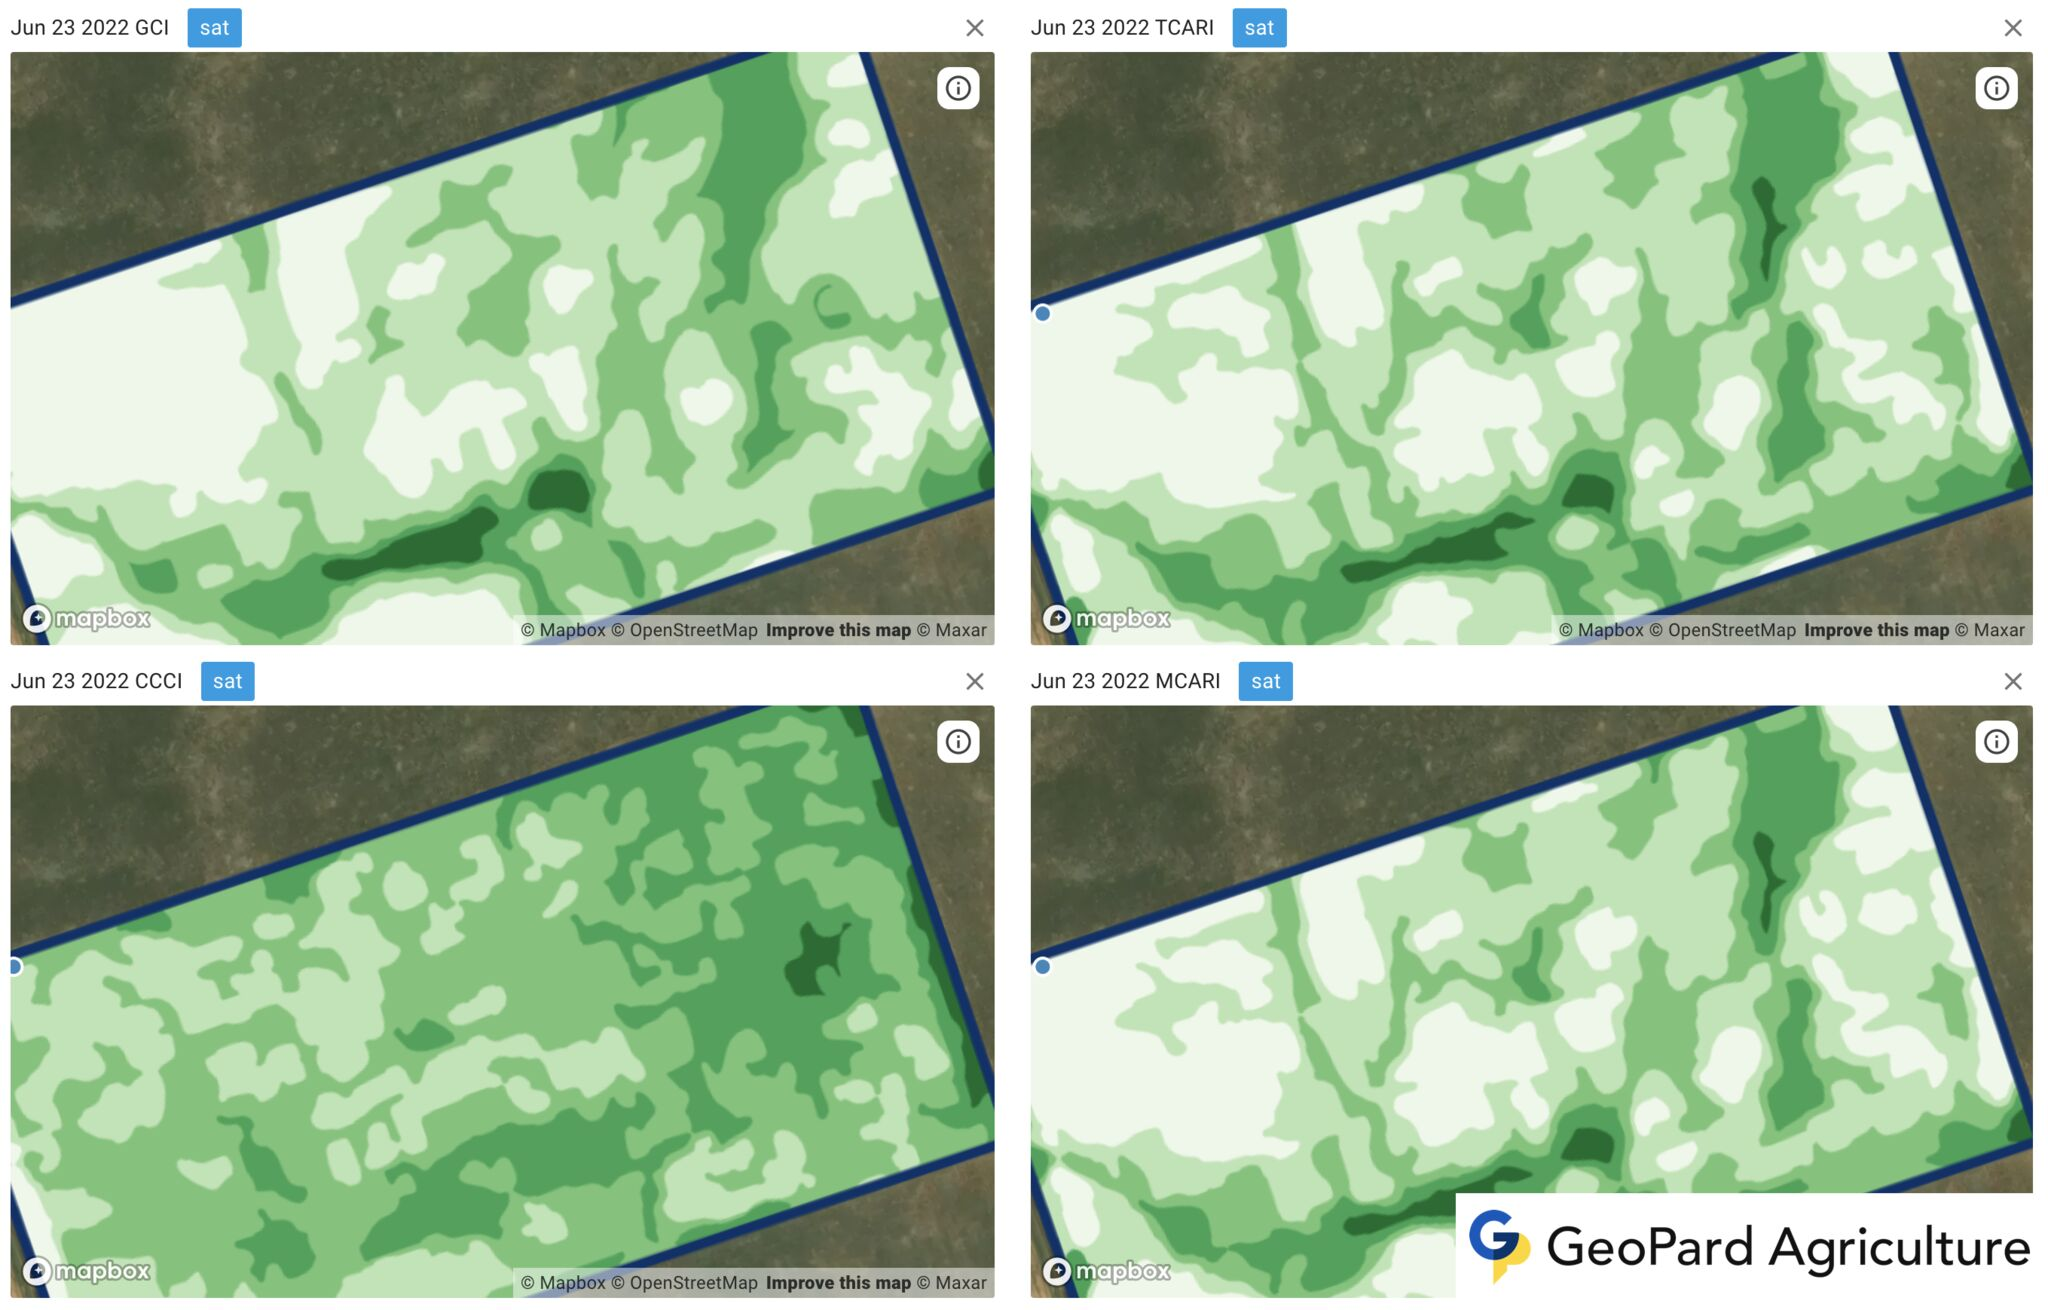
Canopy Chlorophyll Content Index (CCCI) vs Modified Chlorophyll Absorption Ratio Index (MCARI) vs Transformed Chlorophyll Absorption in Reflectance Index (TCARI) vs Ratio MCARI/OSAVI

What is Vegetation Indices?

Vegetation indices are numerical values derived from remotely sensed spectral data, such as satellite or aerial imagery, to quantify the density, health, and distribution of plant life on the Earth’s surface.

They are commonly used in remote sensing, agriculture, environmental monitoring, and land management applications to assess and monitor vegetation growth, productivity, and health.

These indices are calculated using the reflectance values of different wavelengths of light, particularly in the red, near-infrared (NIR), and sometimes other bands.

The reflectance properties of vegetation vary with different wavelengths of light, allowing for the differentiation between vegetation and other land cover types.

Vegetation typically has strong absorption in the red region and high reflectance in the NIR region due to chlorophyll and cell structure characteristics.

Some widely used vegetation indices include:

  • Normalized Difference Vegetation Index (NDVI): It is the most popular and widely used vegetation index, calculated as (NIR – Red) / (NIR + Red). NDVI values range from -1 to 1, with higher values indicating healthier and denser vegetation.
  • Enhanced Vegetation Index (EVI): This index improves upon NDVI by reducing atmospheric and soil noise, as well as correcting for canopy background signals. It uses additional bands, such as blue, and incorporates coefficients to minimize these effects.
  • Soil-Adjusted Vegetation Index (SAVI): SAVI is designed to minimize the influence of soil brightness on the vegetation index. It introduces a soil brightness correction factor, enabling more accurate vegetation assessments in areas with sparse or low vegetation cover.
  • Green-Red Vegetation Index (GRVI): GRVI is another simple ratio index that uses the green and red bands to assess vegetation health. It is calculated as (Green – Red) / (Green + Red).

These indices, among others, are used by researchers, land managers, and policymakers to make informed decisions regarding land use, agriculture, forestry, natural resource management, and environmental monitoring.

Normalized Difference Moisture Index

The number of vegetation indices supported by GeoPard is continuously growing. GeoPard team introduces the Normalized Difference Moisture Index (NDMI). The index determines vegetation water content and normalized difference water index (NDWI). It is useful for finding the spots with existing water stress in plants.

Lower NDMI values mark the spots where the plants are under stress from insufficient moisture.
On the other side, lower normalized difference water index values following the vegetation peak highlight the spots that are becoming ready for harvesting first.

The difference of the vegetation relative water content between two satellite images (Sentinel-2 constellation in this case)

The difference of the vegetation relative water content between two satellite images (Sentinel-2 constellation in this case)

In the following screenshots, you can find the NDMI zones generated based on June 19 (vegetation peak) and July 6 satellite images and the equation map representing the NDMI difference.

Normalized Difference Moisture Index calculated on top of Planet / Sentinel-2 / Landsat imageNDMI calculated on top of Planet / Sentinel-2 / Landsat image

What is Moisture Index?

It is a measure or calculation used to assess the moisture content or availability in a specific area or region. It is typically derived from various environmental factors such as precipitation, evapotranspiration, soil properties, and vegetation cover.

It provides a relative indication of the wetness or dryness of an area, helping to identify potential water stress or drought conditions.

It is a valuable tool for monitoring and managing water resources, agricultural planning, and understanding the ecological conditions of a particular region.

What is Normalized Difference Moisture Index?

Normalized Difference Moisture Index (NDMI) is a vegetation index derived from remote sensing data to assess and monitor the moisture content of vegetation. Like other vegetation indices, it is computed using spectral reflectance values from satellite or aerial imagery.

It is particularly useful in monitoring plant water stress, assessing drought conditions, estimating fire risk, and studying the impacts of climate change on vegetation.

It is calculated using the Near-Infrared (NIR) and Shortwave Infrared (SWIR) bands, which are sensitive to the moisture content in vegetation. The formula for NDMI is:

NDMI = (NIR – SWIR) / (NIR + SWIR)

NDWI values typically range from -1 to 1, with higher values indicating higher vegetation moisture content and lower values indicating lower moisture content or water stress in the vegetation. Negative NDMI values can be associated with non-vegetated areas or areas with very low moisture content.

What is NDWI?

NDWI, or Normalized Difference Water Index, is a remote sensing index used to quantify and assess water content or water-related features in vegetation or landscapes.

It is calculated by analyzing the reflectance of near-infrared and green light bands from satellite or aerial imagery. It is particularly useful for identifying water bodies, monitoring changes in water availability, and assessing vegetation health.

By comparing the absorption and reflection of different wavelengths, it provides valuable information for applications such as drought monitoring, hydrological analysis, and ecosystem management.

Visualization of NDMI to Determine Normalized Difference Water Index

Visualizing the NDMI involves processing satellite or aerial imagery, calculating the NDMI values, and then displaying the results as a color-coded map or image. Here are the general steps to visualize NDMI:

  • Acquire satellite or aerial imagery: Obtain multispectral imagery from a satellite or aerial platform, such as Landsat, Sentinel, or MODIS. Ensure that the imagery includes the necessary bands: Near-Infrared (NIR) and Shortwave Infrared (SWIR).
  • Pre-process the imagery: Depending on the data source, you may need to preprocess the imagery to correct for atmospheric, geometric, and radiometric distortions. Convert the digital numbers (DN) in the image to spectral reflectance values.
  • Calculate NDMI: For each pixel in the image, use the NIR and SWIR reflectance values to compute the NDMI using the formula: NDMI = (NIR – SWIR) / (NIR + SWIR).
  • Color mapping: Assign a color palette to the NDMI values. Typically, a continuous color scale is used, ranging from one color (e.g., red) for low NDMI values (indicating low moisture content) to another color (e.g., green) for high NDMI values (indicating high moisture content). You can use software like QGIS, ArcGIS, or programming libraries like Python’s Rasterio and Matplotlib to create a color map.
  • Visualize the NDMI map: Display the NDMI map or image using GIS software, a programming library, or an online platform. This will allow you to analyze the spatial distribution of vegetation moisture content and identify areas of water stress or high moisture.
  • Interpretation and analysis: Use the NDWI visualization to assess vegetation health, monitor drought conditions, or evaluate fire risk. You can also compare normalized difference water index maps from different time periods to analyze changes in vegetation moisture content over time.

Remember that different software tools or programming libraries may have slightly different workflows, but the overall process will be similar. Additionally, you can overlay other data layers, such as land use, elevation, or administrative boundaries, to enhance your analysis and better understand the relationships between vegetation moisture content and other factors. 

Automated Crop Scouting with Intersection of Data Layers

In GeoPard we have a module to create crop data scouting zones Automatically using flexible configuration of business and agronomic logic.

It allows to control huge amount of fields and do scouting only when emergency case happened.

Business/agronomic logic could be flexible. In this example – Tasks are created in the areas where we have High Historical Field Potential Zones and Low vegetation on the latest satellite imagery.

An example of another use-case: Low Yield zone (from yield file) Intersected with Low pH zones – to adjust lime fertility levels.


Automated Crop data Scouting zones with the Intersection of Data Layers
High Historical Field Productivity zones intersected with the latest Planet image low vegetation Zones -> Scouting tasks are created automatically in GeoPard

For crop trading companies and data modelers intersection between Historically most stable and High yield zones could be a good indicator to extrapolate Yield predictions.

If you’re a farmer, agronomist, or precision agriculture specialist, you know the importance of crop data scouting. It’s essential for monitoring the health of your crops and identifying any potential issues before they become major problems.

However, traditional crop scouting can be time-consuming and labor-intensive. That’s where automated scouting tasks come in.

GeoPard is a revolutionary automated precision agriculture software that uses advanced algorithms and satellite imagery to automatically monitor your crops. With GeoPard, you can easily set up automated scouting tasks that will alert you to any potential issues, such as pests, diseases, or nutrient deficiencies.

One of the key benefits of using automated scouting tasks is the ability to quickly and accurately identify issues in your crops. GeoPard uses advanced algorithms to analyze the satellite imagery of your fields, detecting even the smallest changes in your crops.

This means you can quickly identify any potential problems and take action to address them before they become more serious.

Another advantage of automated scouting tasks is the ability to monitor your crops on a regular basis. With traditional scouting, it can be difficult to regularly visit your fields and check for potential issues.

But with GeoPard, you can set up automated tasks that will monitor your crops on a daily or weekly basis, giving you a more comprehensive view of their health.

GeoPard’s automated scouting tasks are also customizable, allowing you to tailor them to your specific needs. You can set up tasks to monitor for specific issues, such as pests or diseases, or set up tasks to monitor specific areas of your field. This means you can get the information you need to make informed decisions about your crops.

In addition to its automated scouting tasks, GeoPard also offers a range of other features that can help you manage your precision agriculture operations. You can use GeoPard to plan your planting and fertilization, monitor soil moisture levels, and track your yield.

Overall, GeoPard’s automated scouting tasks are a powerful tool for farmers, agronomists, and precision agriculture specialists. With GeoPard, you can quickly and easily monitor your crops and identify potential issues, helping you make better decisions about your operations.

What is Crop Scouting?

Crop scouting is a practice in agriculture that involves systematically inspecting and monitoring crops to assess their health, growth, and potential issues. It typically involves physically walking through fields or utilizing technology such as drones or sensors to gather data.

Crop scouts observe and collect information on factors like pest infestations, disease outbreaks, nutrient deficiencies, and weed pressure.

This data helps farmers make informed decisions regarding crop management, such as implementing targeted treatments, adjusting fertilizer applications, or implementing pest control strategies. It plays a crucial role in maximizing crop yields and ensuring overall crop health.

What is Automated Crop Data Scouting?

Automated crop scouting refers to the application of cutting-edge technologies, including robotics, unmanned aerial vehicles (UAVs), various sensors, and artificial intelligence (AI), to observe and evaluate crop health and development in an agricultural environment.

The goal is to enhance effectiveness, lower expenses, and streamline crop management by automating tasks traditionally performed by human crop scouts.

The process of automated crop data scouting entails several stages, such as:

  • Gathering data: UAVs or terrestrial robots fitted with a range of sensors (e.g., cameras, multispectral sensors, LIDAR) acquire information on crop conditions, encompassing plant health, pest and disease occurrence, soil properties, and nutrient concentrations.
  • Analyzing data: The gathered data is subsequently processed and examined using AI and machine learning algorithms to detect patterns, irregularities, and tendencies related to crop health and development.
  • Making decisions: The data analysis results can be utilized to make informed choices about crop management, including optimizing watering, fertilization, pest management, and other interventions.
  • Taking action: Farmers can implement targeted measures based on the knowledge acquired from automated crop monitoring to address specific problems in the field, such as applying pesticides or nutrients solely where required, minimizing waste and environmental impact.

By providing farmers with real-time, accurate data, it can significantly enhance agricultural productivity and sustainability, allowing for better decision-making and the implementation of more precise management techniques.

How to Identify Scouting Zone?

Determining crop data scouting zones involve dividing a farm field into smaller, manageable sections based on aspects such as soil composition, terrain, historical crop outcomes, or other pertinent factors.

The objective is to establish uniform areas representing similar conditions, enabling more focused scouting, observation, and management practices. Here’s a step-by-step method to pinpoint crop scouting zone:

  • Collect historical information: Compile data on previous crop yields, soil analysis results, occurrences of pests and diseases, and any other significant information for the field. This data can help recognize areas with comparable conditions or performance.
  • Examine soil composition and terrain: Investigate the soil types and terrain of your field to comprehend natural variations. Different soil compositions and elevation levels can influence crop growth, nutrient absorption, and water accessibility, which in turn affects crop health.
  • Utilize remote sensing technology: Use satellite or drone-based imagery to obtain additional details on field conditions, such as vegetation indices, soil moisture levels, and temperature variations. This information can help fine-tune scouting zones by providing a more comprehensive view of the field.
  • Implement precision agriculture techniques: Use precision agriculture software to process and analyze the gathered data. These tools can help identify patterns and establish data-driven scouting areas, considering factors like crop health, soil variability, and terrain.
  • Establish scouting areas: Based on the data analysis, segment the field into smaller, uniform areas that display similar traits. These areas should be manageable in size and adapted to the specific requirements of your operation.
  • Update and adjust regularly: As circumstances change and new data becomes available, reassess and modify the scouting areas to ensure they remain relevant and precise. This may involve updating the areas based on new yield data, occurrences of pests and diseases, or other factors that influence crop performance.

Hence, by pinpointing and creating crop scouting zone, farmers can concentrate their monitoring efforts more efficiently and apply targeted management practices, resulting in better resource usage and improved crop health.

Normalized Difference Vegetation Index (NDVI) Make Farmer Life Easier

Normalized Difference Vegetation Index (NDVI) is a commonly used metric to quantify the density and health of vegetation. Its values range from -1 to 1, with negative values indicating water or bare soil, values near zero indicating sparse vegetation, and higher values indicating denser and healthier vegetation.

What is Normalized Difference Vegetation Index (NDVI)?

It is a method that calculates the variation between the quantity of red light received by vegetation and the quantity of near-infrared light that is strenuously reflected by vegetation.

The objective of this method is to provide a quantitative analysis of the state of plant life. There is no situation in which the its value falls outside of the spectrum of -1 to +1. However, there isn’t a clear demarcation between the many types of land cover that may be found.

If the sum of the figures comes out to be less than zero, it is quite probable that the substance in question is water. If you obtain an NDVI score that’s quite near to a positive one, there’s a good chance that it’s just a bunch of tightly packed green leaves. This is especially true if the leaves are densely packed together.

Green leaves have a greater value than red leaves do, which is why this is the case. Imagine for a moment that the it is very close to being equal to 0.

In such a situation, there is hardly a snowball’s chance in hell that any leaves of any type are still there, and the region may even be urbanized by this point. The Normalized Difference Vegetation Indicator is the index that is used by analysts in the area of remote sensing the majority of the time.

Why is Normalized Difference Vegetation Index useful?

There are a lot of different vegetation indices, and the vast majority are comparable to one another. However, it is the one that is used the most often and widely, and it also has an essential benefit, which is a high resolution of pictures that are derived from satellite data.

In the circumstances like this, channels with a resolution of ten meters may be utilized to determine the NDVI. Remember that one pixel is equal to ten by ten meters. On the other hand, the index’s resolution that uses extra light channels, namely red age, might be twenty meters, where one pixel is equal to twenty by twenty meters.

How is the NDVI calculated?

It may be determined using the following straightforward mathematical procedure, which converts raw satellite information into vegetation indices.

Normalized Difference Vegetation Index formula

The equation creates a single number that is representative and integrates the information that is accessible in the red and NIR (near-infrared) bands.

To do this, it takes the reflectance throughout the red spectral band and subtracts it from the reflectance throughout the NIR band. After that, the result is divided by the total reflectance of the NIR and red wavelengths.

The assessment of the NDVI will never be more than a positive one and less than a negative one. In addition, a number between -1 and 0 denotes a plant that has died and inorganic items like stones, roads, and buildings.

Simultaneously, its values for living plants may vary anywhere from 0 to 1, with 1 representing the healthiest plant and 0 representing the unhealthiest plant. It is possible to assign a single value to each pixel in a picture, whether that pixel represents a single leaf or a wheat field that spans 500 acres.

How do we use Normalized Difference Vegetation Index?

Justifiably, it is now being utilized in a number of different fields of research. For instance, it is leveraged in the field of agriculture for the objectives of precision farming and the evaluation of biomass. It is likewise employed by foresters in order to evaluate forest resources as well as the leaf area index (LAI).

In addition, NASA believes it to be a reliable indication of the existence of drought conditions. The proportional NDVI and the concentration of vegetation are both lower in areas where water serves as a barrier to the establishment of vegetation.

This is because water prevents the roots of plants from growing deeper into the soil. It, including other kinds of remote sensing, has the capability to be utilized in a wide variety of distinct ways in reality.

What can NDVI tell us about plants?

It is essential to have a solid comprehension that the Normalized Difference Vegetation Index is only an indication of the healthiness of the plant and provides no information about the reasons behind a certain condition.

The vegetation index is more of an expression than a direct reflection of what is occurring on the field. Let’s look at three applications of NDVI for field analysis:

When a new season begins

It is beneficial for understanding the plant’s winter hardiness and how it managed to survive.

  • If its value is less than 0.15, it is somewhat likely that all of the plants in this field section have perished. Typically, these numbers relate to the tilled soil without any plants.
  • Another example of a low number is 0.15-0.2. It might suggest that the plants began preparing for winter during the early phenological period, before the tilling stage.
  • A result in the range of 0.2 to 0.3 is satisfactory. The plants most likely progressed to the tilling stage and have regained their vegetative state.0.3−
  • 0.5 is a decent value. However, it is important to remember that higher NDVI readings suggest that plants overwintered at a later phenological stage. Suppose the satellite picture was captured before the vegetation resumed its normal state. In that case, analyzing the area after the vegetation continued its normal form is important.
  • A number greater than 0.5 indicates an anomaly during the post-wintering phase. It is recommended that you check out this field zone.

To recap, if you notice that the Values obtained are significantly different from the norm, you need to conduct an inspection of the relevant portion of the field. A large departure from the norm is required for values to be categorized as abnormal in a given area.

When the season is in the middle

Utilizing the index might be helpful in gaining a better understanding of how plants develop. Imagine that the readings fall between mild and high (0.5-0.85). It is highly likely that this particular part of the area does not face any major challenges at the present time.

If the index remains lower than it should be, there may be issues such as a deficiency of soil water or nutrients. However, you need to do your own investigation into this particular area.

We generate maps for variable-rate application (VRA) of nitrogen by using the Normalized Difference Vegetation Index. We identify regions with vegetation indices ranging from low to high.

After that, it is up to the individual farmer to determine the amount of necessary fertilizer. The following is the most effective method for applying nitrogen:

  • Suppose the vegetation index for the region is high. In that case, the recommended dosage of fertilizer should be decreased to 10 and 30 percent of the typical rate.
  • If the vegetation index is around average, the recommended dosage of fertilizer should be raised to between 20 and 25 percent of the typical amount.
  • If the vegetation index is low, you first need to figure out why it is that way.

To reconstruct a field’s agricultural yield, we also use this index. With this data, we produce maps that may be used for the variable-rate application of potassium and phosphate fertilizers.

When the season is over

The NDVI index is a useful tool for determining whether fields are ready to be harvested; the lower the index, the more closely a portion of the area is approaching the stage when it is ready to be harvested. In this scenario, a value for the index lower than 0.25 would be ideal.

NDVI index is a useful tool for determining whether fields are ready to be harvested

To begin, it is a mathematical computation performed pixel-by-pixel on an image utilizing tools from a GIS (Geographic Information System). Calculated by contrasting the amounts of red and near-infrared light absorbed and reflected by the plant, it measures the plant’s overall state of health.

The Normalized Difference Vegetation Index may be used to study land all over the globe, making it ideal for focused field studies and national or global vegetation monitoring.

By means of utilizing NDVI, we can get an immediate analysis of fields, enabling agriculturalists to optimize the production potential of areas, limit their influence on the environment, and modify their precision agricultural operations.

Moreover, examining it in conjunction with other data streams, such as those about the weather, might provide further insight into recurring patterns of droughts, freezes, or floods and how they impact vegetation.


Frequently Asked Questions


1. What is NDVI primarily used to determine?

It is primarily used to determine the health and density of vegetation in a given area. This index is widely used in agriculture, forestry, and ecology to monitor vegetation growth, assess plant stress levels, identify areas of drought or disease, and aid in crop management decisions.

2. How to read NDVI imagery?

To read NDVI imagery, you can interpret the color scale associated with the index values. Typically, healthy vegetation appears green, while less healthy or sparse vegetation appears yellow or red.

Darker shades may indicate areas with high biomass, while lighter shades may suggest lower vegetation density or the presence of bare soil.

Understanding the context of the area being analyzed, such as the specific crop type or environmental conditions, can further assist in interpreting NDVI imagery and making informed decisions about agricultural practices.

Farm/Crop Yield Data Monitoring and Calculation in Agriculture

In agriculture, yield mapping is a method that uses GPS data to assess factors, including farm/crop yield and moisture levels in a particular field. It may also be referred to as yield monitoring.

It was created in the 1990s and used a mix of GPS and tangible sensors such as speedometers to monitor farm yields, grain elevator performance, and combine speed all at the same time.

Meanwhile, monitors of yield are a vital component of many different site-specific management strategies. Yield maps, also known as yield monitors’ visual and analytical outcomes, inspire innovative research and may offer trustworthy answers to properly executed on-farm experiments.

Yield monitors (also known as yield gages) measure the amount of crop produced. The feedback provided by yield maps allows for determining the impacts of controlled inputs like fertilizer & lime, seed & pesticides, and artistic techniques like tillage, irrigation, and drainage.

When utilized in conjunction with a combine that is also fitted with a differentially-corrected global positioning system (DGPS) receiver, a yield monitor is at its most effective.

The yield monitor data system concurrently records yield, grain moisture, and position data. These are the fundamental crop yield data that are required to make yield maps.

A yield map will include a variety of colors and shades, and each one will reflect a diverse range of productivity or crop production. Yield maps help gain a more excellent knowledge of the magnitude and position of yield variability within a field.

Investigating the qualities of the soil and the field’s other aspects should be done since there are patterns of variability. “Yield maps validate the recollections that you should have had” is a phrase that has been repeated several times.

What is Yield in Agriculture?

The quantity of seeds or grains that may be harvested from a particular land area is referred to as the yield. The most common units of measurement for it are kilos per hectare or bushels per acre.

Using an indicator such as the average farm yield per acre helps examine a farmer’s agricultural production on a specific field over a certain length of time.

Because it represents the outcome of all of the labor and resources put by agrarians in the growth of plants in their fields, it is regarded as perhaps the most essential gauge of each farmer’s competence.

A permanent and visible record of the harvested yields may be provided through yield maps. On the other hand, the variability in yield from a single year does not give sufficient information to identify long-term patterns in productivity.

During the analysis process, it is necessary to consider variables such as the fertility of the soil, the amount of rainfall, and the weed pressure.

Ensure you save the raw crop yield data used to create the maps in at least two different secure locations.

Although you have previously created a map, you may need the original data again while either implementing new management and decision-making software or updating computer systems.

As more years of data become accessible, there will be more confidence in comprehending the factors that produce variability, and the value of historical data will skyrocket.

The examination of long-term production records may help evaluate the productivity and viability of soil and the suitability of the cultural methods employed to cultivate a crop.

Even while variations in soil types or soil qualities are often the cause of yield variance within a field, weather patterns typically significantly influence variability.

The first three to five years of yield data collection should be deemed to have limited significance since not enough information will have been gathered to account for the variability in yield caused by weather.

How Is Farm/Crop Yield Calculated In Agriculture?

Typically, farmers would count how much of a specific crop has been harvested from a particular area before estimating the crop’s yield. After that, the crop that has been gathered is given a weight, and the crop yield of the whole farm is projected from that sample.

Suppose a wheat farmer recorded 30 heads per foot squared, and each head included 24 seeds. Now, if they assumed that 1,000 kernels weighed 35 grams, then the yield approximated using the simple method would be 30 times 24 times 35 times 0.04356, which equals 1,097 kilograms per acre.

Again, remember that this estimate is based on the assumption that the weight of 1,000 kernels is 35 grams. In addition, since one bushel of wheat weighs 27.215 kilograms, we calculated that the expected yield would be 40 bushels per acre (1097 divided by 27.215).

The term “crop yield” may also refer to the number of seeds produced by the plant. For instance, if one grain of wheat resulted in three other grains of wheat, the yield would be 1:3. “Agricultural production” is also sometimes used interchangeably with “farm/crop yield.”

Note: In a global economy, this data is essential to determine whether or not the crops that are grown will sufficiently offer food for a state’s food supply, animal feed, and energy sources.

Farm/Crop Yield Data Features

Here we discuss some of the significant farm yield data features.

The More Comprehensive Analyses

To carry out multi-layer analysis, you must first compile numerous layers of data into a single map and then search for connections between the various data layers.

It should be possible to produce combined productivity zones by using vegetation indices derived from satellite images, topography, and data from equipment, including yield, electrical properties, moisture levels, and others, as well as the findings of agrochemical analysis and 3D maps.

Automatic Visualization

To provide a better comprehension of the field’s variability and the development of management zones, the raw crop yield data should have been transformed into a gradient uniformly distributed picture.

Each of the yield file characteristics may be seen in graphical form, including moisture, yield mass, yield volume (wet and dry), downforce, fuel consumption, etc.

How Is Farm and Crop Yield Calculated In Agriculture?

Correction of Raw Data

A unique point in the field may get smoothed out (for instance, working over a portion of the combined header that is less than its whole width). You should be able to adjust isolated zones and polygons while producing farm yield data based on zones.

Construction of Prescription Maps

Prescription maps give input rates for specific zones of a field. These maps are derived using various spatial data, like soil nutrient concentrations and historical yields.

Closing Remarks

It is only possible to illustrate yield variability via yield maps. Their accuracy is only as good as the data used to create them. To collect reliable data, monitors need to have their settings properly configured and be reviewed often.

To understand the factors that contribute to variability, the crop yield data from maps, along with those from soil tests, scouting notes, and other observations, should be utilized.

Farmers are equipped with the information necessary to make better management choices, which have a good impact on the environment and result in increased production and profitability. This knowledge may get achieved via site-specific crop management.

Comparison of Data Layers To Make Decisions About Crops

To visualize field data and make informed decisions it is often necessary to compare layers on multiple synchronized views.

In GeoPard, you can visually compare up to four layers of data on one screen. All layers work synchronously when you zoom in/out or move the map for your convenience.

How do I enter split-screen mode? Select a field and click the layer comparison icon in the upper right corner of the screen. Then select any snapshots, field control areas, or other layers that you want to see on the same screen at the same time. Click Compare Layers. 

The layer comparison feature synchronizes maps, cursors, zoom levels. Also you have the ability to add/remove layers. Currently we support up to 4 data layers.

What are data layers in precision agriculture?

In precision agriculture, data layers refer to the different types of data that are collected and analyzed to make informed decisions about crop management. These layers may include:

  • Soil data: Information about soil characteristics, such as nutrient levels, pH, and texture, which can inform decisions about fertilization and other soil management practices.
  • Weather data: Data on current and historical weather patterns, including temperature, precipitation, and wind, can help farmers make decisions about planting, irrigation, and other practices.
  • Crop data: Data on crop growth and health, including plant height, leaf area, and chlorophyll levels, can inform decisions about fertilization, irrigation, and pest management.
  • Yield data: Information on crop yield and quality can help farmers make decisions about harvesting and marketing their crops.
  • Topographic data: Information about the shape and elevation of the land can inform decisions about planting and irrigation, and can help identify areas that may be prone to erosion or other environmental problems.
  • Remote sensing data: Data collected from satellites, drones, or other remote sensors can provide information on crop health, soil moisture, and other factors that can inform decisions about crop management.

By analyzing and integrating these different data layers, farmers can make more informed decisions about crop management, leading to more efficient and sustainable farming practices.

Use of Cropped Raster Data for Agribusiness

Cropped raster data based on field boundary sounds very simple. Some data sources are rasters with pixels and a resolution of 3m/10m/30m, others – are vectors with polygons or multipolygons.

The accurate boundary of the cropped raster data is tricky. The default output most gis and precision agriculture software have is a pixelated raster. Precise data evaluation close to the field boundary helps you better to understand, for example, canopy conditions, slope value. 

Examples of pixelated rasters:

Near-infrared pixelated raster
Elevation pixelated raster

Is it possible to improve and to make it more accurate?

Yes, GeoPard does that and even makes data available for further integration via API. Some examples:

  • Crop of raw (RedGreenBlue and NearInfrared views) satellite imagery based on field boundary:
RGB cropped raster
GeoPard Agriculture RGB cropped raster
Near-infrared cropped raster
GeoPard Agriculture Near-infrared cropped raster


  • Crop of satellite imagery with vegetation index like WDRVI based on the field boundary:


WDRVI cropped raster
GeoPard Agriculture WDRVI cropped raster


  • Crop of digital topography dataset (elevation and roughness) based on the field boundary:


Elevation cropped raster
GeoPard Agriculture Elevation cropped raster
Roughness cropped raster
GeoPard Agriculture Roughness cropped raster

How it looks in GeoPard interface and how it can be integrated in your ag tech solution:

GeoPard Agriculture NIR cropped raster
GeoPard Agriculture Relief Position
GeoPard Agriculture WDRVI

We at GeoPard understand the value of such details and are constantly working to improve the solution.

What is Raster Data?

Raster data is a type of digital image data that is represented by a grid of pixels or cells, where each cell corresponds to a specific location on the earth’s surface. Each pixel in a raster image is assigned a value that represents a particular attribute or characteristic of that location, such as elevation, temperature, or land cover.

It is commonly used in geographic information systems (GIS) and remote sensing applications to represent and analyze various types of spatial data. It can be collected from a variety of sources, including satellite and aerial imagery, digital cameras, and ground-based sensors.

It is often stored in various formats, such as GeoTIFF, JPEG, and PNG, which are designed to compress and store the data efficiently. GIS software and image processing tools can be used to manipulate and analyze data, such as by performing calculations on the pixel values or applying filters to enhance certain features.

Examples of applications include mapping land use and land cover, analyzing changes in vegetation over time, and predicting crop yields based on environmental factors.

How Raster Data Used In Precision Agriculture?

It is an essential component of precision agriculture, as it provides detailed information about crop health, soil properties, and environmental factors that can be used to make more informed decisions about crop management. Here are some examples of how raster data is used in precision agriculture:

  • Crop health analysis: Remote sensing data in the form of satellite imagery or drone imagery can be used to generate data layers that show vegetation indices such as NDVI (Normalized Difference Vegetation Index) or NDRE (Normalized Difference Red Edge). These indices help identify areas of the field with healthy vegetation, as well as areas where crops may be under stress due to disease, pests, or nutrient deficiencies.
  • Soil analysis: Soil data, such as soil moisture content or soil texture, can be collected using sensors that generate data layers. These layers can help identify areas of the field with varying soil characteristics, which can inform decisions about fertilization, irrigation, and other soil management practices.
  • Environmental analysis: Data layers that show environmental factors such as temperature, precipitation, and wind speed can be used to model crop growth and predict yield. These layers can also help identify areas of the field that are prone to erosion, flooding, or other environmental problems.
  • Variable rate application: It can be used to generate prescription maps for variable rate application of inputs such as fertilizer or pesticides. By applying inputs at varying rates according to the needs of different areas of the field, farmers can reduce waste and optimize crop growth.

Overall, raster data is a crucial tool in precision agriculture, as it provides detailed information about crop and soil conditions that can be used to make more informed decisions about crop management.

wpChatIcon
wpChatIcon

    Request Free GeoPard Demo / Consultation


    By clicking the button you agree our Privacy Policy. We need it to reply to your request.

      Subscribe


      By clicking the button you agree our Privacy Policy

        Send us information


        By clicking the button you agree our Privacy Policy