Preparing for Q2 Success: Essential Steps from Q1 Precision Insights

Preparing for Q2 Success: Essential Steps from Q1 Precision Insights

You’ve spent months gathering Q1 insights from your fields, but turning that data into a clear Q2 plan can feel overwhelming. GeoPard Agriculture simplifies this by unifying your yield data analytics, soil layers, and satellite imagery into actionable steps. In this post, you’ll learn how to use management zones and variable rate application tools to sharpen your Q2 planning and connect seamlessly with John Deere Operations Center. For more insights on precision agriculture, check out this resource.

Leveraging Q1 Insights for Q2 Planning

As you step into Q2, it’s crucial to make the most of your Q1 data. Transforming these insights into actionable strategies can set the stage for success.

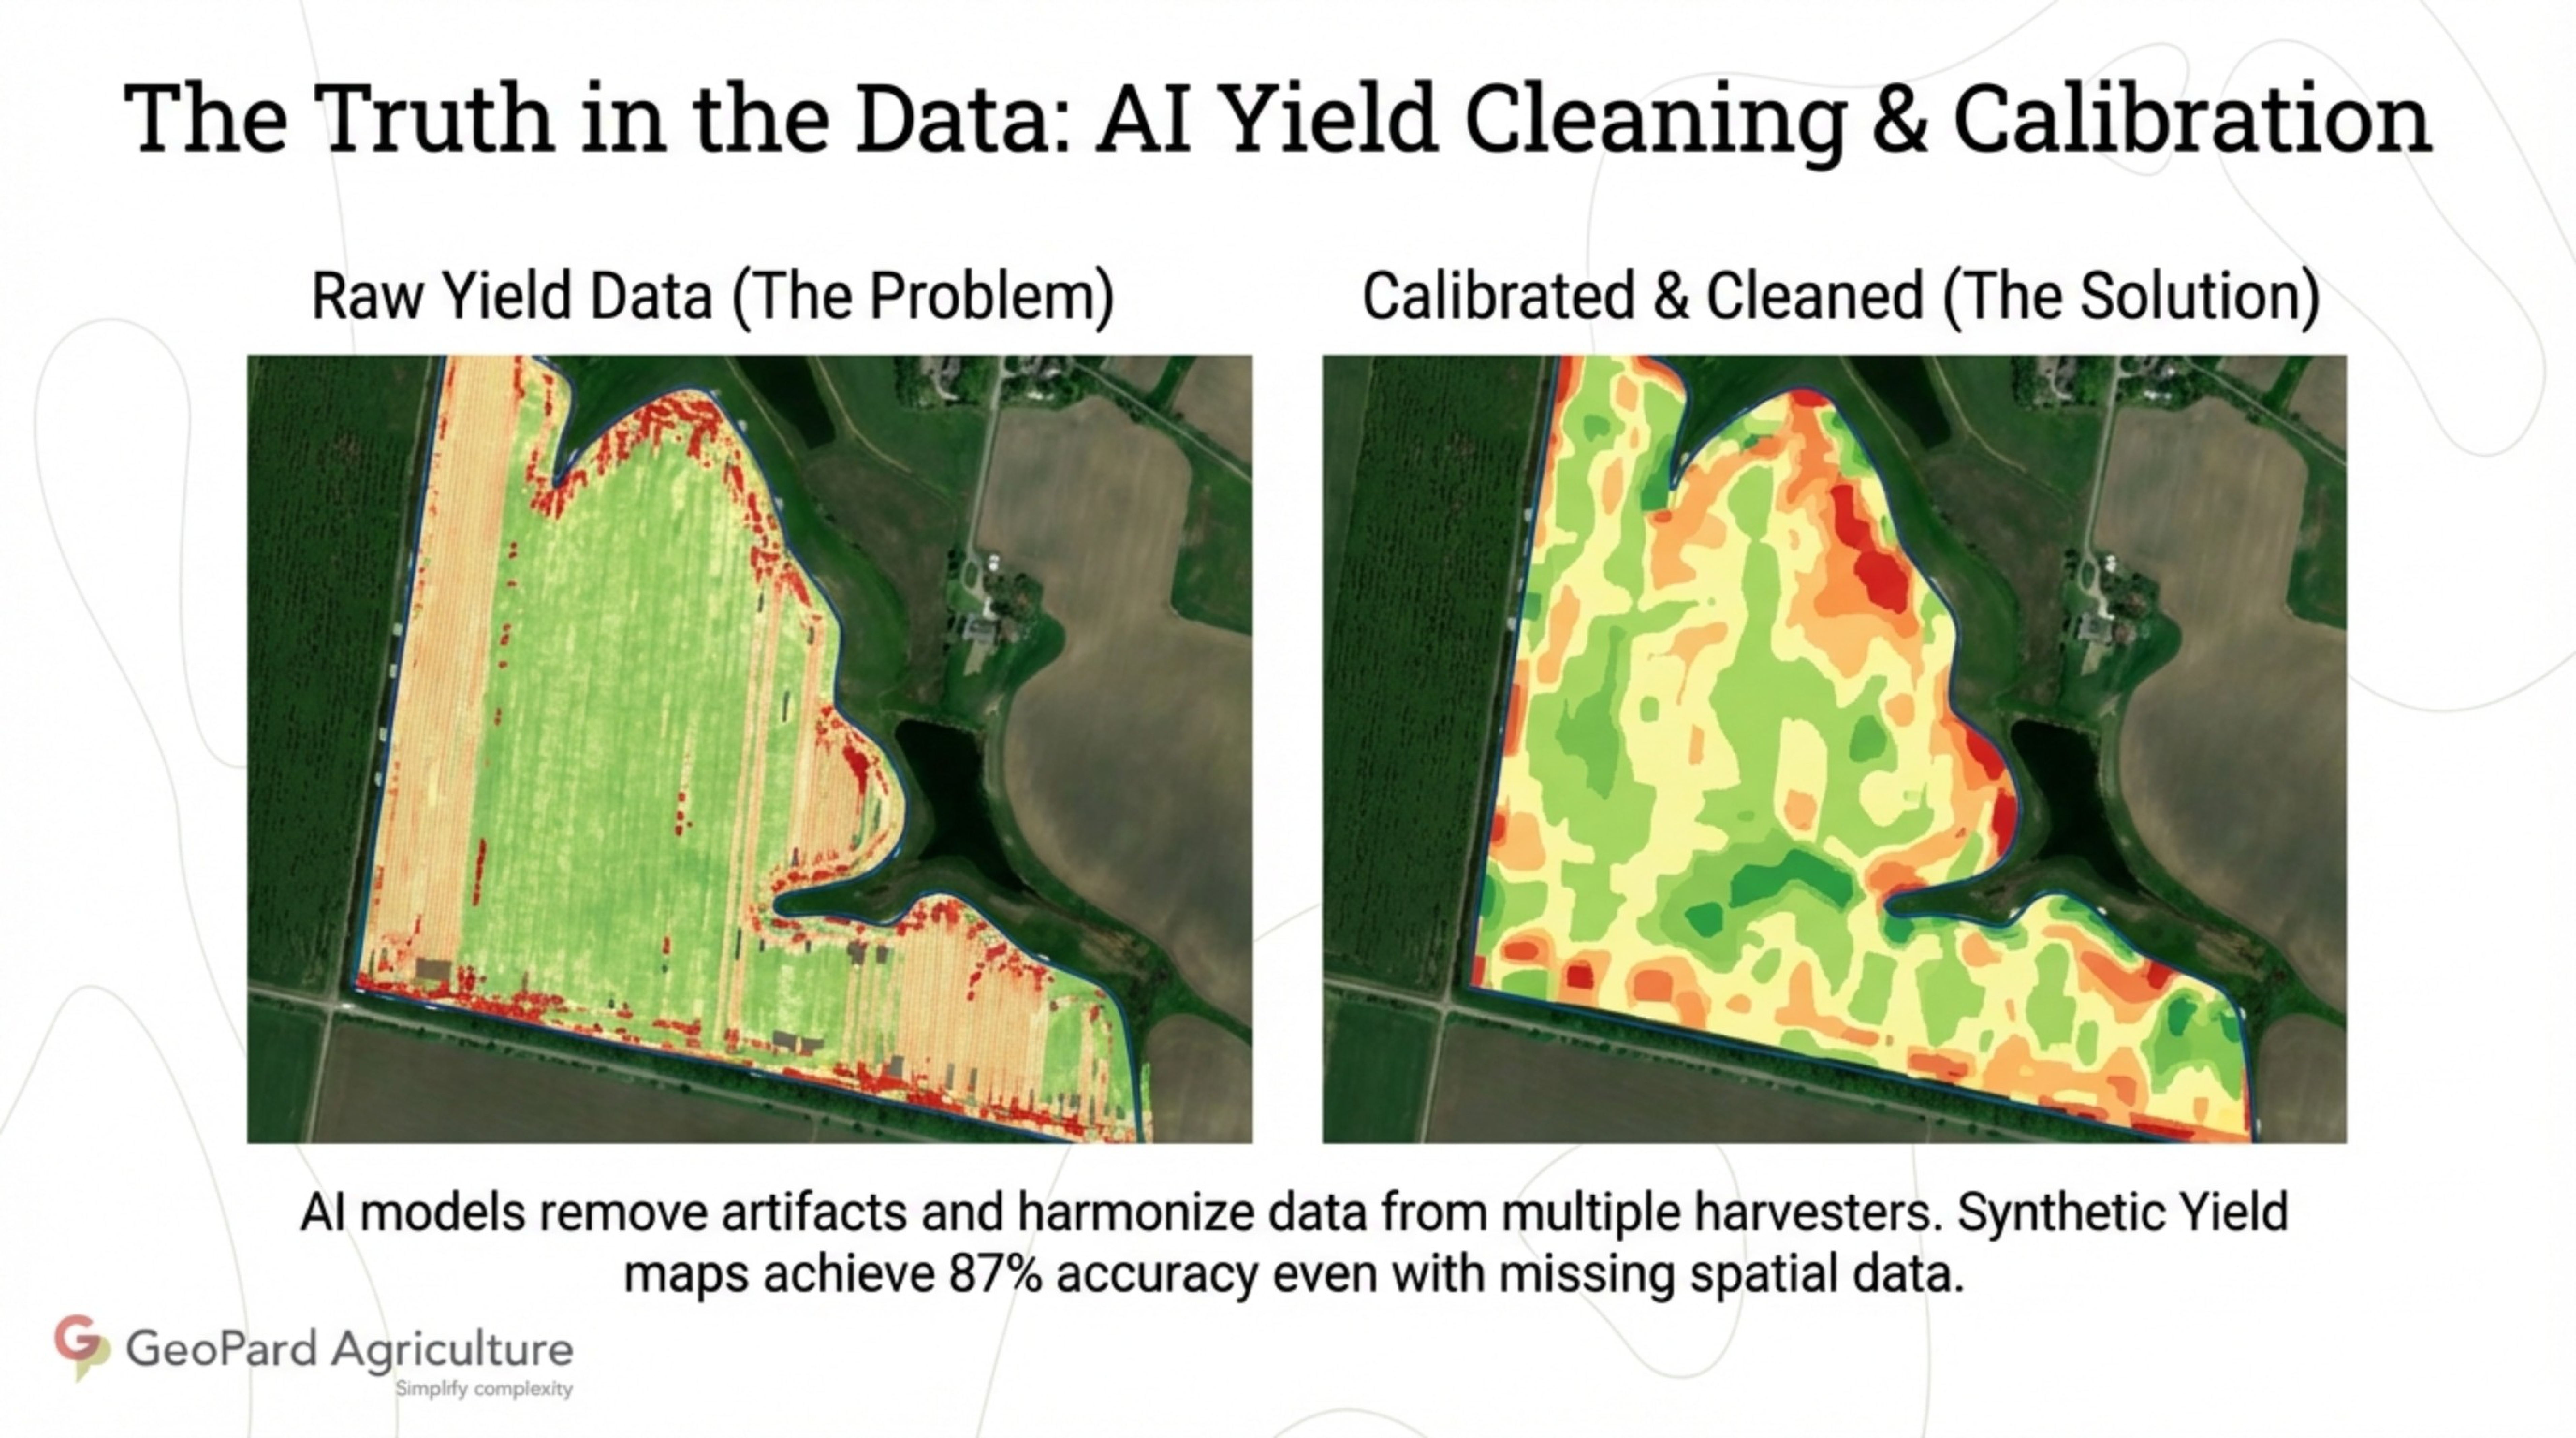
Analyzing Yield Data and Soil Layers

Uncovering trends within your yield data is the first step. This data, along with detailed soil layers, reveals the unique characteristics of your fields. By examining patterns, you can pinpoint which areas consistently perform well and which require attention. For example, a field that shows a 15% increase in yield might indicate optimal soil conditions.

Next, integrate soil data to understand its impact on crop performance. This might include analyzing pH levels or nutrient content. By doing so, you can identify specific areas needing nutrient adjustments. Imagine knowing exactly where to apply fertilizers for maximum impact. This precision not only saves resources but also enhances overall yield.

Mapping Management Zones and VRA Maps

Creating management zones allows for tailored strategies in each area. When you’re aware of field variability, you can address each zone’s needs specifically. For instance, a high-yield zone might require less intervention, while a low-yield area could benefit from targeted inputs.

Variable Rate Application (VRA) maps are your allies in this process. They guide you in applying the right amount of resources where needed. This approach not only optimizes input use but also increases profitability. Crafting these maps might seem challenging, but with the right tools, it becomes a straightforward task.

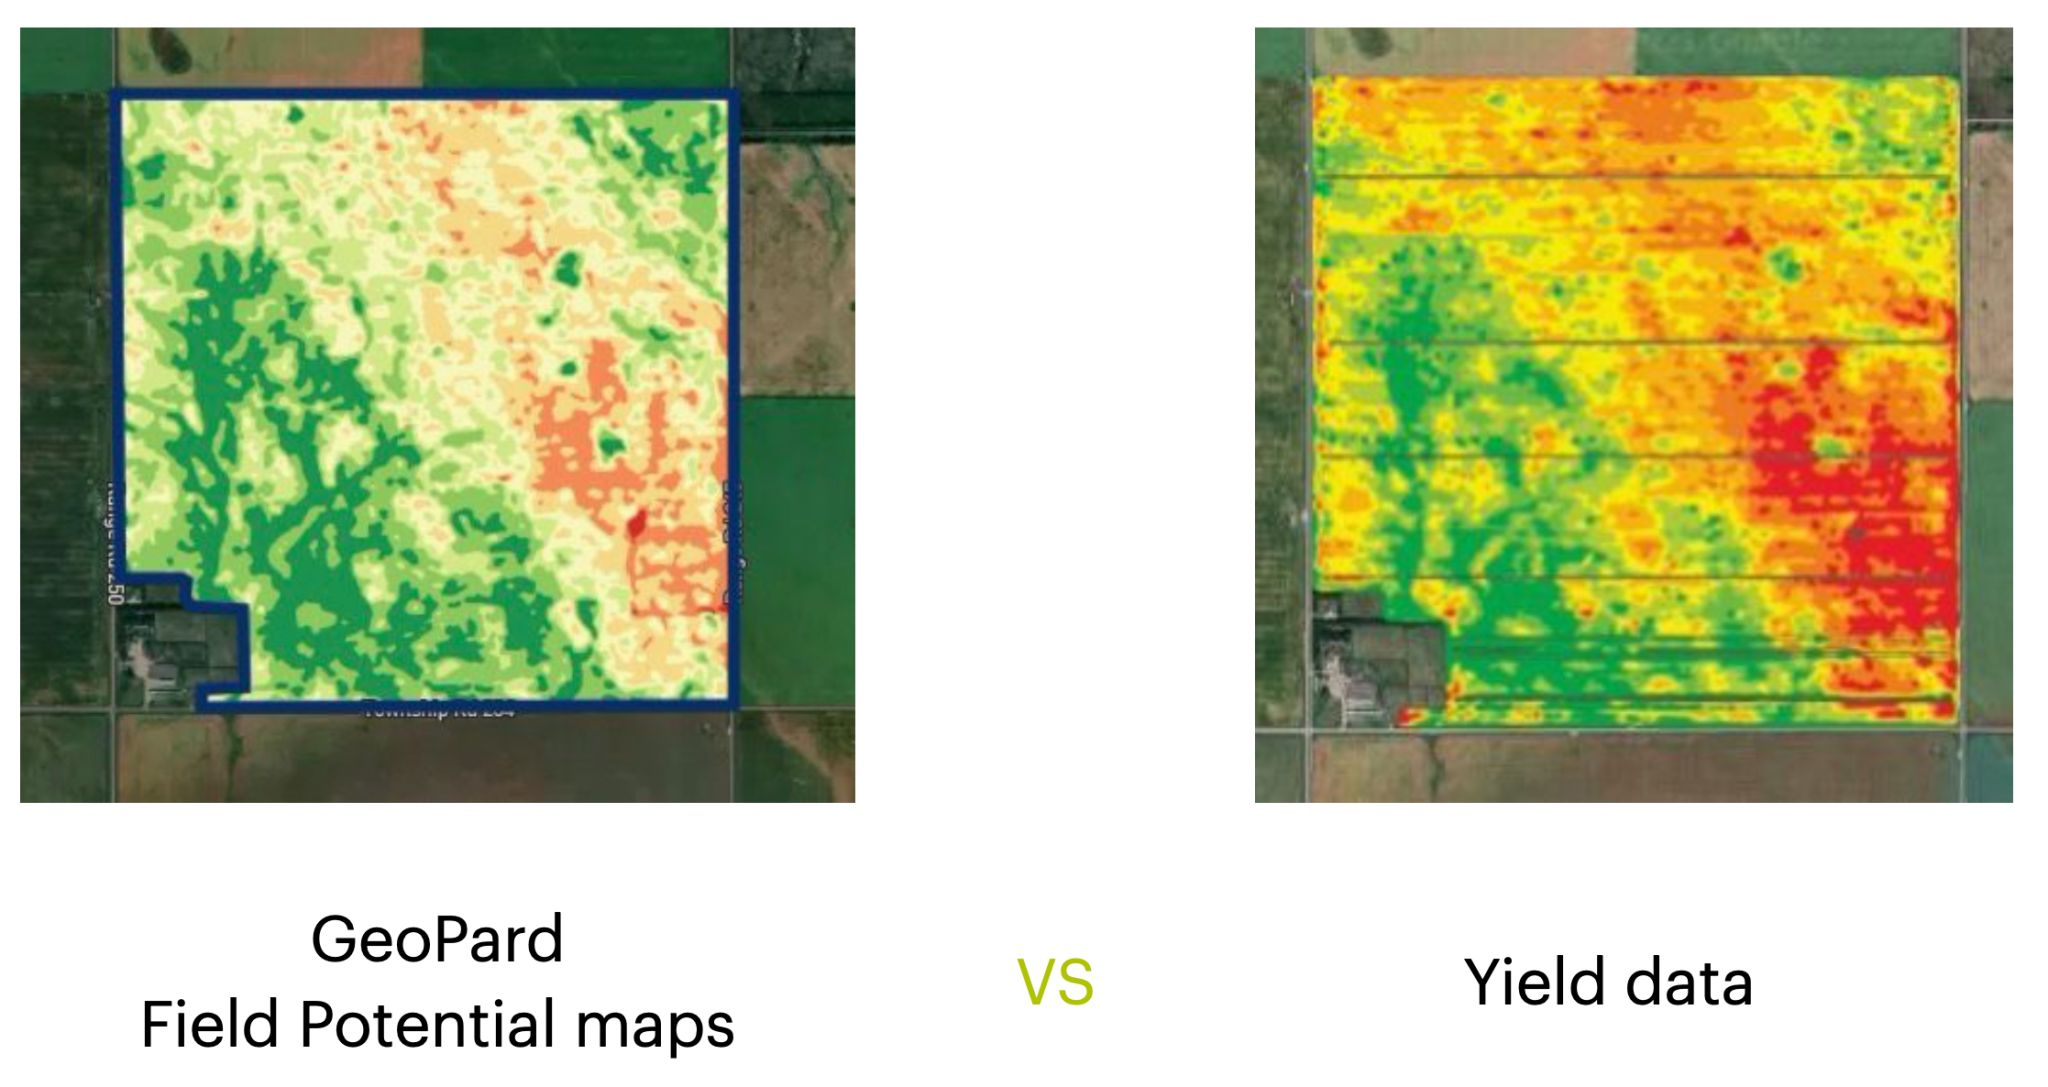
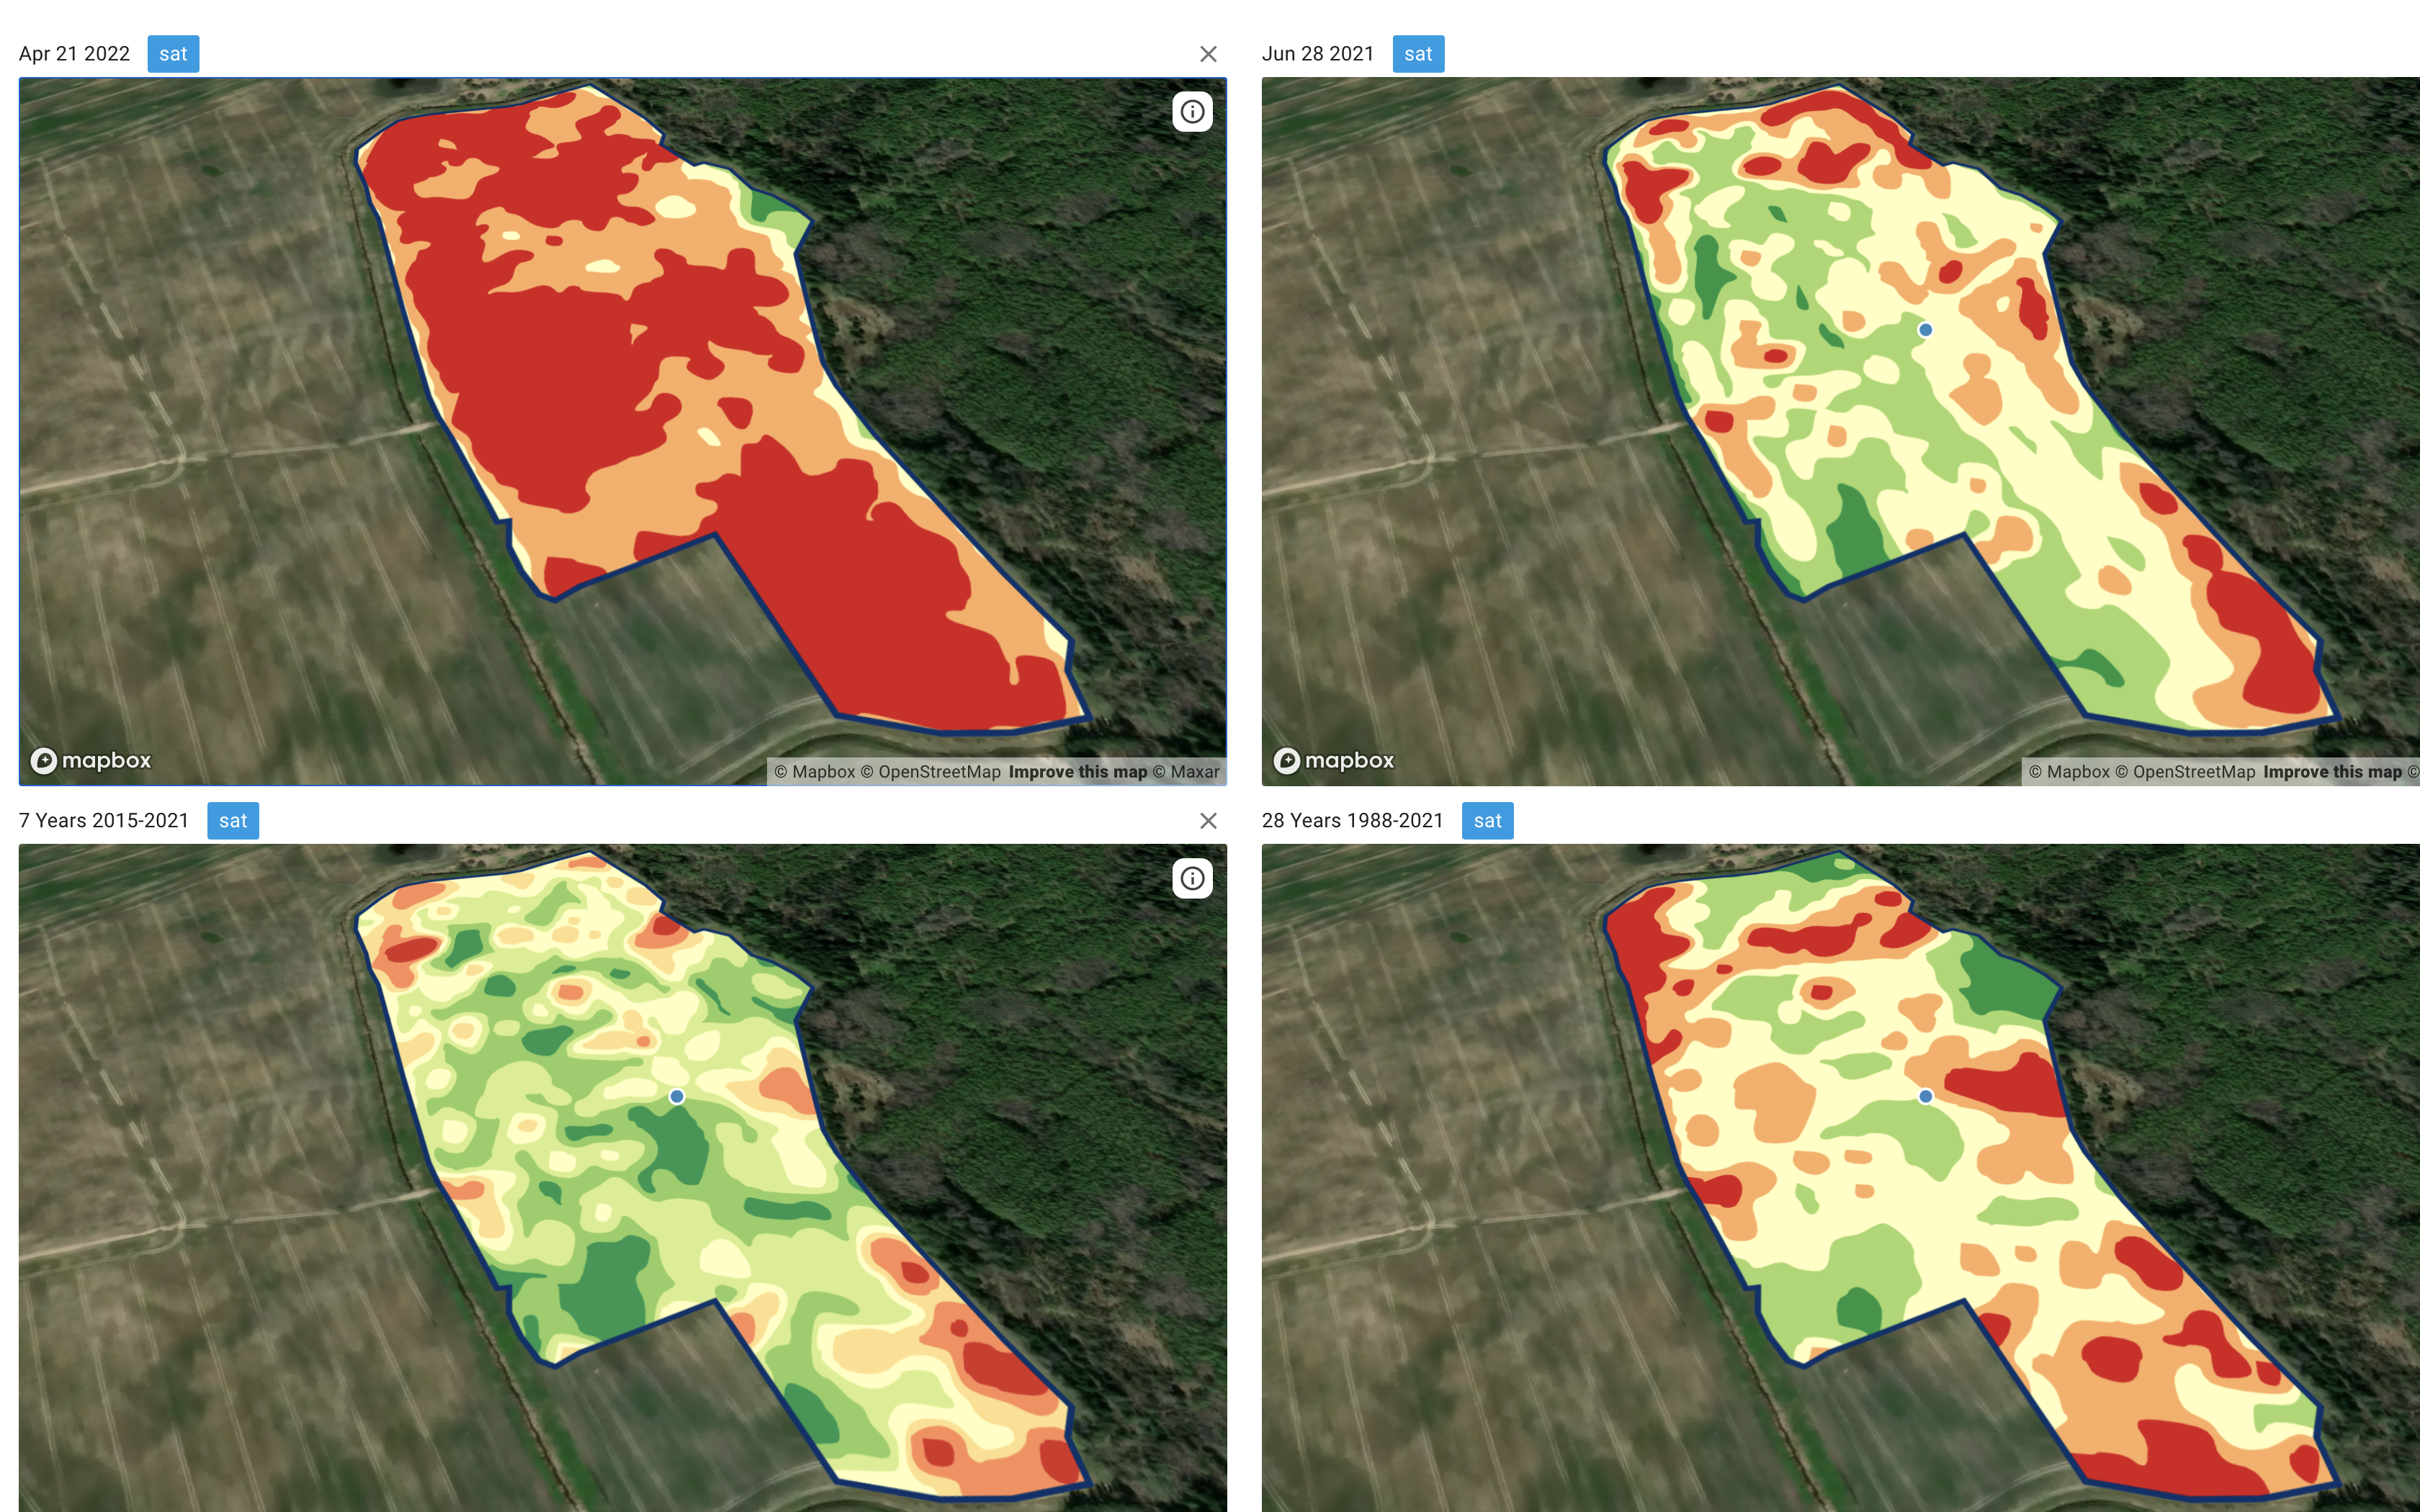
Harnessing NDVI and Satellite Imagery

NDVI and satellite imagery provide a bird’s eye view of your fields. These tools reveal crop health and growth patterns in real-time. By regularly monitoring this imagery, you can react swiftly to any changes. This insight allows for proactive management, addressing issues before they escalate.

Imagine spotting a pest outbreak early through satellite imagery. You can intervene immediately, safeguarding your crops. This proactive management ensures healthier fields and better yields. Leveraging these tools places you ahead, ensuring your crops thrive throughout the season.

GeoPard Tools for Q2 Success

GeoPard’s suite of tools empowers you to implement these strategies seamlessly. These tools are designed to enhance your decision-making and streamline operations.

Streamlining John Deere Operations Center Integration

Integrating with the John Deere Operations Center brings a new level of efficiency. It allows for seamless data flow between your systems. This integration means less manual entry and more time focusing on strategy. Data syncing ensures that your decisions are backed by the latest insights.

By connecting your GeoPard data with John Deere, you’re ensuring consistency across platforms. This unified approach simplifies your workflow, reducing the chances of errors. It’s about creating a system where every decision is data-driven and precise.

Crafting Smart Recommendations and Agronomic Workflows

Crafting smart recommendations is about understanding the nuances of your fields. GeoPard enables you to create agronomic workflows tailored to each zone’s needs. This customization ensures that every action you take is optimized for results.

Whether it’s adjusting fertilizer rates or planning irrigation schedules, these workflows guide you. They provide a clear path to follow, ensuring you’re always on track. Ultimately, it’s about maximizing your field’s potential with informed decisions.

Monitoring Crops with Historical Imagery

Historical imagery offers a wealth of information. It allows you to track changes and trends over time. By analyzing this data, you can predict future challenges and opportunities. This foresight helps in planning and resource allocation.

Imagine knowing exactly how a field responds to certain treatments over the years. This knowledge makes future planning more effective. You’re not just reacting to changes; you’re anticipating them, ensuring your fields remain productive.

Driving Trials and Demos with Precision

Precision is key when it comes to trials and demos. It’s about showcasing the effectiveness of your strategies and tools.

Implementing Bi-Directional Data Sync

Bi-directional data sync ensures that information flows seamlessly between systems. This feature keeps your data current and consistent. It’s crucial for making real-time decisions during trials.

By maintaining data accuracy, you can trust the results of your trials. This reliability builds confidence in your strategies and showcases their effectiveness. Stakeholders can see the real impact of data-driven decisions.

Conducting ROI Analysis and Profitability Mapping

ROI analysis is essential for understanding the financial impact of your strategies. With GeoPard, you can map profitability across different zones. This analysis highlights which areas deliver the best returns.

Profitability mapping guides your investment decisions. It shows where to focus resources for maximum gain. With clear insights, you can make informed financial decisions that enhance overall profitability.

Engaging with Free Trials and Subscriptions

Free trials and subscriptions offer a low-risk way to explore GeoPard’s capabilities. They provide hands-on experience with the tools and features. This engagement helps you see firsthand how GeoPard can transform your operations.

By trying these tools, you gain confidence in their benefits. It’s about understanding how GeoPard fits into your workflow and enhances decision-making. Embrace these opportunities to fully realize the potential of precision agriculture.

By leveraging these insights and tools, you’re not just planning for Q2; you’re setting the foundation for ongoing success.

Prepare for smarter farm decisions this year

From Q1 Insights to Input Efficiency: Best Practices for Precision Ag Teams

From Q1 Insights to Input Efficiency: Best Practices for Precision Ag Teams

You’ve just wrapped up your Q1 agronomy analysis, but turning all that data into smarter input use isn’t simple. Many consultants and growers struggle to translate field insights into precise fertilizer rates, seed placement, and crop protection tactics. This post lays out clear steps to apply your Q1 learnings with precision agriculture best practices, showing how GeoPard’s tools simplify management zones, VRA maps, and decision tracking to sharpen your strategies right now. For more information on precision agriculture practices, check out this guide.

Turning Q1 Insights into Action

Turning your Q1 agronomy insights into tangible actions can feel like a puzzle. Yet, the right tools make it easier. Harnessing precision agriculture best practices allows you to optimize input use and boost productivity.

Leveraging Q1 Agronomy Analysis

Step one is understanding the data from your Q1 agronomy analysis. This data holds the key to smart farming decisions. By identifying patterns and trends, you can make informed choices about how to manage your fields.

  • Identify trends: Look at your data for any standout patterns. Are there areas consistently underperforming?

  • Use insights wisely: Prioritize actions that address these patterns. This ensures your focus is on areas with the most impact.

  • Consult resources: For a deep dive into precision agriculture, this guide is a good place to start.

Input Optimization in Farming

Optimizing your inputs isn’t just about cutting costs; it’s about getting more out of every dollar spent. The data from your Q1 analysis can reveal where adjustments are needed.

  • Fertilizer: Apply just the right amount to maximize crop growth without waste.

  • Seeds: Use your data to determine the best seed placement strategies.

With the right approach, you can see a 20% savings in fertilizer use, translating directly into increased profitability.

AI in Agriculture for Precision

AI technology is revolutionizing agriculture with its ability to analyze large datasets quickly and accurately. GeoPard’s platform uses AI to help you make data-driven decisions efficiently.

  • AI tools: These tools can highlight areas of improvement or predict future trends.

  • Decision support: AI aids in creating adaptable strategies that respond to real-time data.

The longer you wait to integrate AI, the more opportunities for increased efficiency you might miss. For more on precision ag software, see this resource.

Building Effective Management Zones

Creating effective management zones is crucial for precision agriculture success. These zones let you treat each part of your field according to its specific needs, boosting overall efficiency.

Satellite Imagery for Crops

Satellite imagery provides a bird’s-eye view of your fields, allowing for precise management zone creation.

  • Field insights: Imagery helps identify crop health and growth patterns.

  • NDVI interpretation: This index shows plant health by measuring light absorption.

GeoPard’s 20+ years of satellite imagery gives you unparalleled access to historical data for comparison and planning. Learn more about optimizing inputs with satellite imagery here.

Topography Analytics for Precision

Topography analytics are essential for understanding field variations. These insights help in crafting strategies that account for natural landscape changes.

  • Elevation and slope: These factors affect water runoff and nutrient distribution.

  • Precision strategies: Use topography data to fine-tune input applications.

Effective use of topography analytics can dramatically enhance your input strategy’s precision.

Historical Field Variability Insights

Past performance is a strong indicator of future potential. Understanding historical field variability allows you to predict and plan for future seasons more accurately.

  • Data trends: Identify areas with consistent patterns of high or low productivity.

  • Adjustments: Tailor your strategy to leverage these insights for better outcomes.

Having a comprehensive view of your field’s history is a game-changer in making informed decisions.

Crafting Precision Agriculture Strategies

Transforming your data into actionable strategies is the final step. By implementing precision agriculture tactics, you can enhance your crop management practices significantly.

Variable Rate Application and VRA Maps

Variable Rate Application (VRA) is a cornerstone of precision agriculture. It involves applying inputs at varying rates across a field to match the needs of specific areas.

  • VRA maps: These maps guide where and how much of an input to apply, optimizing resource use.

  • Efficiency gains: VRA can lead to a 30% reduction in input costs while maintaining yield.

Integrating VRA into your operations can streamline your processes remarkably.

Fertilizer Rate and Seed Optimization

Optimizing fertilizer and seed rates is crucial for maximizing yield without unnecessary costs.

  • Tailored application: Use your data to apply the right amount of fertilizer and seeds where they’re needed most.

  • Cost benefits: Optimized rates mean lower input costs and higher yields, improving ROI.

Precision ag software like GeoPard can automate these calculations, making the process seamless.

Crop Protection Strategy Enhancement

Enhancing your crop protection strategy is the final piece of the puzzle. With better data, you can create a strategy that reduces risk and increases output.

  • Targeted protection: Focus efforts on areas most prone to pests or disease.

  • Smart solutions: Use data to decide when and where to apply crop protection measures.

By refining your crop protection strategy, you can ensure a healthier crop and a more profitable season.

In conclusion, applying Q1 agronomy insights effectively through precision agriculture practices can revolutionize your farming operations. By leveraging tools like GeoPard, you can optimize every aspect of your input use, from fertilizers to seeds, and protect your crops more effectively. Remember, every data point is a stepping stone to smarter, more efficient farming.

Reflect on the quarter’s precision ag insights and prepare to adopt smarter strategies.

Taming Precision Ag Data: Common Challenges and How to Overcome Them

Taming Precision Ag Data: Common Challenges and How to Overcome Them

Taming precision agriculture data management feels like wrestling a storm. You wrestle with messy yield data, scattered soil data layers, and tangled topography analytics that slow your progress. This guide breaks down those common challenges and shows how to turn complex data into clear, actionable insights—so you can build precise management zones, create VRA maps, and boost ROI with confidence. For more insights, visit this resource.

Navigating Precision Ag Data Challenges

Precision agriculture promises efficiency and higher yields, but managing the data can feel overwhelming. You might think that more data would always be a good thing, but too much information can slow you down. Let’s break down these challenges and see how you can overcome them.

Understanding Data Overload

In precision agriculture, the term “data overload” is all too familiar. With multiple sources like satellite imagery, yield monitors, and sensors, the sheer volume of data can paralyze decision-making. Imagine trying to organize a library with no cataloging system. It’s essential to prioritize what information truly impacts your decisions.

To manage this, focus on the data that provides actionable insights. For instance, historical NDVI analysis can spotlight trends that matter most to your fields. By narrowing your focus, you can transform data overload into a streamlined operation.

Tackling Data Inconsistencies

Data inconsistencies can derail even the best-laid plans. You may find discrepancies between yield monitors and manual measurements, leading to mistrust in the data. This inconsistency often arises from varying equipment calibrations or environmental factors affecting sensors.

Addressing these gaps requires a systematic approach. Start by calibrating your devices regularly to ensure accurate readings. Consistent data cleaning practices also play a vital role in maintaining reliable datasets. By doing this, you can restore trust in your data management process.

Streamlining Data Interoperability

Interoperability stands as a significant hurdle in data management. Different systems often fail to communicate effectively, leading to siloed information and missed opportunities. Imagine trying to solve a puzzle with pieces from different sets. This is where seamless integration becomes essential.

You can overcome this challenge by adopting platforms that support interoperability. For instance, connecting systems like GeoPard with the John Deere Operations Center can create a bi-directional data sync that enhances overall efficiency. Embrace open standards to ensure your systems speak the same language.

Strategies for Effective Data Management

Harnessing the full potential of your data requires practical strategies. Let’s explore techniques to optimize each step of your data management journey—starting with cleaning yield data, integrating soil data layers, and leveraging topography analytics.

Yield Data Cleaning Techniques

Cleaning yield data is the first step toward reliable insights. Dirty data can lead to inaccurate yield maps and flawed decision-making. Imagine trying to read a map with smudged labels.

  1. Calibration: Ensure your equipment is calibrated to provide consistent readings.

  2. Filtering: Remove outliers and noise to get a clear picture of actual yield patterns.

  3. Validation: Cross-reference yield data with other datasets to confirm accuracy.

By refining your data, you create a solid foundation for all subsequent analyses.

Integrating Soil Data Layers

Soil data is crucial for understanding field conditions. However, integrating multiple soil data layers can be challenging. Think of it like layering a cake with different textures and flavors.

  1. Layer Consolidation: Combine data from soil sensors, lab tests, and historical records into a unified format.

  2. Visualization: Use tools that visualize soil variability to identify management zones effectively.

  3. Validation: Compare integrated data with real-world observations to ensure accuracy.

With a clear approach, soil data can become a powerful tool in your management strategy. For more on the importance of soil data, check out this article.

Leveraging Topography Analytics

Topography analytics provide insights into field variations that affect crop growth. Understanding elevation, slope, and aspect can significantly influence your field management strategies, much like knowing the terrain before setting out on a hike.

  1. Mapping: Utilize topographic maps to understand field gradients and water movement.

  2. Analysis: Assess how topography impacts soil moisture and erosion risk.

  3. Integration: Combine topography data with other variables for comprehensive insights.

Topography analytics can reveal hidden opportunities and risks in your fields. Dive deeper into this topic with this guide.

Unlocking Potential with GeoPard

GeoPard can be your ally in navigating data challenges. With its comprehensive tools, you can create management zones, develop VRA maps, and enhance API integration for seamless data flow.

Building Multi-Layer Management Zones

Creating effective management zones is key to precision farming. These zones allow you to tailor inputs like water and nutrients according to specific field needs.

  • Data Integration: GeoPard combines various data layers to form accurate management zones.

  • Customization: Adjust zones based on real-time data to optimize resource use.

  • Efficiency: Target inputs more precisely, improving yields and reducing waste.

Creating Efficient VRA Maps

Variable Rate Application (VRA) maps are critical for precise input application. With GeoPard, you can create detailed VRA maps that guide equipment for optimal resource distribution.

  • Real-Time Updates: Adjust VRA maps with current data to ensure accuracy.

  • Cost Reduction: Apply inputs only where needed, saving on costs.

  • Yield Improvement: Enhance crop performance with tailored input applications.

Enhancing API Integration for AgTech

Integration is vital for a smooth workflow. GeoPard’s API capabilities allow seamless data exchange with other AgTech platforms, boosting your overall efficiency.

  • Flexibility: Connect with existing systems for streamlined operations.

  • Scalability: Easily integrate new technologies as your needs grow.

  • Data Flow: Ensure continuous data exchange for real-time insights.

By adopting these strategies and tools, you can transform your data challenges into opportunities, unlocking the full potential of your precision agriculture efforts.

Identify your biggest precision agriculture challenges and start building solutions.

How Integrated Farm Data Analytics Elevate Agronomic Decisions

How Integrated Farm Data Analytics Elevate Agronomic Decisions

You spend hours juggling soil tests, yield maps, satellite images, and machine data—yet your agronomic decisions still feel like guesses. Integrating farm data into one platform changes everything. With GeoPard Agriculture, you get AI powered analytics that turn scattered information into clear management zones and precise VRA maps. Keep reading to see how this unified approach sharpens your agronomic decision making and boosts your ROI. https://www.morningagclips.com/agriculture-data-analytics/

The Power of Integrated Farm Data

Harnessing the full spectrum of farm data can transform your approach to agriculture. Let’s dive into how combining different data types can improve decision-making on the farm.

Yield Data Analysis Insights

Understanding your yield data is crucial. It tells the story of your farm’s productivity. With detailed analysis, you can spot patterns and identify areas for improvement. Imagine knowing exactly which parts of your field yield best. This is the power of using analytics to break down your yield data. You can boost output where it’s needed most and reduce input where it’s not. By focusing on yield data, you can make informed decisions that directly impact your bottom line.

Soil Test Mapping Techniques

Soil is the foundation of any farm. Knowing its composition and health is vital. Soil test mapping lets you visualize nutrient levels across your fields. This helps in applying the right amount of fertilizer in the right places. By mapping soil quality, you can avoid wasting resources on areas that don’t need them. This precision saves money and supports healthier crops.

Topography and Satellite Imagery Analytics

The lay of the land affects water flow and nutrient distribution. Topography analytics provide insights into these factors. Coupled with satellite imagery, you get a bird’s-eye view of your fields. Satellite data shows changes over time, revealing trends not visible at ground level. This information helps in planning irrigation and preventing erosion, enhancing farm efficiency.

Enhancing Agronomic Decision Making

When you integrate various data sources, your agronomic decisions become more strategic. Let’s explore how this integration can refine your farming practices.

Creating Stable Management Zones

Stable management zones are the key to efficient farming. These zones are areas within a field that respond similarly to management practices. By establishing these zones, you can tailor your approach to each one. This means applying inputs like water and fertilizer more accurately. Stable zones lead to consistent results, reducing guesswork and enhancing productivity.

Variable Rate Application Maps Explained

Variable Rate Application (VRA) maps are a game-changer. They allow you to apply inputs such as seeds and fertilizers precisely where needed. VRA maps are created using data from soil tests, yield data, and topography. This precision ensures that each part of your field gets exactly what it needs. The result is less waste and better crop performance.

Benefits of AI Powered Analytics

AI transforms raw data into actionable insights. With AI, you can process complex datasets quickly and accurately. This technology identifies trends and anomalies you might miss. By leveraging AI, you optimize every decision, from planting to harvesting. The longer you wait to adopt AI, the more opportunities you miss to improve efficiency and boost ROI.

GeoPard Agriculture: Your Agtech Solution

GeoPard Agriculture offers a comprehensive platform that unifies all these capabilities. Let’s see how it supports your farming operations.

John Deere Operations Center Integration

GeoPard integrates seamlessly with John Deere Operations Center, enhancing your existing system. This integration allows for easy data flow between platforms. Your machinery data combines with GeoPard’s analytics for a complete picture of your farm’s performance. This synergy streamlines operations and improves decision-making.

ROI Analysis in Agriculture

Understanding your return on investment is crucial. GeoPard provides tools to analyze ROI across different farm operations. By examining inputs and outputs, you can identify areas to cut costs and maximize profits. This analysis is essential for long-term farm sustainability.

Start Your Free Trial Today

GeoPard Agriculture empowers you to make data-driven decisions with confidence. Unlock the potential of your fields by trying GeoPard today. With access to advanced analytics and integration capabilities, you streamline your farming operations and elevate your agronomic decision-making. Don’t wait—start your free trial now and take the first step towards precision agriculture.

Identify your biggest precision agriculture challenges and start building solutions.

Plan, Apply, Analyze: GeoPard Use Cases for VRA and Post Season ROI

Plan, Apply, Analyze: GeoPard Use Cases for VRA and Post Season ROI

Most precision agriculture tools stop short when it comes to linking pre-season planning with post-season results. You need a platform that ties your management zones and VRA maps directly to yield and ROI analysis. GeoPard Agriculture does exactly that—combining soil, satellite, and machinery data so you can plan smarter, apply precisely, and measure returns with confidence. Let’s explore workflows that put your data to work all season long. For more insights, visit our field potential and yield data analysis page.

GeoPard for Agronomic Planning

GeoPard Field Potential maps vs Yield data

GeoPard Field Potential is your start into Precision Agriculture

Stepping into the world of agronomic planning, GeoPard offers more than just data. It turns your field insights into actionable strategies.

Crafting Management Zones

Creating management zones is crucial. With GeoPard, you can use varied data layers to draw precise zones. This means you can focus your resources exactly where they’re needed. For example, using soil type and crop health data, you’ll know precisely where to increase or reduce inputs. This way, not only do you save costs, but you also boost productivity.

Imagine a farmer using satellite and soil data to craft zones. They notice a patch needing more nutrients. With GeoPard, they adjust their plan, apply the right amount, and watch the crops thrive. This precise application is how you turn data into yield. Want to learn more about creating management zones? Check out our detailed guide.

Precision Agriculture Software Tools

GeoPard’s tools offer more than just data aggregation. They provide a comprehensive look at your farm’s health. From satellite images to soil tests, you have everything at your fingertips. These tools help you plan efficiently, ensuring every seed, drop of water, and ounce of fertilizer is used wisely.

Consider the impact: A user can reduce input wastage by up to 30%. That’s real savings and real impact on your bottom line. Plus, you’re helping the environment by minimizing runoff and over-application. Ready for the next step? Explore how these tools can revolutionize your farm management in our software tools overview.

In-Season Monitoring with GeoPard

Once your plan is in place, in-season monitoring helps ensure everything stays on track. GeoPard offers intuitive tools for real-time insights.

Leveraging NDVI Satellite Imagery

NDVI satellite imagery is a game-changer. By assessing vegetation health, you can spot issues before they become costly problems. Picture this: you notice a field section with declining NDVI values. With GeoPard, you identify a pest issue and address it promptly, saving your crop.

These images update every few days, providing fresh insights into your fields. This frequency means you’re never in the dark about what’s happening on your farm. By staying informed, you make timely decisions that can save you money and maximize yield. For more on NDVI, dive into our satellite monitoring tutorials.

Crop Monitoring with Yield Data

Monitoring doesn’t stop with satellites. Yield data offers another layer of insight. Use it to track performance and make adjustments. Imagine discovering a particular seed variety outperforms others. You can pivot your strategy to focus on what works best.

With GeoPard, you can compare yields year-on-year, identifying long-term trends and making informed decisions. This level of detail is what sets successful farms apart. Curious about maximizing yield data? Visit our analytics tutorials.

Post-Season ROI Analysis

Finally, post-season analysis ties everything together. It’s where strategy meets results, and GeoPard excels in delivering clear insights.

Examining Variable Rate Applications

Evaluating your variable rate applications (VRA) helps you understand what worked and what didn’t. GeoPard provides detailed maps and reports to review application efficiency. Did varying fertilizer rates impact yield as expected? You’ll have the data to know for sure.

This analysis is not just about learning; it’s about growing better next season. By understanding the impact of your VRA decisions, you enhance future outcomes. To see how others have benefited, check out this VRA use case.

Integrating John Deere Operations Center

GeoPard’s integration with the John Deere Operations Center offers seamless data flow. This integration means you can access all your farm data in one place, simplifying management tasks. Picture managing your operations with ease, thanks to synchronized data.

The integration supports data-driven decisions, improving efficiency and boosting your ROI. With everything connected, you’re better equipped to handle challenges and seize opportunities. Learn more about this powerful integration in our John Deere Operations Center overview.

By leveraging GeoPard’s comprehensive suite of tools, you transform your approach to farming. From planning to post-season analysis, each stage is enhanced, ensuring you get the most from your fields. Don’t wait to maximize your farm’s potential—start using GeoPard today!

Learn how precise data can reveal your farm’s hidden challenges.

wpChatIcon
wpChatIcon

    Request Free GeoPard Demo / Consultation


    By clicking the button you agree our Privacy Policy. We need it to reply to your request.

      Subscribe


      By clicking the button you agree our Privacy Policy

        Send us information


        By clicking the button you agree our Privacy Policy