Normalized Difference Vegetation Index (NDVI) is a commonly used metric to quantify the density and health of vegetation. Its values range from -1 to 1, with negative values indicating water or bare soil, values near zero indicating sparse vegetation, and higher values indicating denser and healthier vegetation.
What is Normalized Difference Vegetation Index (NDVI)?
It is a method that calculates the variation between the quantity of red light received by vegetation and the quantity of near-infrared light that is strenuously reflected by vegetation.
The objective of this method is to provide a quantitative analysis of the state of plant life. There is no situation in which the its value falls outside of the spectrum of -1 to +1. However, there isn’t a clear demarcation between the many types of land cover that may be found.
If the sum of the figures comes out to be less than zero, it is quite probable that the substance in question is water. If you obtain an NDVI score that’s quite near to a positive one, there’s a good chance that it’s just a bunch of tightly packed green leaves. This is especially true if the leaves are densely packed together.
Green leaves have a greater value than red leaves do, which is why this is the case. Imagine for a moment that the it is very close to being equal to 0.
In such a situation, there is hardly a snowball’s chance in hell that any leaves of any type are still there, and the region may even be urbanized by this point. The Normalized Difference Vegetation Indicator is the index that is used by analysts in the area of remote sensing the majority of the time.
Why is Normalized Difference Vegetation Index useful?
There are a lot of different vegetation indices, and the vast majority are comparable to one another. However, it is the one that is used the most often and widely, and it also has an essential benefit, which is a high resolution of pictures that are derived from satellite data.
In the circumstances like this, channels with a resolution of ten meters may be utilized to determine the NDVI. Remember that one pixel is equal to ten by ten meters. On the other hand, the index’s resolution that uses extra light channels, namely red age, might be twenty meters, where one pixel is equal to twenty by twenty meters.
How is the NDVI calculated?
It may be determined using the following straightforward mathematical procedure, which converts raw satellite information into vegetation indices.

The equation creates a single number that is representative and integrates the information that is accessible in the red and NIR (near-infrared) bands.
To do this, it takes the reflectance throughout the red spectral band and subtracts it from the reflectance throughout the NIR band. After that, the result is divided by the total reflectance of the NIR and red wavelengths.
The assessment of the NDVI will never be more than a positive one and less than a negative one. In addition, a number between -1 and 0 denotes a plant that has died and inorganic items like stones, roads, and buildings.
Simultaneously, its values for living plants may vary anywhere from 0 to 1, with 1 representing the healthiest plant and 0 representing the unhealthiest plant. It is possible to assign a single value to each pixel in a picture, whether that pixel represents a single leaf or a wheat field that spans 500 acres.
How do we use Normalized Difference Vegetation Index?
Justifiably, it is now being utilized in a number of different fields of research. For instance, it is leveraged in the field of agriculture for the objectives of precision farming and the evaluation of biomass. It is likewise employed by foresters in order to evaluate forest resources as well as the leaf area index (LAI).
In addition, NASA believes it to be a reliable indication of the existence of drought conditions. The proportional NDVI and the concentration of vegetation are both lower in areas where water serves as a barrier to the establishment of vegetation.
This is because water prevents the roots of plants from growing deeper into the soil. It, including other kinds of remote sensing, has the capability to be utilized in a wide variety of distinct ways in reality.
What can NDVI tell us about plants?
It is essential to have a solid comprehension that the Normalized Difference Vegetation Index is only an indication of the healthiness of the plant and provides no information about the reasons behind a certain condition.
The vegetation index is more of an expression than a direct reflection of what is occurring on the field. Let’s look at three applications of NDVI for field analysis:
When a new season begins
It is beneficial for understanding the plant’s winter hardiness and how it managed to survive.
- If its value is less than 0.15, it is somewhat likely that all of the plants in this field section have perished. Typically, these numbers relate to the tilled soil without any plants.
- Another example of a low number is 0.15-0.2. It might suggest that the plants began preparing for winter during the early phenological period, before the tilling stage.
- A result in the range of 0.2 to 0.3 is satisfactory. The plants most likely progressed to the tilling stage and have regained their vegetative state.0.3−
- 0.5 is a decent value. However, it is important to remember that higher NDVI readings suggest that plants overwintered at a later phenological stage. Suppose the satellite picture was captured before the vegetation resumed its normal state. In that case, analyzing the area after the vegetation continued its normal form is important.
- A number greater than 0.5 indicates an anomaly during the post-wintering phase. It is recommended that you check out this field zone.
To recap, if you notice that the Values obtained are significantly different from the norm, you need to conduct an inspection of the relevant portion of the field. A large departure from the norm is required for values to be categorized as abnormal in a given area.
When the season is in the middle
Utilizing the index might be helpful in gaining a better understanding of how plants develop. Imagine that the readings fall between mild and high (0.5-0.85). It is highly likely that this particular part of the area does not face any major challenges at the present time.
If the index remains lower than it should be, there may be issues such as a deficiency of soil water or nutrients. However, you need to do your own investigation into this particular area.
We generate maps for variable-rate application (VRA) of nitrogen by using the Normalized Difference Vegetation Index. We identify regions with vegetation indices ranging from low to high.
After that, it is up to the individual farmer to determine the amount of necessary fertilizer. The following is the most effective method for applying nitrogen:
- Suppose the vegetation index for the region is high. In that case, the recommended dosage of fertilizer should be decreased to 10 and 30 percent of the typical rate.
- If the vegetation index is around average, the recommended dosage of fertilizer should be raised to between 20 and 25 percent of the typical amount.
- If the vegetation index is low, you first need to figure out why it is that way.
To reconstruct a field’s agricultural yield, we also use this index. With this data, we produce maps that may be used for the variable-rate application of potassium and phosphate fertilizers.
When the season is over
The NDVI index is a useful tool for determining whether fields are ready to be harvested; the lower the index, the more closely a portion of the area is approaching the stage when it is ready to be harvested. In this scenario, a value for the index lower than 0.25 would be ideal.

To begin, it is a mathematical computation performed pixel-by-pixel on an image utilizing tools from a GIS (Geographic Information System). Calculated by contrasting the amounts of red and near-infrared light absorbed and reflected by the plant, it measures the plant’s overall state of health.
The Normalized Difference Vegetation Index may be used to study land all over the globe, making it ideal for focused field studies and national or global vegetation monitoring.
By means of utilizing NDVI, we can get an immediate analysis of fields, enabling agriculturalists to optimize the production potential of areas, limit their influence on the environment, and modify their precision agricultural operations.
Moreover, examining it in conjunction with other data streams, such as those about the weather, might provide further insight into recurring patterns of droughts, freezes, or floods and how they impact vegetation.
Frequently Asked Questions
1. What is NDVI primarily used to determine?
It is primarily used to determine the health and density of vegetation in a given area. This index is widely used in agriculture, forestry, and ecology to monitor vegetation growth, assess plant stress levels, identify areas of drought or disease, and aid in crop management decisions.
2. How to read NDVI imagery?
To read NDVI imagery, you can interpret the color scale associated with the index values. Typically, healthy vegetation appears green, while less healthy or sparse vegetation appears yellow or red.
Darker shades may indicate areas with high biomass, while lighter shades may suggest lower vegetation density or the presence of bare soil.
Understanding the context of the area being analyzed, such as the specific crop type or environmental conditions, can further assist in interpreting NDVI imagery and making informed decisions about agricultural practices.
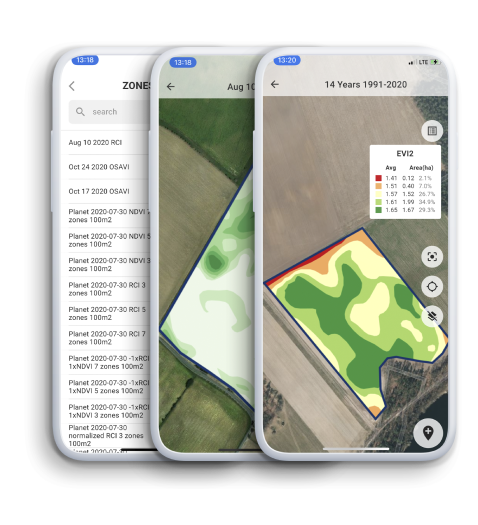
Crop monitoring