How UAS-Based High-Throughput Phenotyping is Transforming Modern Plant Breeding

By 2050, the global population is projected to reach 9.8 billion people, doubling the demand for food. However, expanding farmland to meet this need is unsustainable. Over 50% of new cropland created since 2000 has replaced forests and natural ecosystems, worsening climate change and biodiversity loss.

To avoid this crisis, scientists are turning to plant breeding—the science of developing crops with higher yields, disease resistance, and climate resilience. Traditional breeding methods, however, are too slow to keep up with the urgency of the problem.

This is where drones and artificial intelligence (AI) are stepping in as game-changers, offering a faster, smarter way to breed better crops.

Why Traditional Plant Breeding Is Falling Behind

Plant breeding relies on selecting plants with desirable traits, such as drought tolerance or pest resistance, and cross-breeding them over multiple generations. The biggest bottleneck in this process is phenotyping—the manual measurement of plant characteristics like height, leaf health, or yield.

For example, measuring plant height across a field of 3,000 plots can take weeks, with human errors causing inconsistencies of up to 20%. Additionally, crop yields are improving at just 0.5–1% annually, far below the 2.9% growth rate needed to meet 2050 demands.

Maize, a staple crop for billions, illustrates this slowdown: its annual yield growth has dropped from 2.2% in the 1960s to 1.33% today. To bridge this gap, scientists need tools that automate data collection, reduce errors, and speed up decision-making.

How Drone Technology Is Transforming Plant Breeding

Drones, or Unmanned Aerial Systems (UAS), equipped with advanced sensors and AI, are revolutionizing agriculture. These devices can fly over fields and collect precise data on thousands of plants in minutes, a process known as High Throughput Phenotyping (HTP).

Unlike traditional methods, drones capture data across entire fields, eliminating sampling bias. They use specialized sensors to measure everything from plant height to water stress levels.

For instance, multispectral sensors detect near-infrared light reflected by healthy leaves, while thermal cameras identify drought stress by measuring canopy temperature.

By automating data collection, drones reduce labor costs and accelerate breeding cycles, making it possible to develop improved crop varieties in years instead of decades.

The Science Behind Drone Sensors and Data Collection

Drones rely on a variety of sensors to gather critical plant data. RGB cameras, the most affordable option, capture visible light to measure canopy cover and plant height. In sugarcane fields, these cameras have achieved 64–69% accuracy in counting stalks, replacing error-prone manual counts.

Multispectral sensors go further by detecting non-visible wavelengths like near-infrared, which correlate with chlorophyll levels and plant health. For example, they have predicted drought tolerance in sugarcane with over 80% accuracy.

  • RGB Cameras: Capture red, green, and blue light to create color images.
  • Multispectral Sensors: Detect light beyond the visible spectrum (e.g., near-infrared).
  • Thermal Sensors: Measure heat emitted by plants.
  • LiDAR: Uses laser pulses to create 3D maps of plants.
  • Hyperspectral Sensors: Capture 200+ light wavelengths for ultra-detailed analysis.

Thermal sensors detect heat signatures, identifying water-stressed plants that appear hotter than healthy ones. In cotton fields, thermal drones have matched ground-based temperature measurements with less than 5% error.

LiDAR sensors use laser pulses to create 3D maps of crops, measuring biomass and height with 95% precision in energy cane trials. The most advanced tools, hyperspectral sensors, analyze hundreds of light wavelengths to spot nutrient deficiencies or diseases invisible to the naked eye.

These sensors helped researchers link 28 new genes to delayed aging in wheat, a trait that boosts yields.

From Flight to Insight: How Drones Analyze Crop Data

The drone phenotyping process begins with careful flight planning. Drones fly at 30–100 meters altitude, capturing overlapping images to ensure full coverage. A 10-hectare field, for instance, can be scanned in 15–30 minutes.

After the flight, software like Agisoft Metashape stitches thousands of images into detailed maps using Structure-from-Motion (SfM)—a technique that converts 2D photos into 3D models. These models allow scientists to measure traits like plant height or canopy cover at the tap of a button.

AI algorithms then analyze the data, predicting yields or identifying disease outbreaks. For example, drones scanned 3,132 sugarcane plots in just 7 hours—a task that would take three weeks manually. This speed and precision enable breeders to make faster decisions, such as discarding low-performing plants early in the season.

Key Applications of Drones in Modern Agriculture

Drones are being used to tackle some of farming’s biggest challenges. One major application is direct trait measurement, where drones replace manual labor. In maize fields, drones measure plant height with 90% accuracy, cutting errors from 0.5 meters to 0.21 meters.

They also track canopy cover, a metric indicating how well plants shade the ground to suppress weeds. Energy cane breeders used this data to identify varieties that reduce weed growth by 40%.

Another breakthrough is predictive breeding, where AI models use drone data to forecast crop performance. For instance, multispectral imagery has predicted maize yields with 80% accuracy, outperforming traditional genomic testing.

Drones also aid in gene discovery, helping scientists locate DNA segments responsible for desirable traits. In wheat, drones linked canopy greenness to 22 new genes, potentially boosting drought tolerance.

Additionally, hyperspectral sensors detect diseases like citrus greening weeks before symptoms appear, giving farmers time to act.

Boosting Genetic Gains with Precision Technology

Genetic gain—the annual improvement in crop traits due to breeding—is calculated using a simple formula:

(Selection Intensity × Heritability × Trait Variability) ÷ Breeding Cycle Time.

Genetic gain (ΔG) is calculated as:
ΔG = (i × h² × σp) / L

Where:

  • i = Selection intensity (how strict breeders are).
  •  = Heritability (how much of a trait is passed from parents to offspring).
  • σp = Trait variability in a population.
  • L = Time per breeding cycle.

Why It Matters: Drones improve all variables:

  1. i: Scan 10x more plants, allowing stricter selection.
  2. : Reduce measurement errors, improving heritability estimates.
  3. σp: Capture subtle trait variations across entire fields.
  4. L: Cut cycle time from 5 years to 2–3 years via early predictions.

Drones enhance every part of this equation. By scanning entire fields, they let breeders select the top 1% of plants instead of the top 10%, increasing selection intensity. They also improve heritability estimates by reducing measurement errors.

For example, manually assessing plant height introduces 20% variability, while drones cut this to 5%. Moreover, drones capture subtle trait variations across thousands of plants, maximizing trait variability.

Most importantly, they shorten breeding cycles by enabling early predictions. Sugarcane breeders using drones have tripled their genetic gains compared to traditional methods, proving the technology’s transformative potential.

Overcoming Challenges and Embracing the Future

Despite their promise, drone-based phenotyping still faces significant challenges. The high cost of advanced sensors remains a major barrier – hyperspectral cameras, for example, can exceed $50,000, making them unaffordable for most small-scale farmers.

Processing the massive amounts of data collected also requires substantial cloud computing resources, which adds to the expense. AI platforms like AutoGIS are automating data analysis, eliminating the need for manual input.

Researchers are also integrating drones with soil sensors and weather stations, creating a real-time monitoring system that alerts farmers to pests or droughts. These innovations are paving the way for a new era of precision agriculture, where data-driven decisions replace guesswork.

Conclusion

Drones and AI are not just transforming plant breeding—they’re redefining sustainable agriculture. By enabling faster development of drought-resistant, high-yield crops, these technologies could double food production by 2050 without expanding farmland.

This would save over 100 million hectares of forests, equivalent to the size of Egypt, and reduce the carbon footprint of farming. Farmers using drone data have already cut water and pesticide use by up to 30%, protecting ecosystems and lowering costs.

As one researcher noted, “We’re no longer guessing which plants are best. The drones tell us.” With continued innovation, this fusion of biology and technology could ensure food security for billions while safeguarding our planet.

Reference: Khuimphukhieo, I., & da Silva, J. A. (2025). Unmanned aerial systems (UAS)-based field high throughput phenotyping (HTP) as plant breeders’ toolbox: a comprehensive review. Smart Agricultural Technology, 100888.

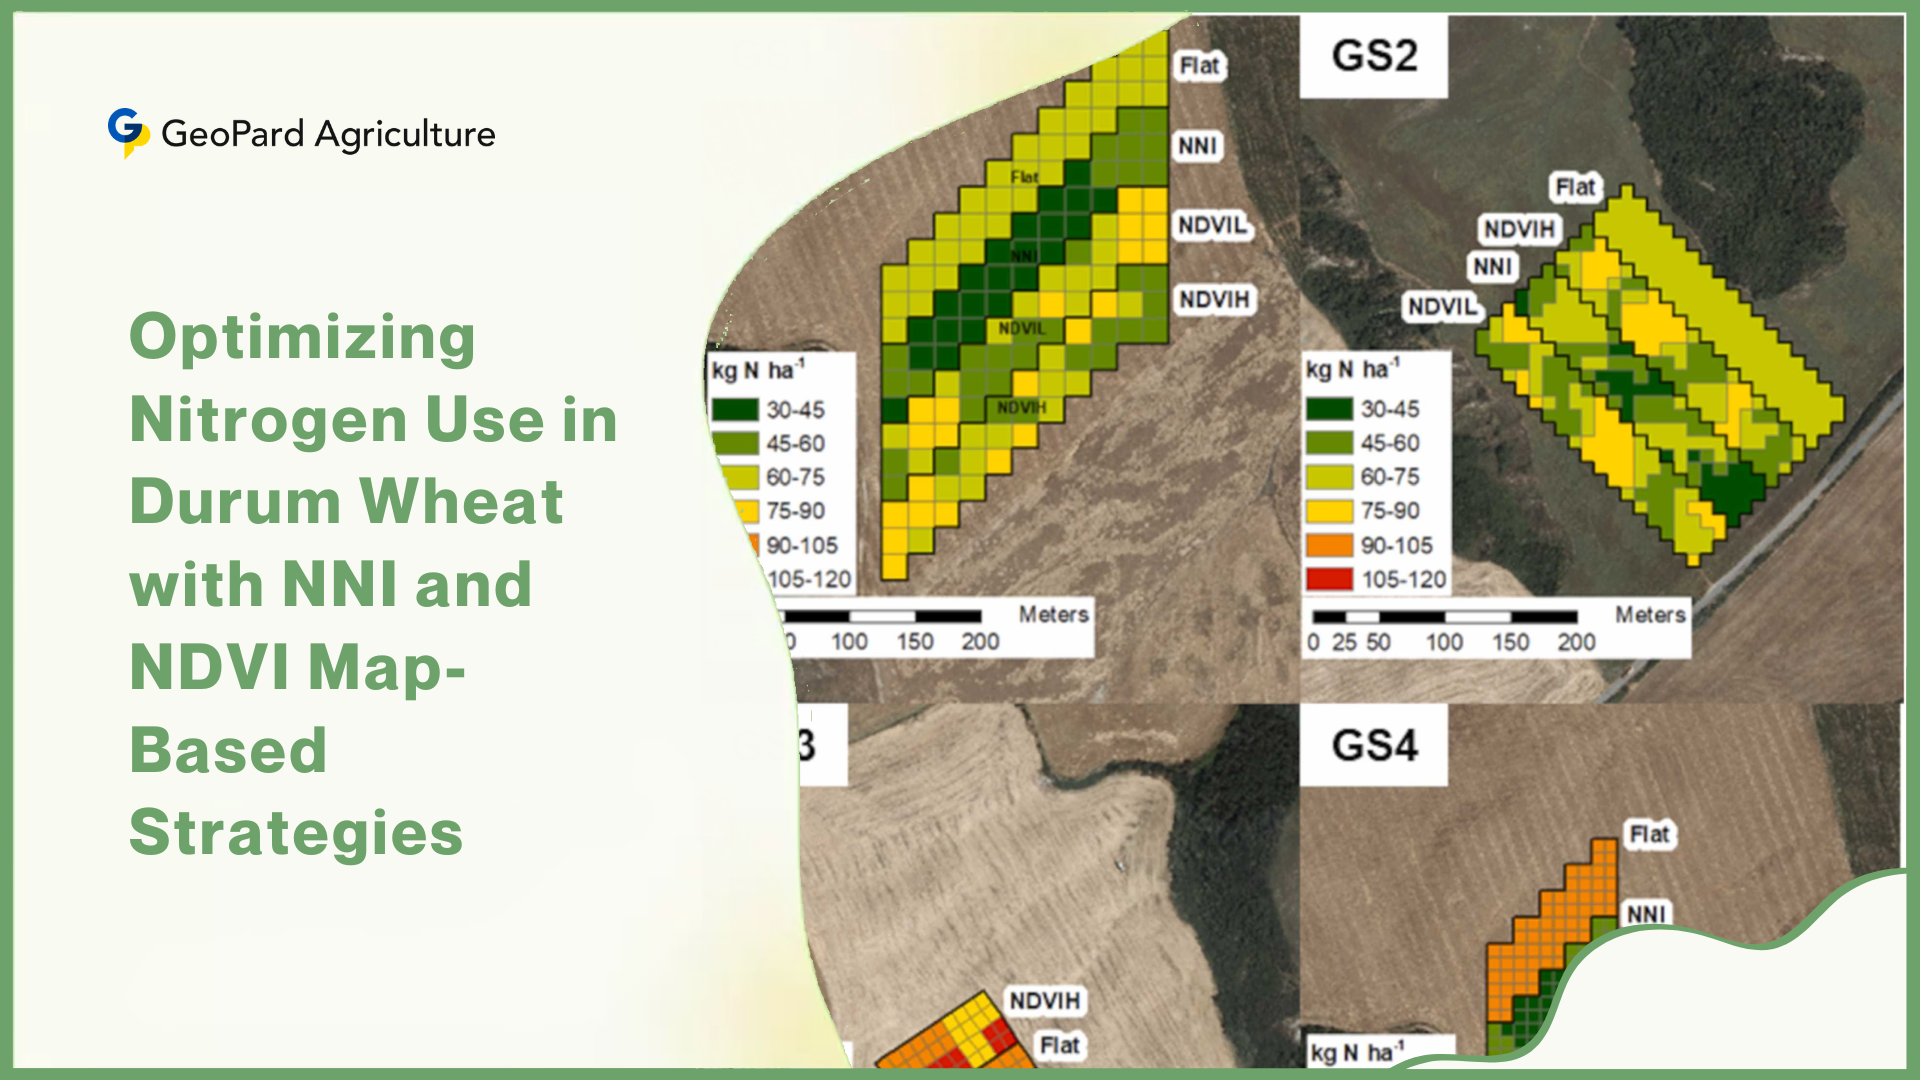
Optimizing Nitrogen Use in Durum Wheat with NNI and NDVI Map-Based Strategies

Durum wheat, a cornerstone of Mediterranean agriculture and a globally critical crop for pasta production, faces an urgent challenge: the unsustainable use of nitrogen (N) fertilizers.

While nitrogen is indispensable for maximizing yields, its excessive application has dire environmental consequences, including groundwater contamination, greenhouse gas emissions, and soil degradation.

A groundbreaking four-year study (2018–2022) conducted in Asciano, Italy, and published in the European Journal of Agronomy, sought to address this crisis by rigorously comparing conventional nitrogen management with advanced precision farming techniques.

The research focused on three satellite-guided strategies—Nitrogen Nutrition Index (NNI), proportional NDVI (NDVIH), and compensative NDVI (NDVIL)—against traditional uniform N application. The findings not only reveal a path to sustainable durum wheat cultivation but also quantify the economic and ecological trade-offs of each method with remarkable precision.

Methodology: Precision Farming Meets Satellite Technology

The experiment unfolded across four consecutive growing seasons in the rolling hills of Tuscany, a region emblematic of Mediterranean wheat farming. Researchers divided test fields into plots subjected to four distinct N management strategies.

The conventional “flat rate” approach followed regional agronomic guidelines, applying 150 kg of nitrogen per hectare annually. In contrast, the precision methods leveraged Sentinel-2 satellite imagery—a European Space Agency mission providing high-resolution (10-meter) multispectral data—to tailor N application spatially and temporally.

The NNI strategy stood apart by calculating real-time crop nitrogen status using a validated algorithm that integrates leaf area index and biomass estimates. NDVIH allocated N proportionally based on vegetation density (Normalized Difference Vegetation Index), while NDVIL adopted a compensative approach, funneling extra N to low-vegetation zones.

NNI Outperforms Conventional and NDVI-Based Strategies

Over the study period, the NNI method demonstrated unparalleled efficiency. It reduced nitrogen use by 20%, applying just 120 kg per hectare compared to the conventional 150 kg, while maintaining statistically equivalent grain yields of 4.8 tons per hectare versus 4.7 tons under flat-rate farming.

Protein content—a critical quality metric for durum wheat’s end-use in pasta—reached 13.2% with NNI, slightly outperforming the conventional method’s 12.5%.

This marginal gain in protein translated to significant industrial advantages: dough produced from NNI-optimized wheat exhibited a W-index (a measure of gluten strength) of 280, far surpassing the 240 observed in conventional wheat.

Such improvements stemmed from NNI’s ability to synchronize nitrogen availability with crop developmental stages, ensuring optimal nutrient partitioning during grain filling.

The Hidden Costs of NDVI-Based Approaches

The NDVI-based strategies, while innovative, revealed critical limitations. The proportional NDVIH approach, which allocated N based on canopy greenness, increased protein content to 13.8% but reduced yields to 4.5 tons per hectare—a 6% drop compared to NNI.

This paradox arose from over-fertilization in already nitrogen-rich zones, where excessive vegetative growth diverted energy from grain production.

The compensative NDVIL method, designed to boost struggling crop areas, achieved the highest yield (5.1 tons/ha) but at a steep environmental cost: it required 160 kg N per hectare, leading to a 33% surge in nitrous oxide emissions (1.4 kg CO2-equivalent per kg of grain) compared to NNI’s 0.8 kg.

These emissions matter profoundly—nitrous oxide has 265 times the global warming potential of carbon dioxide over a century.

Economically, NNI emerged as the clear winner. Farmers adopting this strategy achieved a net return of €220 per hectare, 12% higher than the conventional method’s €196. This advantage stemmed from two factors: reduced fertilizer costs (€98/ha vs. €123/ha) and premium pricing for high-protein grain.

The study introduced a novel “social cost” metric—a comprehensive measure of environmental damage, public health impacts from water pollution, and long-term soil degradation. NNI’s social cost totaled €42 per hectare, dwarfed by conventional farming’s €60. NDVIH and NDVIL posted intermediate costs of €58 and €55, respectively, reflecting their imbalanced nitrogen distribution.

Delving deeper into environmental metrics, nitrogen fertilizer use efficiency (NfUE)—the percentage of applied N converted into harvestable grain—reached 65% under NNI, a stark improvement over the 52% efficiency of conventional methods. This leap translated to an 18% reduction in nitrate leaching, protecting local aquifers from contamination.

Over the four-year study, fields under NNI lost just 12 kg of nitrogen per hectare annually to leaching, compared to 22 kg in conventional plots. For context, the EU’s Nitrates Directive mandates groundwater nitrate concentrations below 50 mg/L—a threshold exceeded in 30% of conventional plots but only 8% of NNI-managed areas.

Scaling NNI: Challenges and Policy Interventions

The research also illuminated hidden climate benefits. Using life cycle assessment (LCA) methodology, the team calculated that NNI’s carbon footprint totaled 0.8 kg CO2-equivalent per kg of grain, 33% lower than conventional farming’s 1.2 kg.

This reduction primarily stemmed from decreased fertilizer production emissions (1.2 kg CO2-eq/kg N avoided) and lower nitrous oxide releases from soils. If scaled across the EU’s 2.4 million hectares of durum wheat farmland, widespread NNI adoption could slash annual emissions by 960,000 metric tons of CO2-equivalent—equivalent to removing 208,000 cars from roads.

However, the study cautions against viewing precision agriculture as a panacea. The NNI method’s success hinges on continuous access to high-quality satellite data and advanced machinery capable of variable-rate application—infrastructure gaps in developing regions.

For instance, the Sentinel-2 satellites revisit each location every five days, but cloud cover during critical growth stages can disrupt data collection. Moreover, the algorithms require calibration to local conditions; in this study, NNI thresholds were fine-tuned to Mediterranean climates, achieving 92% accuracy in nitrogen status prediction.

Applying the model to arid regions or heavy clay soils without recalibration could reduce accuracy to 70–75%.

The human factor proves equally critical. Farmers transitioning to NNI need training to interpret spectral indices—for example, understanding that NDVI values above 0.7 often signal over-vegetation and warrant reduced N.

The research team estimates that a 10% increase in farmer literacy on precision tools could boost NfUE by 4–6 percentage points. Policy interventions will likely prove essential: subsidizing soil sensors, funding agronomist-led workshops, and incentivizing cooperatives to share machinery could democratize access.

Looking ahead, the study’s implications extend far beyond durum wheat. The NNI framework, when adapted to crops like maize or rice, could address the 60 million tons of excess nitrogen applied globally each year—a key target of the UN Sustainable Development Goals.

Preliminary trials in Spain’s barley fields show similar yield stability with 18% less N, suggesting cross-crop applicability. For researchers, integrating machine learning with satellite data presents a promising frontier: early models can now predict nitrogen demands with 95% accuracy 30 days pre-application, enabling proactive rather than reactive management.

Conclusion

In conclusion, this research transcends academic circles, offering a blueprint for reconciling agricultural productivity with planetary health.

By reducing nitrogen use by 20%, boosting farmer profits by 12%, and slashing greenhouse gas emissions by a third, the NNI method demonstrates that sustainability and profitability are not mutually exclusive. As climate change intensifies droughts and destabilizes growing seasons, such precision strategies will prove indispensable.

The challenge now lies in transforming this scientific validation into on-ground action—through policy reform, technological democratization, and a paradigm shift in how we view fertilizers: not as blunt tools, but as precision instruments in the quest for food security.

Reference: Fabbri, C., Delgado, A., Guerrini, L., & Napoli, M. (2025). Precision nitrogen fertilization strategies for durum wheat: a sustainability evaluation of NNI and NDVI map-based approaches. European Journal of Agronomy, 164, 127502.

Remote Sensing Revolutionizes Nicotine Monitoring in Cigar Leaves

A groundbreaking study leverages UAV hyperspectral imaging and machine learning to accurately assess nicotine levels in cigar leaves.

Recent advancements in aerial hyperspectral imaging, combined with machine learning, have revolutionized nicotine monitoring in cigar leaves. This cutting-edge approach enhances assessment accuracy while providing valuable insights for the tobacco industry, where chemical composition is critical to quality.

Led by Tian et al. at Sichuan Agricultural University, researchers sought to overcome the limitations of traditional manual quality checks, which often lack precision and efficiency. Their study, published on February 2, 2025, identifies strong correlations between nitrogen fertilizer use, moisture levels, and nicotine concentrations, underscoring the importance of timely and precise monitoring techniques.

The study was conducted from May to September 2022 at the university’s Modern Agricultural Research Base, where researchers used unmanned aerial vehicles (UAVs) equipped with hyperspectral cameras to capture leaf reflectance spectra from 15 different cigar leaf varieties under various nitrogen treatments.

Their findings revealed a direct correlation between nitrogen fertilizer application and nicotine levels in cigar leaves. “With the increase in the rate of application of nitrogen fertilizer, the nicotine content of cigar leaves increased,” the authors stated, highlighting the impact of agricultural practices on product quality.

To enhance the quality of hyperspectral image data collected by UAVs, the study employed preprocessing techniques such as multivariate scatter correction, standard normal transformation, and Savitzky-Golay convolution smoothing. Advanced machine learning algorithms, including Partial Least Squares Regression (PLSR) and Back Propagation neural networks, were then applied to develop predictive models capable of accurately estimating nicotine content.

The most effective model identified was the MSC-SNV-SG-CARS-BP model, which achieved a testing accuracy with R² values of approximately 0.797 and an RMSE of 0.078. “The MSC-SNV-SG-CARS-BP model has the best predictive accuracy on the nicotine content,” the authors noted, positioning it as a promising tool for future research and precision agriculture applications.

By utilizing remote sensing to analyze the spectral properties of cigar leaves, farmers and producers can assess crop quality swiftly and non-destructively, enabling more informed production and supply chain decisions. This approach offers extensive coverage at low operational costs while ensuring data consistency by reducing reliance on human factors.

The integration of hyperspectral imaging and machine learning has the potential to transform traditional tobacco cultivation, not only enhancing nicotine quality but also promoting sustainable and efficient agricultural practices. Researchers emphasize the need for continued advancements to refine these technologies and adapt them for different tobacco varieties and other crops.

Future studies will focus on optimizing UAV operational conditions to capture the highest-quality spectral data, considering variables such as flight altitude, lighting conditions, and noise reduction. Addressing these factors is crucial as agricultural practices evolve to meet market demands while prioritizing environmental sustainability.

This research highlights the synergy between technology and agricultural science, underscoring the growing adoption of innovative techniques to improve product quality. The researchers advocate for broader applications of hyperspectral sensing across agriculture, reinforcing the role of technology in enhancing yield, efficiency, and environmental responsibility.

Sources: https://www.nature.com/articles/s41598-025-88091-4

Remote Sensing Data Fusion Approach To Monitor Forest Degradation: A New Study

In the face of global climate change and increasing human activities, forests around the world are under threat from various pests, pathogens, and diseases. These threats compromise the health, resilience, and productivity of both natural forests and forest plantations.

Managing these issues effectively requires early detection and action, which is challenging over large areas. Recognizing the importance of this, researchers have developed new technologies based on Earth observation data to monitor and manage forest degradation.

A recent study introduces a machine learning-based approach for identifying damaged forests using open-source remote sensing images from Sentinel-2, supported by Google Earth data. This approach specifically focuses on boreal forests affected by the bark beetle, Polygraphus proximus Blandford.

The study utilized a combination of remote sensing images and machine learning algorithms to detect and assess forest damage. Here’s a brief summary of their methodology and findings:

  • Image Annotation and Algorithm Development: The researchers started by annotating images in channels that correspond to natural color perception (red, green, and blue) available on Google Earth. They then applied deep neural networks in two problem formulations: semantic segmentation and detection.
  • Experimental Results: Through their experiments, the researchers developed a model that quantitatively assesses changes in target objects with high accuracy. The model achieved an 84.56% F1-score, effectively determining the number of damaged trees and estimating the areas occupied by withered stands.
  • Integration with Sentinel-2 Images: The damage masks obtained from the high-resolution images were integrated with medium-resolution Sentinel-2 images. This integration achieved an accuracy of 81.26%, making the solution suitable for operational monitoring systems. This advancement offers a rapid and cost-effective method for recognizing damaged forests in the region.
  • Unique Annotated Dataset: Additionally, the researchers compiled a unique annotated dataset to identify forest areas damaged by the polygraph beetle in the study region. This dataset is invaluable for future research and monitoring efforts.

The early detection and quantification of forest degradation using this remote sensing data fusion approach hold significant promise for forest management and conservation strategies. By enabling timely action, such technologies can help limit the spread of damage and support sustainable forest management practices.

While the full paper detailing this research is yet to be published, this early abstract highlights the potential of integrating remote sensing data with advanced machine learning techniques to address the pressing issue of forest degradation. As these technologies continue to evolve, they will play a crucial role in safeguarding our forests against the growing threats posed by climate change and human activities.

Stay tuned for the complete publication of this groundbreaking research, which will undoubtedly provide further insights and applications in the field of forest management.

Source: https://www.frontiersin.org/journals/environmental-science/articles/10.3389/fenvs.2024.1412870/abstract

Mapping World’s Salted Soils Using Remote Sensing Technologies

A team of researchers has created a technique that measures the soil salt content across the globe with impressive precision, down to 10 meters. This improvement meets the critical need for accurate soil salinity evaluations, a major issue that affects agricultural productivity and soil health worldwide.

Soil salinity, a kind of land degradation, affects over 1 billion hectares across the globe, harming agricultural productivity and the health of the environment. Previous efforts to map soil salinity faced challenges due to the low detail of available datasets and difficulties in showing the continuous changes in soil salinity levels.

Acknowledging these challenges, the research team set out to create a model that uses Sentinel-1/2 images, climate data, terrain information, and advanced machine learning algorithms. Their aim was to estimate soil salt content in five climate regions.

The results were shared in a paper published on March 28, 2024, in the Journal of Remote Sensing. This research introduces an innovation that effectively combines angled spiral channels with periodic contraction-expansion arrays.

Global Soil Salinity Estimation at 10 m Using Multi-Source Remote Sensing

At the core of this effort lies the integration of data from various remote sensing technologies, notably the sophisticated Sentinel-1/2 satellites, coupled with the strategic utilization of machine learning algorithms. This approach has led to the development of an advanced model capable of accurately mapping soil salinity with remarkable precision—a resolution of 10 meters, even across diverse climates.

This groundbreaking method takes us far beyond the limitations of previous efforts, which were restricted by their lower resolution and narrower focus on analyzing soil saltiness. Our committed research team has compiled a vast dataset, encompassing global climate patterns, precise measurements of soil salinity at ground level, and a comprehensive array of geospatial variables.

By employing the Random Forest algorithm, the model excels not only in predicting soil salinity with remarkable accuracy but also sheds light on the pivotal roles that climate, groundwater levels, and salinity indices play in the formation of soil salinity landscapes. This advance marks a step forward in our ability to monitor and manage soil health on a global scale.

Professor Zhou Shi, the principal investigator, expressed, “This study represents a significant advancement in our capacity to assess and address soil salinity on a global scale. By integrating satellite imagery with machine learning, we can now pinpoint saline soils with unparalleled accuracy and granularity, providing invaluable insights for sustainable land and agricultural practices.”

The latest research has produced a high-resolution global soil salinity map. This map is a valuable tool for scientists, policymakers, and farmers alike. It helps them effectively tackle soil salinity issues. By pinpointing areas with high salinity, they can take targeted actions to restore soil health.

Additionally, it supports the implementation of sustainable agricultural practices and aids in planning resource management strategies. Moreover, the methodology employed in this research sets a new standard for environmental monitoring, with potential applications in other assessments of land degradation.


More information: Nan Wang et al, Global Soil Salinity Estimation at 10 m Using Multi-Source Remote Sensing, Journal of Remote Sensing (2024). DOI: 10.34133/remotesensing.0130

Automated Yield Data Cleaning and Calibration

Automated Yield Data Cleaning and Calibration (AYDCC) is a process that uses algorithms and models to detect and correct errors in yield data, such as outliers, gaps, or biases. AYDCC can improve the quality and reliability of yield data, which can lead to better insights and recommendations for farmers.

Introduction to Yield Data

Yield data is one of the most important sources of information for farmers in the 21st century. It refers to the data collected from various farm machinery, such as combines, planters, and harvesters, that measure the quantity and quality of crops produced in a given field or area.

It holds immense importance for several reasons. Firstly, it aids farmers in making informed decisions. Armed with detailed yield data, farmers can fine-tune their practices to maximize productivity.

For instance, if a specific field consistently produces lower yields, farmers can investigate the underlying causes, such as soil health or irrigation issues, and take corrective measures.

Furthermore, it enables precision agriculture. By mapping variations in crop performance across their fields, farmers can tailor their input applications, such as fertilizers and pesticides, to specific areas. This targeted approach not only optimizes resource use but also reduces environmental impacts.

According to the Food and Agriculture Organization (FAO), global agricultural production needs to increase by 60% by 2050 to meet the growing demand for food. Yield data, through its role in enhancing crop productivity, is instrumental in achieving this target.

Furthermore, in Brazil, a soybean farmer used yield data along with soil sampling data to create variable-rate fertilizer maps for his fields. He applied different rates of fertilizer according to the soil fertility and yield potential of each zone.

He also used yield data to compare different soybean varieties and select the best ones for his conditions. As a result, he increased his average yield by 12% and reduced his fertilizer costs by 15%.

Similarly, in India, a rice farmer also used yield datasets along with weather data to adjust his irrigation schedule for his fields. He monitored the soil moisture levels and rainfall patterns using sensors and satellite imagery.

understanding and utilization of yield data

He also used it to compare different rice varieties and select the best ones for his conditions. As a result, he increased his average yield by 10% and reduced his water use by 20%.

Despite its benefits, yield data still faces some challenges in terms of its development and adoption. Some of these challenges are:

  • Data quality: Its accuracy and reliability depends on the quality of the sensors, the calibration of the machinery, the data collection methods, and the data processing and analysis techniques. Poor data quality can lead to errors, biases, or inconsistencies that can affect the validity and usefulness of the data.
  • Data access: The availability and affordability of yield data depend on the access to and ownership of the farm machinery, the sensors, the data storage devices, and the data platforms. Lack of access or ownership can limit the ability of farmers to collect, store, share, or use their own data.
  • Data privacy: Its security and confidentiality depends on the protection and regulation of the data by the farmers, the machinery manufacturers, the data providers, and the data users. Lack of protection or regulation can expose the data to unauthorized or unethical use, such as theft, manipulation, or exploitation.
  • Data literacy: The understanding and utilization of yield data depend on the skills and knowledge of the farmers, the extension agents, the advisors, and the researchers. Lack of skills or knowledge can hinder the ability of these actors to interpret, communicate, or apply the data effectively.
gathering datasets using farm machines like harvesters

Therefore, to overcome these challenges and realize the full potential of yield data, it is important to cleaning and calibrate the yield data.

Introduction to yield data cleaning and calibration

Yield data are valuable sources of information for farmers and researchers who want to analyze crop performance, identify management zones, and optimize decision-making. However, it often require cleaning and calibration to ensure their reliability and accuracy.

Calibrating the “YieldDataset” is a functionality that corrects the distribution of values in alignment with mathematical principles, enhancing the overall integrity of the data. It bolsters the quality of decision-making and renders the dataset valuable for further in-depth analysis.

GeoPard Yield Clean-Calibration Module

GeoPard made it possible to clean and correct yield datasets using its Yield Clean-Calibration module.

We’ve made it easier than ever to enhance the quality of your yield datasets, empowering farmers to make data-driven decisions that you can rely on.

GeoPard - Yield Cleaning & Calibration, similar to Field Potential zones

After calibration and cleaning, the resulting yield dataset becomes homogeneous, without outliers or abrupt changes between neighboring geometries.

With our new module, you can:

Select an option to proceed
  • Remove corrupted, overlapped, and subnormal data points
  • Calibrate yield values across multiple machines
  • Start calibration with just a few clicks (simplifying your user experience) or execute the associated GeoPad API endpoint

Some of the most common use cases of automated yield data cleaning and calibration include:

  • Synchronizing data when multiple harvesters have worked either simultaneously or over several days, ensuring consistency.
  • Making the dataset more homogeneous and accurate by smoothing out variations.
  • Removing data noise and extraneous information that can cloud insights.
  • Eliminating turnarounds or abnormal geometries, which may distort the actual patterns and trends in the field.

In the picture below, you can see a field where 15 harvesters worked at the same time. It shows how the original yield dataset and the improved dataset after calibration with GeoPard yield clean-calibration module look quite different and easy to understand.

difference between the original and improved yield datasets with GeoPard's Calibration Module

Why is it important to clean and calibrate?

Yield data are collected by yield monitors and sensors that are attached to harvesters. These devices measure the mass flow rate and moisture content of the harvested crop, and use GPS coordinates to georeference the data.

However, these measurements are not always accurate or consistent, due to various factors that can affect the performance of the equipment or the crop conditions. Some of these factors are:

1. Equipment variations: Farm machinery, such as combines and harvesters, often have inherent variations that can lead to discrepancies in data collection. These variations might include differences in sensor sensitivity or machinery calibration.

For example, some yield monitors may use a linear relationship between voltage and mass flow rate, while others may use a nonlinear one. Some sensors may be more sensitive to dust or dirt than others. These variations can cause discrepancies in yield data across different machines or fields.

Example 1 U-turns, Stops, Half Equipment Width Used
Example 2 U-turns, Stops, Half Equipment Width Used

2. Environmental factors: Weather conditions, soil types, and topography play significant roles in crop yields. If not accounted for, these environmental factors can introduce noise and inaccuracies into yield data.

For instance, sandy soils or steep slopes may cause lower yields than loamy soils or flat terrains. Likewise, areas with higher crop density may have higher yields than areas with lower density.

3. Sensor inaccuracies: Sensors, despite their precision, are not infallible. They may drift over time, providing inaccurate readings if not regularly calibrated.

For example, a faulty load cell or a loose wiring may cause inaccurate mass flow rate readings. A dirty or damaged moisture sensor may give erroneous moisture content values. A wrong field name or ID entered by the operator may assign yield data to the wrong field file.

These factors can result in yield datasets that are noisy, erroneous, or inconsistent. If these data are not cleaned and calibrated properly, they can lead to misleading conclusions or decisions.

For example, using uncleaned yield data to create yield maps may result in false identification of high- or low-yielding areas within a field.

Why is it important to clean and calibrate yield dataset

Using uncalibrated yield datasets to compare yields across fields or years may result in unfair or inaccurate comparisons. Using uncleaned or uncalibrated yield data to calculate nutrient balances or crop inputs may result in over- or under-application of fertilizers or pesticides.

Therefore, it is essential to perform yield data cleaning and calibration before using them for any analysis or decision-making purpose. Yield datasets cleaning is the process of removing or correcting any errors or noise in the raw yield data collected by the yield monitors and sensors.

Automated methods for cleaning and calibrating yield data

This is where automated data cleaning techniques come in handy. Automated data cleaning techniques are methods that can perform data cleaning tasks without or with minimal human intervention.

Configure the Calibrate step
Automated methods for cleaning and calibrating

Automated data cleaning techniques can save time and resources, reduce human errors, and enhance the scalability and efficiency of data cleaning. Some of the common automated data cleaning techniques for yield data are:

1. Outlier Detection: Outliers are data points that deviate significantly from the norm. Automated algorithms can identify these anomalies by comparing data points to statistical measures such as mean, median, and standard deviation.

For example, if a yield dataset shows an exceptionally high harvest yield for a particular field, an outlier detection algorithm can flag it for further investigation.

2. Noise Reduction: Noise in yield data can arise from various sources, including environmental factors and sensor inaccuracies.

Automated noise reduction techniques, such as smoothing algorithms, filter out erratic fluctuations, making the data more stable and reliable. This helps in identifying true trends and patterns in the data.

3. Data Imputation: Missing data is a common issue in yield data sets. Data imputation techniques automatically estimate and fill in missing values based on patterns and relationships within the data.

For instance, if a sensor fails to record data for a specific time period, imputation methods can estimate the missing values based on adjacent data points.

Hence, automated data cleaning techniques serve as the gatekeepers of data quality, ensuring that yield datasets remain a reliable and valuable asset for farmers worldwide.

Furthermore, there are lots of handy tools and computer programs that can automatically clean and adjust yield data, and GeoPard is one of them. The GeoPard Yield Clean-Calibration Module, along with similar solutions, is super important for making sure the data is accurate and reliable.

GeoPard - Yield Cleaning & Calibration - 3 harvesters

Conclusion

Automated Yield Data Cleaning and Calibration (AYDCC) is essential in precision agriculture. It ensures the accuracy of crop data by removing errors and enhancing quality, enabling farmers to make informed decisions. AYDCC addresses data challenges and utilizes automated techniques for trustworthy results. Tools like GeoPard’s Yield Clean-Calibration Module simplify this process for farmers, contributing to efficient and productive farming practices.

Applications of (GIS) Geoinformatics in Agriculture

Geoinformatics (GIS) bridges the gap between spatial data and agriculture decision-making, allowing farmers to optimize resource utilization while minimizing environmental impact. This technology-driven approach helps tailor precision agriculture practices to specific field conditions, thus increasing productivity and efficiency.

Geoinformatics in Agriculture

By analyzing precise spatial information, such as soil variability, moisture content, and pest distribution, farmers can make well-informed choices, ensuring that each area of their land receives the exact treatment it requires.

Recent data shows that this technology is widely used, with over 70% of farms using it in some capacity. Geospatial data integration is becoming a standard practice in decision-making processes across a range of industries, from small-scale subsistence farming to major commercial operations.

Farmers are able to keep an eye on their crops in real time using satellite photography and ground sensors. With less waste and a smaller negative influence on the environment, they may use this to apply water, fertilizer, and pesticides precisely where and when they are needed.

The CottonMap project in Australia uses geoinformatics to monitor water use, resulting in a 40% decrease in water consumption. Enhanced resource management minimizes environmental impact by reducing chemical runoff and over-irrigation.

geoinformatics in agriculture

Increased productivity aids global food security. By optimizing planting patterns using spatial data, farmers can achieve higher crop yields without expanding agricultural land.

What is Geoinformatics?

Geoinformatics, also known as geographic information science (GIScience), is a multidisciplinary field that combines elements of geography, cartography, remote sensing, computer science, and information technology to gather, analyze, interpret, and visualize geographical and spatial data.

It focuses on capturing, storing, managing, analyzing, and presenting spatial information in digital forms, contributing to a better understanding of the Earth’s surface and the relationships between various geographic features. It is a powerful tool that can be used for a variety of purposes, including:

1. Precision agriculture: It can be used to collect data on a variety of factors, such as soil type, crop yield, and pest infestation. This data can then be analyzed to identify areas of variability within a field. Once these areas have been identified, farmers can use GIS to develop customized management plans for each area.

2. Environmental monitoring: It can be used to monitor changes in the environment, such as deforestation, land use change, and water quality. This data can then be used to track the progress of environmental policies and to identify areas that need further protection.

3. Urban planning: Geoinformatics can be used to plan and manage urban areas. This data can be used to identify areas that are in need of development, to plan transportation networks, and to manage infrastructure.

4. Disaster management: It can be used to manage disasters, such as floods, earthquakes, and wildfires. This data can be used to track the progress of a disaster, to identify areas that have been affected, and to coordinate relief efforts.

what is Geoinformatics? Components of Geoinformatics

Components of Geoinformatics

These components work together to provide insights into various aspects of the Earth’s surface and its relationships. Here are the main components of geoinformatics:

  • Geographic Information Systems (GIS): GIS involves the use of software and hardware to collect, store, manipulate, analyze, and visualize geographic data. This data is organized into layers, allowing users to create maps, conduct spatial analysis, and make informed decisions based on spatial relationships.
  • Remote Sensing: Remote sensing involves the collection of information about the Earth’s surface from a distance, typically using satellites, aircraft, or drones. Remote sensing data, often in the form of imagery, can provide insights into land cover, vegetation health, climate patterns, and more.
  • Global Positioning Systems (GPS): GPS technology enables accurate positioning and navigation through a network of satellites. In GIS, GPS is used to collect precise location data, which is crucial for mapping, navigation, and spatial analysis.
  • Spatial Analysis: It enables the application of various spatial analysis techniques to understand patterns, relationships, and trends within geographic data. These techniques include proximity analysis, interpolation, overlay analysis, and network analysis.
  • Cartography: Cartography involves the creation of maps and visual representations of geographic data. It provides tools and methods to design informative and visually appealing maps that effectively communicate spatial information.
  • Geodatabases: Geodatabases are structured databases designed to store and manage geographic data. They provide a framework for organizing spatial data, allowing for efficient storage, retrieval, and analysis.
  • Web Mapping and Geospatial Applications: Geoinformatics has expanded into web-based mapping and applications, allowing users to access and interact with geographic data through online platforms. This has led to the development of various location-based services and tools.
  • Geospatial Modeling: Geospatial modeling involves the creation of computational models to simulate real-world geographic processes. These models help predict outcomes, simulate scenarios, and aid decision-making in various fields.

8 Applications and Uses of Geoinformatics in Agriculture

Here are some of the key applications and uses of GIS in agriculture:

1. Precision Farming

Precision Agriculture harnesses the power of Geographic Information Systems (GIS) to provide farmers with intricate insights into their fields. These insights range from detailed vegetation and productivity maps to crop-specific information.

The heart of this approach lies in data-driven decision-making, empowering farmers to optimize their practices for maximum yield and efficiency.

Uses of Geoinformatics in Agriculture

Through the generation of productivity maps, GeoPard Crop Monitoring provides a crucial solution for Precision Agriculture. These maps make use of historical information from prior years, enabling farmers to identify productivity patterns throughout their farms. Farmers can identify fruitful and unproductive locations by using these information.

2. Crop Health Monitoring

The significance of monitoring crop health cannot be overstated. The well-being of crops directly impacts yields, resource management, and the overall health of the agricultural ecosystem.

Traditionally, manual inspection of crops across expansive fields was arduous and time-consuming. However, with the advent of advanced technologies like GIS and remote sensing, a transformative shift has occurred, enabling precision monitoring on an unprecedented scale.

Geoinformatics aids in the early detection of potential issues affecting crop health. By analyzing remote sensing data and satellite imagery, farmers can identify stressors like nutrient deficiencies or disease outbreaks, allowing for targeted interventions.

3. Crop Yield Prediction

By integrating historical data, soil composition, weather patterns, and other variables, It enables farmers to predict crop yields with remarkable accuracy. This information empowers them to make informed decisions regarding planting, resource allocation, and marketing strategies.

zones 2019 yield data map

In the field of predicting crop yields, GeoPard has become a leading innovator. GeoPard has developed a trustworthy method that claims an excellent accuracy rate of over 90% by combining historical and current crop data obtained from satellites. This innovative approach is proof of how technology may revolutionize contemporary agriculture.

4. Livestock Monitoring With Geoinformatics

Spatial data from GPS trackers on livestock offers insights into animal movements and behavior. These tools empower farmers to pinpoint the exact location of livestock within the farm, ensuring efficient management and care.

Beyond location tracking, GIS agriculture tools provide a comprehensive view of livestock health, growth patterns, fertility cycles, and nutritional requirements.

The global market for precision agriculture, which includes livestock monitoring, is projected to reach a substantial valuation by the coming years. This trend underscores the transformative potential of GIS in optimizing livestock management.

5. Insect and Pest Control

Traditional methods, such as manual scouting of large fields, have proven both time-consuming and inefficient. However, the convergence of technology, specifically deep learning algorithms and satellite data, has brought about a revolution in pest detection and management.

Geoinformatics helps in creating pest distribution maps, enabling precise application of pesticides. By targeting specific areas, farmers can minimize chemical usage, reduce environmental impact, and protect beneficial insects.

GeoPard Crop Monitoring is an effective method for spotting a variety of threats, such as weed infestations and crop diseases. Potential issue regions are detected by the study of field-collected vegetation indices.

For example, a low vegetation index value in a particular location may be a sign of potential pests or diseases. This realization simplifies the procedure and eliminates the need for time-consuming manual reconnaissance of large fields.

6. Irrigation Control

GIS-driven data provides valuable insights into soil moisture levels, helping farmers make informed decisions regarding irrigation scheduling. This ensures water efficiency and prevents overwatering or drought stress.

The Importance of Variable Rate Irrigation

GIS technology for agriculture provides a potent toolbox for spotting crops that are under water stress. Farmers can learn more about the water state of their crops by using indices like the Normalized Difference Water Index (NDWI) or the Normalized Difference Moisture Index (NDMI).

The default component of GeoPard Crop Monitoring, the NDMI index, offers a scale from -1 to 1. Water shortages are indicated by negative values around -1, but waterlogging may be indicated by positive values close to 1.

7. Flooding, Erosion, and Drought Control

Flooding, erosion, and drought represent formidable adversaries that can inflict substantial damage on agricultural landscapes. Beyond physical destruction, these challenges disrupt water availability, soil health, and overall crop productivity. Effectively managing these threats is pivotal to ensuring food security, preserving natural resources, and fostering sustainable farming practices.

Geoinformatics aids in assessing landscape vulnerabilities to flooding, erosion, and drought. By analyzing topographical data, rainfall patterns, and soil characteristics, farmers can implement strategies to mitigate these risks.

8. GIS in Farming Automation

Geographic Information Systems (GIS) have transcended their traditional role as mapping tools to emerge as critical enablers in guiding automated machinery. This technology empowers various agricultural equipment, such as tractors and drones, with spatial data and precision navigation systems.

As a result, tasks that range from planting to spraying and harvesting can be executed with unprecedented accuracy and minimal human intervention.

GIS in Farming Automation

Imagine a scenario where a tractor is tasked with planting crops across a vast field. Equipped with a GPS system and GIS technology, the tractor utilizes spatial data to navigate along predetermined routes, ensuring consistent seed placement and optimal spacing. This precision not only enhances crop yield but also minimizes resource wastage.

Role of Geoinformatics in Precision Agriculture

It plays a critical role in precision agriculture by providing farmers with the data and tools they need to make informed decisions about crop management. It can be used to collect data on a variety of factors, such as soil type, crop yield, and pest infestation.

This data can then be analyzed to identify areas of variability within a field. Once these areas have been identified, farmers can use GIS to develop customized management plans for each area.

The use of geoinformatics in precision agriculture is growing rapidly around the world. In the United States, for example, the use of precision agriculture has increased by more than 50% in the past five years. And in China, the use of precision agriculture is expected to grow by more than 20% per year in the coming years.

Studies have revealed that precision application of inputs through Geoinformatics techniques can lead to yield increases of up to 15% while reducing input costs by 10-30%.

Furthermore, a study published in the journal Nature in 2020 found that using GIS to manage water irrigation in a wheat field resulted in a 20% increase in crop yield. Another study, published in the journal Science in 2021, found that using GIS to apply fertilizer more precisely in a corn field resulted in a 15% increase in crop yield.

It can also be used to create maps of crop yield. These maps can be used to identify areas of low yield, which can then be investigated to determine the cause of the problem. Once the cause of the problem has been identified, farmers can take corrective action to improve yields in those areas.

Role of Geoinformatics in Precision Agriculture

For example, farmers can use it to create maps of soil type and fertility. These maps can then be used to target fertilizer applications more precisely, which can help to improve crop yields and reduce the amount of fertilizer that is applied unnecessarily.

In addition to collecting and analyzing data, it can also be used to visualize spatial data. This can be helpful for farmers to see how different factors, such as soil type and crop yield, are distributed across a field. Visualization tools can also be used to help farmers communicate their findings to others, such as crop consultants or government officials.

The real-world applications of geoinformatics in precision agriculture are abundant. For instance, Variable Rate Technology (VRT) employs spatial data to deliver varying amounts of inputs like water, fertilizers, and pesticides across a field.

This approach ensures that crops receive the exact nutrients they need, optimizing growth and yield. In another instance, satellite imagery and drones provide valuable insights into crop health and disease detection, enabling prompt intervention.

GeoPard Crop Monitoring As An Example Of Agriculture GIS Software

It’s crucial to keep in mind that the GIS software used in agriculture can differ depending on its intended use. While some tools indicate soil moisture levels to aid with planting selections, others display crop varieties, yields, and distributions.

Even comparing the economics of logging against forestry can be done with the use of various applications. Each farmer or agriculture manager must therefore discover the ideal GIS solution that provides them with the information they need to make wise decisions on their land.

When it comes to field data, GeoPard’s Crop Monitoring platform has a number of advantages. It offers summaries of vegetation and soil moisture dynamics, historical vegetation and weather data, and precise 14-day weather forecasts.

GeoPard provides automated synchronization of crop monitoring

This platform provides capabilities like scouting to organize activities and exchange real-time information, as well as a field activity log for planning and monitoring operations, so it offers more than just GIS-based data.

Data from additional sources is also included in GeoPard’s Crop Monitoring. The Data Manager tool, for instance, incorporates machine data into the platform. It supports popular file formats as SHP and ISO-XML.

You can measure crop yield using data from field machines, compare it to fertilizer maps, examine fertilizer tactics, and create plans to increase yield. The organizations that agricultural enterprises collaborate with and themselves benefit greatly from this all-in-one platform.

Challenges in Precision Agriculture and Geoinformatics

The integration of Precision Agriculture and Geoinformatics introduces a host of policy implications and regulatory considerations. Governments worldwide grapple with devising frameworks that foster innovation while safeguarding data privacy, land use, and environmental sustainability.

For instance, regulations may govern the collection and sharing of spatial data, intellectual property rights for precision farming technologies, and ethical use of AI in agriculture.

In the European Union, the Common Agricultural Policy (CAP) acknowledges the role of digital technologies, including Geoinformatics, in enhancing agricultural productivity.

Financial incentives are provided to encourage farmers to adopt precision farming practices that align with environmental and sustainability goals. This example illustrates how policy can drive technology adoption for collective benefit.

However, the adoption of geoinformatics technologies in agriculture presents significant benefits, yet it’s accompanied by challenges, particularly for farmers of varying scales. Small-scale farmers often face financial limitations, lacking the resources for technology acquisition and training.

Larger operations encounter data management complexities due to the scale of their activities. Technical knowledge gaps are common, with both small and large farmers requiring training to effectively utilize geoinformatics tools.

Limited infrastructure and connectivity hinder access, especially in remote areas. Customization struggles arise, as solutions may not fit small farms or integrate seamlessly into larger operations.

Cultural resistance to change and concerns over data privacy affect adoption universally. Government policies, ROI uncertainties, and interoperability issues further impede progress.

Addressing these challenges will demand tailored strategies to ensure that geoinformatics benefits all farmers, regardless of scale.

Conclusion

The seamless integration of Geoinformatics into modern agriculture holds transformative potential. By harnessing the power of spatial data, farmers and agricultural stakeholders can make informed decisions, optimize resource utilization, and foster sustainable practices. Whether it’s predicting crop yields, managing water resources, or enhancing precision agriculture, GIS emerges as a guiding light, shaping a more efficient, resilient, and productive future for the world of farming.

LfL Leverages GeoPard Platform for Its Future Crop Farming Project

Agriculture today faces major challenges. It has to produce high-quality food and raw materials, but increasingly it also has to take into account requirements for the protection of soil, water, climate, and biodiversity.

The Bavarian State Research Center for Agriculture (LfL) has long been conducting research on these challenges and is now testing the GeoPard precision agriculture platform for its Future Crop Farming project.

Dmitry Dementiev, CEO and Co-Founder of GeoPard: “Traditional crop farming methods often face challenges such as inefficient resource management and limited access to real-time data. These factors can lead to suboptimal crop yields, increased costs, and environmental strain.”

GeoPard’s platform provides LfL with a centralized platform to visualize and analyze critical farming data. The platform’s user-friendly interface permits the combination of satellite data and experimental data from the field trial, simplifying complex data interpretation and empowering users to make informed choices that optimize productivity and sustainability.

The field was divided into sections to showcase a specific setup for the trial: LfL has implemented a strip intercropping system, i.e., the simultaneous cultivation of multiple crops in parallel strips in the same field.

These strips can subsequently be employed separately in equations for inputs (such as fertilizer and plant protection) and yield results, enabling the computation of overall field

profit. Moreover, the profits generated by individual crops and the possible impacts at the edges between strips can be assessed.

The collaboration between LfL and GeoPard through the Future Crop Farming project can move forward analysis tools for unconventional field structures.

By leveraging GeoPard’s advanced platform, it can complement its research results and create valuable visualizations for communicating insights from the project to the public.

With a focus on precision farming, productivity, and environmental stewardship, the innovative LfL project showcases the potential for a more sustainable future in crop farming.

PD Dr. Markus Gandorfer, Head of Digitalization and Project Lead at LfL: “It is a pleasure for us to work with the enthusiastic GeoPard team. Deeper insights into our strip-intercropping data enabled by the GeoPard tool are very valuable to us.”

About

Bavarian State Research Center for Agriculture (LfL) The Bavarian State Research Center for Agriculture (LfL) is the knowledge and service center for agriculture in Bavaria. The applied research of the LfL takes up issues of agricultural practice and provides applicable solutions for agricultural enterprises in various ways.

The interdisciplinary Future Crop Farming project is located in Ruhstorf a.d. Rott in southeastern Bavaria. More information about the project can be found on the project website: http://www.future-crop-farming.de

GeoPard Agriculture is a leading provider of precision farming software. The company was founded in 2019 in Cologne, Germany, and is represented globally. The company offers a range of solutions that help farmers to optimize their operations and increase yields.

With a focus on sustainability and regenerative economics, GeoPard Agriculture aims to promote precision farming practices around the world.

The company’s partners include such well-known brands as John Deere, Corteva Agriscience, ICL, Pfeifer & Langen, IOWA Soybean Association, Kernel, MHP, SureGrowth, and many others.

Utilizing GPS Technology to Optimize Cover Crop Cultivation

The agricultural industry is experiencing a big change, with the adoption of modern technologies like GPS systems becoming more common.

This is especially noticeable in how farmers grow cover crops. GPS technology is revolutionizing the way they manage their fields, helping them become more efficient and sustainable in their agricultural practices.

Cover crops, sometimes called green manure, are plants grown primarily to improve soil health rather than for harvest. They are usually cultivated during the off-season and provide benefits like controlling weeds, enhancing biodiversity, and boosting soil fertility.

Yet, growing cover crops can be laborious and time-consuming. That’s where GPS technology comes in handy.

Incorporating GPS technology into farming brings numerous advantages. Firstly, it allows precision farming, where farmers can use GPS coordinates to create precise maps of their fields.

This helps them closely monitor crop growth and soil conditions. By relying on data, they can apply fertilizers and pesticides more accurately, reducing waste and minimizing harm to the environment.

Moreover, GPS technology greatly boosts the efficiency of planting cover crops. Conventional methods may lead to uneven distribution of seeds, leaving some areas poorly covered.

With GPS-guided machinery, farmers can ensure even distribution across the entire field, promoting better growth and soil coverage. This not only enhances the effectiveness of the cover crops but also reduces the need for labor and resources.

Additionally, GPS technology enables farmers to implement more effective crop rotation strategies. With precise field mapping and crop growth tracking, they can optimize soil health and productivity through well-planned rotations. This can result in higher yields over time, further improving agricultural efficiency.

Moreover, GPS technology plays a vital role in monitoring and managing pests and diseases. It allows farmers to track the location and spread of these problems, enabling them to take targeted actions for control. As a result, the use of broad-spectrum pesticides can be reduced, promoting a healthier and more sustainable agricultural system.

GPS technology offers benefits beyond just individual farmers when it comes to cover crop cultivation. It has the potential to encourage sustainable and efficient agricultural practices on a global scale.

By reducing waste and making the best use of resources, GPS technology can play a significant role in meeting the rising global food demand in an environmentally friendly manner.

However, using GPS technology in agriculture poses challenges for many farmers, such as expensive upfront costs and a lack of technical know-how. To tackle these hurdles, it is crucial to offer support to farmers.

This can be achieved through financial incentives, training programs, and the development of user-friendly software and equipment, enabling them to make the most of this technology effectively.

In conclusion, using GPS technology in cover crop cultivation has the potential to significantly improve agricultural efficiency. It allows for precise farming, better seeding practices, effective crop rotation, and enhanced pest and disease management. By offering the right support and resources, farmers can take advantage of GPS technology to create a more sustainable and productive agricultural sector.

Automated Field Boundaries Detection Model for Precision Agriculture by GeoPard

GeoPard have completed a successful development of an automated field boundaries detection model using mutli-year satellite imagery, accurate cloud and shadow detection, and advanced proprietary algorithms, including deep neural networks.

The GeoPard field detection model has achieved a state-of-the-art accuracy of 0.975 on the Intersection over Union (IoU) metric, validated across diverse regions and crop types globally.

Check out these images to see the results in Germany (average field size is 7 hectares):

1 - Raw Sentinel-2 image

1 – Raw Sentinel-2 image

3 - Segmented field boundaries

2 – Super-resolution Sentinel-2 image by GeoPard (1 meter resolution)

2 - Super-resolution Sentinel-2 image by GeoPard

3 – Segmented field boundaries, 0.975 Intersection over union (IoU) accuracy metric, across multiple international regions and crop types.


Integration into our API and GeoPard application is coming soon. This automated and cost-effective method helps predict yields, benefits governmental organizations, and assists large landowners who often need to update field boundaries between seasons.

GeoPard’s approach utilizes multi-year crop vegetation trends using multi-factor analysis and crop rotation.


The model is accessible via the GeoPard API on a pay-as-you-go basis, offering flexibility without the need for costly subscriptions.


What is Field Boundaries Delineation?

Field boundaries delineation refers to the process of identifying and mapping the boundary of agricultural fields or parcels of land. It involves using various techniques and data sources to demarcate the limits of individual fields or agricultural plots.

Traditionally, field boundaries were delineated manually by farmers or landowners based on their knowledge and observations.

However, with advancements in technology, particularly in remote sensing and geographic information systems (GIS), automated and semi-automated methods have become increasingly prevalent.

One common approach is the analysis of satellite or aerial imagery. High-resolution images captured by satellites or aircraft can provide detailed information about the landscape, including the boundaries between different land parcels.

Image processing algorithms can be applied to these images to detect distinct features such as changes in vegetation type, color, texture, or patterns that indicate the presence of field boundaries.

Another technique involves using LiDAR (Light Detection and Ranging) data, which uses laser beams to measure the distance between the sensor and the Earth’s surface.

LiDAR data can provide detailed elevation and topographic information, allowing for the identification of subtle variations in terrain that may correspond to field boundaries.

Additionally, geographic information systems (GIS) play a crucial role in delineation of field boundaries.

GIS software allows for the integration and analysis of various data layers, including satellite imagery, topographic maps, land ownership records, and other relevant information. By combining these data sources, GIS can aid in the interpretation and identification of field boundaries.

The accurate delineation of field is essential for several reasons. It facilitates better management of agricultural resources, enables precision farming techniques, and supports the planning and implementation of agricultural practices such as irrigation, fertilization, and pest control.

Accurate field boundary data also assists in land administration, land-use planning, and compliance with agricultural regulations.

How it is useful?

It plays a crucial role in agriculture and land management, providing several benefits and importance supported by evidence and global figures. Here are some key points:

1. Precision Agriculture: Accurate field boundaries help in implementing precision agriculture techniques, where resources such as water, fertilizers, and pesticides are precisely targeted to specific areas within fields.

According to a report by the World Bank, precision agriculture technologies have the potential to increase crop yields by 20% and reduce input costs by 10-20%.

2. Efficient Resource Management: It enables farmers to better manage resources by optimizing irrigation systems, adjusting fertilization practices, and monitoring crop health. This precision reduces resource wastage and environmental impact.

The Food and Agriculture Organization (FAO) estimates that precision agriculture practices can reduce water usage by 20-50%, decrease fertilizer consumption by 10-20%, and reduce pesticide usage by 20-30%.

3. Land Use Planning: Accurate field boundary data is essential for land use planning, ensuring efficient utilization of available agricultural land. It allows policymakers and land managers to make informed decisions regarding land allocation, crop rotation, and zoning.

This can lead to increased agricultural productivity and improved food security. A study published in the Journal of Soil and Water Conservation found that effective land use planning could increase global food production by 20-67%.

4. Farm Subsidies and Insurance: Many countries provide agricultural subsidies and insurance programs based on field boundaries. Accurate delineation helps in determining eligible land areas, ensuring fair distribution of subsidies, and calculating insurance premiums accurately.

For instance, the European Union’s Common Agricultural Policy (CAP) relies on accurate field boundaries for subsidy calculations and compliance monitoring.

5. Land Administration and Legal Boundaries: Field boundaries delineation in agriculture is crucial for land administration, property rights, and resolving land disputes. Accurate maps of field boundaries help establish legal ownership, support land registration systems, and facilitate transparent land transactions.

The World Bank estimates that only 30% of the world’s population has legally documented rights to their land, highlighting the importance of reliable field boundary data for secure land tenure.

6. Compliance and Environmental Sustainability: Accurate field boundaries aid in compliance monitoring, ensuring adherence to environmental regulations and sustainable farming practices.

It helps identify buffer zones, protected areas, and areas prone to erosion or water contamination, enabling farmers to take appropriate measures. Compliance with environmental standards enhances sustainability and reduces negative impacts on ecosystems.

According to the FAO, sustainable farming practices can mitigate up to 6 billion tons of greenhouse gas emissions annually.

These points illustrate its usefulness and importance in agriculture and land management. The evidence and global figures presented support the positive impacts it can have on resource efficiency, land use planning, legal frameworks, environmental sustainability, and overall agricultural productivity.

In summary, field boundaries delineation in agriculture is the process of identifying and mapping the boundary of agricultural fields or parcels of land. It relies on various techniques such as satellite imagery analysis, LiDAR data, and GIS to accurately define and demarcate these boundaries, enabling effective land management and agricultural practices.

wpChatIcon
wpChatIcon

    Request Free GeoPard Demo / Consultation


    By clicking the button you agree our Privacy Policy. We need it to reply to your request.

      Subscribe


      By clicking the button you agree our Privacy Policy

        Send us information


        By clicking the button you agree our Privacy Policy