
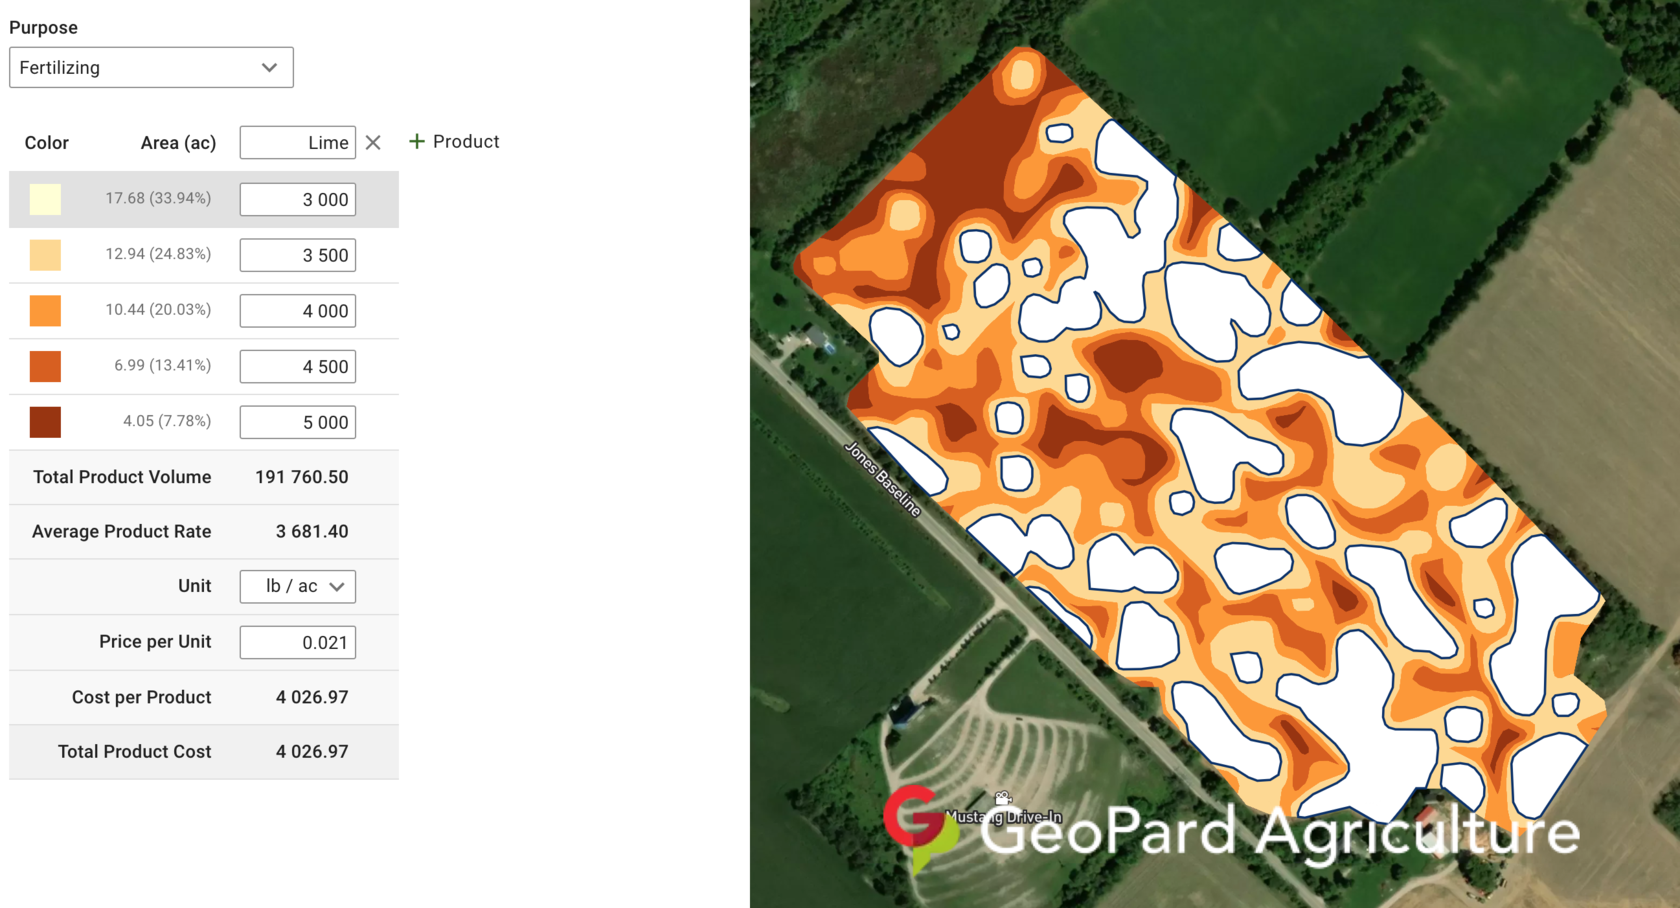


Soil pH mapping turns a stack of lab samples into a field-wide picture of where acidity is holding back yield, and that picture is what makes variable-rate lime pay. Instead of one blanket rate across a field where pH runs from 5.3 in one corner to 6.9 in another, you put lime on the acres that need it and skip the acres already in range. Timing matters as much as the map: fall after harvest is the natural lime window, and the sampling that feeds the map has to happen first. If you are reading this in August, the clock for this cycle starts now.
What soil pH mapping actually shows
A single composite sample per field reports one average, and averages hide the problem. On most fields with mixed soil types, pH varies by a full point or more within the boundary. The average might read 6.2 while a third of the field sits below 5.6, where aluminum limits roots and phosphorus availability drops.
A pH map replaces that average with a surface. Each lab sample keeps its location, and the acid pockets show up as shapes you can act on: a sandy ridge that leaches faster, a low corner that was never corrected.
University extension guidance, such as Penn State Extension’s overview of soil acidity and aglime, puts corn and soybean in the 6.0 to 6.5 range and alfalfa at 6.5 to 6.9. The map shows which parts of the field are below target and by how much. Buffer pH from the same lab report then tells you how much lime it takes to move each zone, because two soils at the same water pH can need very different rates.
Two sampling approaches feed a usable map:
- Grid sampling at one sample per 1 to 2.5 acres. More samples, more cost, but the map stands on its own.
- Zone sampling with 3 to 5 samples per management zone, where zones come from yield history, soil type, or an EC scan. Cheaper, and it works when the field already has clear zone structure.
If you are weighing the two, the comparison of random, grid, and zone-based soil sampling walks through where each approach earns its cost. Either way, keep sampling depth consistent from cycle to cycle: pH stratifies near the surface in reduced-tillage systems, and cores pulled at different depths do not compare cleanly.
Why fall is the window for variable-rate lime
Lime is slow. Aglime reacts with soil acidity over months, not days, so the application that protects next season’s crop is the one made this fall. Spreading after harvest gives the lime the whole winter to start moving pH before the next crop puts roots down.
Fall also wins on logistics:
- Fields are open, so the spreader is not fighting a standing crop or a planting deadline.
- Ground is usually firm enough to carry a loaded spreader without rutting.
- Where fall tillage is planned, incorporation mixes lime into the root zone and speeds the correction.
- Custom applicators have more capacity in October than in April.
Work the calendar backwards and August is not early. Sampling happens right after harvest, the lab needs one to two weeks, and the spreading window closes when the ground freezes or turns wet. Planning now keeps the chain inside one season; the automated soil sampling planning workflow lays out the points before the combine rolls.
How to build a variable-rate lime plan from pH data
The path from lab report to spreader is shorter than most people expect. In GeoPard it looks like this:
- Import the lab results as a CSV or shapefile with the sample coordinates attached. To inspect the raw points first, the GeoPard Field Data Explorer lets you drag the file in and see the pH pattern on the map; the data stays in your browser.
- Create management zones from the pH surface. Three zones is a practical start: below 5.6, 5.6 to 6.0, and above 6.0. More zones only help if the spreader can follow the rate changes.
- Assign a lime rate to each zone from buffer pH and your local recommendation tables. A typical spread is 0 on the in-range zone, 1 to 2 tons per acre on the middle zone, and 3 to 4 tons per acre on the strongly acidic zone.
- Export the prescription in the format your terminal reads, or send it through John Deere Operations Center if the spreader is connected there.
- After application, keep the as-applied file. It is your record for the next sampling cycle and the fastest check that the spreader hit the rates.
The variable-rate lime tutorial walks the same five steps screen by screen.
Before anything goes on the field, validate the rates with your agronomist or retailer against local recommendations, the lime source’s effective neutralizing value, and your crop plan. The map says where; local knowledge says how much.

How much lime does variable-rate application actually save?
Independent multi-year studies on fields with real pH variability land in the same band: variable-rate lime cuts total tonnage by roughly 10 to 30 percent versus a blanket rate while putting more lime on the under-treated zones.
Simple math on a 160-acre field makes the logic concrete. A blanket 2 tons per acre is 320 tons. If the map shows a quarter of the field needs 3.5 tons, half needs 1.5 tons, and a quarter needs nothing, the prescription totals about 260 tons. At 35 to 45 dollars per ton applied, that is roughly 2,100 to 2,700 dollars kept on a single application.
The savings are only half of the return. Correcting the zones below 5.6 usually produces a yield response worth more than the lime moved off the in-range acres, because those acres were quietly capping yield every season. And since lime goes on every 3 to 4 years, one sampling investment of about 8 to 12 dollars per acre serves the whole cycle.
One honest caveat: on a genuinely uniform field, variable rate saves little, and the map tells you that before you spend the money.
Common mistakes that undermine a pH map
- Sampling too coarse. One sample per 5 acres smooths out the acid pockets you are looking for.
- Ignoring buffer pH. Water pH tells you whether to lime; buffer pH tells you how much. Rates set from water pH alone routinely miss by a ton per acre.
- Mixing sampling depths between cycles, which makes trend comparisons meaningless.
- Letting the map go stale. Resample on the same 3 to 4 year cycle you apply on.
- Prescribing rate changes the spreader cannot follow. Check the machine’s minimum and maximum rates and section width, then design zones to match.
- Waiting until spring. A spring application still helps, but it forfeits the winter reaction time and competes with planting for machine hours.
Soil pH mapping FAQ
How many samples do I need for a reliable pH map?
Grid sampling at one sample per 1 to 2.5 acres is the common standard. With zone sampling, 3 to 5 samples per zone is enough if the zones come from solid layers such as yield history or an EC scan.
Is it too late to start if I have not sampled yet?
Not if you move now. Lay out the sampling plan in August, pull cores right after harvest, and the lab report comes back with weeks of spreading season left. What kills a fall application is usually a sampling plan that never got made, not lab turnaround.
Can I use variable-rate lime with my existing spreader?
Most rate-controller-equipped spreaders handle it. Check that your terminal reads standard prescription formats, or route the file through John Deere Operations Center. If the spreader only does flat rates, a per-zone flat rate driven as separate passes still captures most of the benefit.
Fertilizer






 English
  German
  Ukrainian
  French
  Kazakh
  Portuguese
  Spanish
  Arabic
  Swedish
  Serbian
  Romanian
  Norwegian
  Finnish
  Lithuanian
  Estonian
  Latvian
  Croatian
  Slovenian
  Slovak
  Japanese
  Polish