
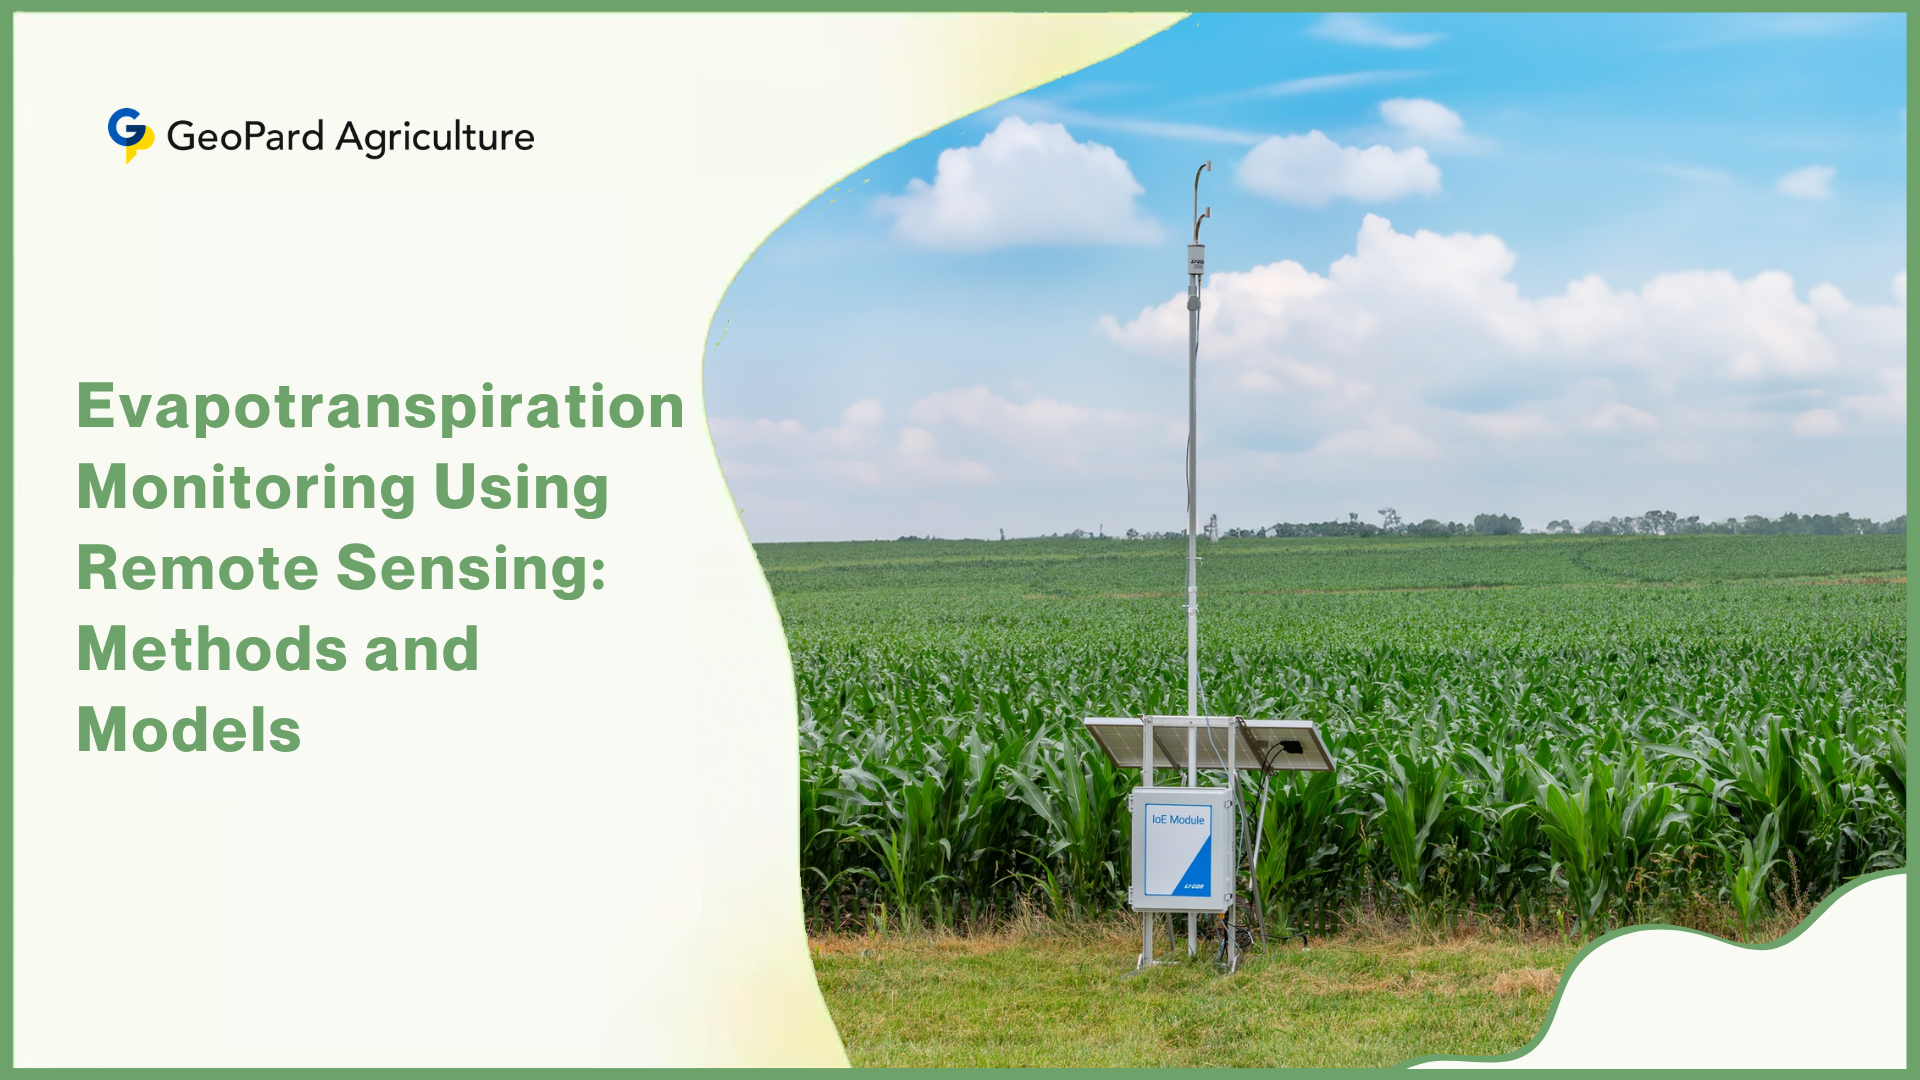


Evapotranspiration monitoring with remote sensing represents one of the most consequential advances in agricultural water science of the past two decades. By combining satellite-derived thermal data, vegetation indices, and energy balance physics, scientists and farmers can now estimate how much water leaves the land surface across millions of hectares — without a single ground-based sensor.
This capability is transforming how agronomists schedule irrigation, how governments track drought, and how researchers quantify the water footprint of entire river basins. Agriculture consumes roughly 70% of all global freshwater withdrawals, yet most of this water is never directly measured at the field level — a critical gap that evapotranspiration monitoring with remote sensing is rapidly closing.
What Is Evapotranspiration?
Evapotranspiration (ET) is the combined process through which water moves from the land surface into the atmosphere. It has two components working simultaneously: evaporation, the direct conversion of liquid water from soil, water bodies, and plant surfaces into water vapor; and transpiration, the biological movement of water absorbed by plant roots, transported upward through the stem, and released as vapor through tiny pores in leaves called stomata.
Together, these two processes account for the largest flux of water leaving a terrestrial ecosystem. In most agricultural landscapes, ET returns between 60 and 80 percent of all precipitation back to the atmosphere. That figure makes ET the dominant variable in the land water balance — more influential than runoff or deep percolation in most cropped environments.
ET sits at the center of the hydrological cycle, linking the land surface, the biosphere, and the atmosphere. When ET rates are high, soil moisture depletes faster, river baseflows decline, and aquifer recharge rates drop. When ET slows — due to drought stress, crop senescence, or land-use change — the consequences ripple through water availability downstream.
In climate science, ET is a primary coupling mechanism between the carbon and water cycles. Plants open their stomata to absorb CO2 for photosynthesis, and in doing so, they simultaneously release water vapor. Any change in global vegetation cover, temperature, or CO2 concentration shifts the planetary ET balance and feeds back into regional precipitation patterns.
Why Monitoring Evapotranspiration Is a Water Management Priority?
Precise ET data drives better decisions across multiple sectors. In agriculture, knowing actual crop water use at the field level tells an irrigation manager exactly how much water to apply, when to apply it, and where deficits are developing before visible stress appears in the crop.
This precision prevents both over-irrigation, which wastes water and leaches nutrients, and under-irrigation, which suppresses yield.
1. Irrigation scheduling: ET-based irrigation scheduling replaces guesswork with physics. When a farmer knows that a corn field in July is losing 7 mm of water per day to ET, they can replenish that exact deficit rather than irrigating on a fixed calendar interval.
2. Drought monitoring: A sustained drop in actual ET relative to the reference ET (what would evaporate under unlimited water supply) signals emerging drought stress. Remote sensing captures this signal weeks before yield loss becomes visible to the eye.
3. Water resource planning: Basin-level water accounting requires ET data at the watershed scale. Satellite ET monitoring provides this spatial coverage at a fraction of the cost of a ground station network.
4. Climate change assessment: Long-term ET trends reveal how warming temperatures and shifting precipitation patterns are altering ecosystem water use — data that informs adaptation planning at the regional and national level.
5. Ecosystem health monitoring: Wetland ET rates, forest transpiration, and grassland water use all respond sensitively to ecological disturbance. Remote sensing ET catches these changes across large, inaccessible landscapes.
What Factors Influence Evapotranspiration?
Evapotranspiration (ET) is shaped by a combination of climate conditions, landscape characteristics, and plant biology. Below is a breakdown of the key factors involved.
1. Soil Type. Soil composition plays a significant role in water retention and evaporation. Sandy or gravelly soils tend to hold less water and release more of it through evaporation, whereas loamy or clay-rich soils are better at retaining moisture.
2. Air Temperature. Temperature directly impacts ET rates. Warmer air has a greater capacity to hold moisture, and increased heat accelerates the conversion of water into vapor, thereby driving up evapotranspiration.

3. Solar Radiation. Beyond just generating heat, solar radiation involves variations in energy levels, frequency, and albedo — all of which influence ET. These factors differ by location and time of year, and accurately measuring them often requires advanced technology.
4. Humidity. Relative humidity (RH) refers to the amount of water vapor present in the air relative to its maximum capacity. When humidity is high, the air absorbs less additional moisture, slowing ET. Conversely, drier air can absorb more vapor, leading to higher evapotranspiration rates.
5. Plant Cover. Different plant species interact with water in distinct ways. Some store water efficiently during dry periods, while others lose it more rapidly. ET rates are also influenced by a plant’s age, health, and root depth — deeper roots allow crops to go longer without irrigation. These physiological differences mean ET can vary widely across crop types, requiring tailored irrigation strategies.
6. Wind Speed. Wind is a major driver of both evaporation and transpiration. It disperses the moist air layer that builds up over vegetation, increasing ET. It also aids vapor diffusion through plant pores, boosting transpiration. However, extremely strong, dry winds can sometimes hinder vapor diffusion, slightly reducing ET in certain conditions.
Key Concepts of Evapotranspiration
ET(0) reflects the atmosphere’s capacity to drive water loss and is purely climate-based. ET(c) measures water lost from healthy, well-irrigated crops growing under ideal conditions at their full yield potential. When crops face suboptimal management or environmental challenges, ET(c) must be modified to give ET(c adj). Crop evapotranspiration is understood through three distinct concepts:
- ET(0) — Reference Evapotranspiration
- ET(c) — Evapotranspiration under standard conditions
- ET(c adj) — Evapotranspiration under non-standard conditions
1. Reference Evapotranspiration — ET(0)
ET(0) represents the rate at which water evaporates from a well-watered reference surface — typically modeled as an idealized grass cover meeting specific criteria.
This measure captures the atmosphere’s evaporative demand independently of crop type, growth stage, or farming practices. Because the reference surface is assumed to be fully moistened, soil conditions are excluded from the calculation — eliminating the need to define separate ET thresholds for every crop at every growth stage.
ET(0) is driven entirely by climatic variables, and typical values vary across agroclimatic zones, though these figures serve only as general benchmarks.
2. Evapotranspiration Under Standard Conditions — ET(c)
ET(c) quantifies the water released by a healthy, well-nourished crop grown in large, adequately irrigated fields under favorable weather conditions, operating at peak productivity. It is derived by multiplying the reference ET by the crop coefficient K(c):
ET(c) = ET(0) × K(c)
3. Evapotranspiration Under Non-Standard Conditions — ET(c adj)
ET(c adj) accounts for real-world deviations from ideal growing conditions. Factors such as pest and disease pressure, water deficit or excess, soil salinity, and poor soil fertility can cause actual crop water use to differ significantly from ET(c). A water stress coefficient K(s) is introduced alongside the crop coefficient to capture these effects:
ET(c adj) = ET(0) × K(c) × K(s)
Traditional Methods of Measuring Evapotranspiration
Before remote sensing, scientists measured ET through direct physical instrumentation. Each method works well at a specific scale but carries significant trade-offs that limit broad agricultural application. Some of the best ground-based ET measurement techniques are:
1. Lysimeter: A lysimeter (a large container filled with soil and growing crop, installed flush with the ground) measures ET by weighing the soil block over time. When precipitation is controlled and drainage is collected, the difference in mass between timesteps equals actual ET.
Lysimeters deliver the most accurate ET measurements available, but they cost hundreds of thousands of dollars per unit, cover only a few square meters, and cannot represent the spatial variability of a real field.
2. Eddy covariance system: The eddy covariance system measures ET by calculating the covariance between vertical wind speed and water vapor concentration above a canopy using fast-response sensors. It covers a “footprint” of several hundred meters to a few kilometers, making it far more representative than a lysimeter.
However, flux towers cost USD 50,000 to USD 300,000 to install and maintain, and the global FLUXNET network has only around 900 active sites — far too sparse to monitor agricultural ET at national scale.

3. Bowen ratio method: The Bowen ratio method estimates ET by measuring the ratio of sensible heat flux (heating the air) to latent heat flux (ET) using temperature and humidity gradients above the canopy. It is simpler than eddy covariance but requires homogeneous fetch conditions and cannot be used in complex terrain.
4. Weather station-based ET calculations using the FAO Penman-Monteith equation compute reference ET (ET0) from air temperature, humidity, wind speed, and radiation data. This method is widely used for irrigation scheduling but produces reference ET, not actual ET, because it assumes a well-watered reference crop rather than the actual crop in the field.
The central problem with all ground-based methods is scale. A single lysimeter represents a few square meters. A flux tower covers a few hundred hectares at best. But modern agricultural water management requires ET data at the field level across entire river basins — a spatial challenge that only remote sensing can address.
Fundamentals of Remote Sensing for ET Monitoring
Remote sensing, in the context of ET monitoring, is the acquisition and analysis of satellite- or aircraft-derived data to estimate the water flux leaving the land surface without physically touching that surface.
The approach works because plants and soils exchange energy with the atmosphere in ways that are detectable from space — particularly through the emission of thermal infrared radiation. When a plant transpires efficiently, it uses incoming solar energy to evaporate water rather than heating up. A canopy with adequate soil moisture stays relatively cool.
A water-stressed canopy, by contrast, closes its stomata to conserve water, and since less latent heat (ET) is consuming the incoming energy, the canopy surface temperature rises. This is the fundamental physical signal that thermal remote sensing captures.
Key Physical Principles Underpinning Satellite ET Estimation
The energy balance is the governing framework. At any land surface, the net radiation (Rn) arriving from the sun and atmosphere must equal the sum of three energy sinks: the soil heat flux (G), the sensible heat flux (H, which heats the air), and the latent heat flux (LE, which drives ET). Written as an equation: Rn = G + H + LE. By estimating Rn, G, and H from satellite data, the model derives LE — and therefore ET — as the residual.
1. Land surface temperature (LST) measured in the thermal infrared band is the primary observable used to estimate sensible heat flux H. A hotter surface transfers more heat to the air (high H), leaving less energy for ET (low LE). A cooler, well-irrigated surface has lower H and higher LE.
2. Vegetation indices like NDVI capture how much green, photosynthetically active plant material covers the surface, which controls transpiration rates. A dense, green canopy transpires more than bare soil or a sparse stand.
3. Net radiation is calculated from shortwave and longwave radiation fluxes, which remote sensing estimates from surface albedo, vegetation cover, and thermal emission data.
Satellite-based evapotranspiration monitoring is not a replacement for ground truth — it is the only tool that can deliver spatially continuous water use data at the scale where agricultural and hydrological decisions are actually made.
The advantage of remote sensing over ground methods is not just spatial coverage. Satellite data provides synoptic, repeatable measurements across highly heterogeneous landscapes — something no ground network could replicate at comparable cost.
Remote Sensing Data Sources for ET Estimation
Estimating ET from space requires combining data from multiple sensor types. No single satellite provides all the inputs a complete ET model needs, so operational ET products typically fuse data from several platforms.
1. Satellite Platforms for ET Estimation
i. Landsat (USGS/NASA) has operated continuously since 1972 and provides 30-meter spatial resolution multispectral and thermal imagery with a 16-day revisit cycle. Its long archive makes it indispensable for historical ET analysis and crop monitoring. Most energy balance ET models — including SEBAL and METRIC — were originally designed around Landsat data.
ii. Sentinel-2 (ESA) offers 10-meter multispectral imagery with a 5-day revisit time for high-resolution vegetation index computation. While it carries no thermal band, it complements Landsat by providing more frequent, higher-resolution NDVI, EVI, and LAI data for vegetation-based ET models.
iii. MODIS (Moderate Resolution Imaging Spectroradiometer, NASA) provides daily global coverage at 250m to 1km resolution. Its coarser spatial resolution limits field-scale application but makes it ideal for continental and global ET monitoring through products like MOD16.
iv. ECOSTRESS (NASA) is mounted on the International Space Station and delivers thermal infrared data at 70-meter resolution with a 1-to-5-day revisit cycle. ECOSTRESS was specifically designed to measure crop water stress and ET at near-field scale — a capability gap that MODIS and earlier satellites could not fill.
v. VIIRS (Visible Infrared Imaging Radiometer Suite, NOAA/NASA) on the Suomi NPP and JPSS satellites continues the global daily coverage legacy of MODIS with improved sensor calibration, supporting operational ET products at regional to global scales.
2. UAV and Drone-Based ET Observations
Unmanned aerial vehicles (UAVs, or drones) equipped with thermal cameras and multispectral sensors can map ET at sub-meter spatial resolution over individual fields. A drone-mounted thermal camera measures canopy temperature directly, and when combined with ground meteorological data, it produces ET maps at a resolution no satellite can match.
- Thermal imaging drones detect water-stressed plant areas within a field before any visible symptom appears, enabling variable-rate irrigation at intra-field scales.
- Multispectral sensors on drones compute NDVI and EVI at centimeter resolution, feeding crop-coefficient-based ET models for precise field scheduling.
- High-resolution ET mapping from UAVs is particularly valuable for specialty crops — tree fruits, vineyards, vegetables — where within-field variability is high and the cost of water stress is large.
Key Remote Sensing Variables Used in ET Monitoring
Each variable extracted from satellite data contributes a specific piece of the ET estimation puzzle. Understanding what each measures and why it matters helps practitioners select the right model and interpret results correctly.
1. Normalized Difference Vegetation Index (NDVI) is calculated as (NIR – Red) / (NIR + Red) using near-infrared and red band reflectance. It ranges from -1 to +1, with dense green vegetation typically scoring between 0.6 and 0.9. NDVI captures canopy density and greenness, which correlates directly with leaf area and transpiration capacity.

2, Enhanced Vegetation Index (EVI) adds a blue band to reduce atmospheric interference and soil background effects that degrade NDVI in densely vegetated or frequently cloudy regions. EVI is more sensitive than NDVI in high-biomass areas and is used in the MOD16 ET algorithm.
3. Leaf Area Index (LAI) quantifies the total one-sided leaf area per unit ground area. It directly controls transpiration by determining how much leaf surface is exchanging water vapor with the atmosphere. Satellite-derived LAI is a key input in many physically based ET models.
4. Surface albedo is the fraction of incoming solar radiation reflected by the surface. It controls how much solar energy the surface absorbs, which in turn determines how much energy is available to drive ET. A dark, wet soil has low albedo (absorbs more energy); a bare sand surface has high albedo (reflects more).
5. Soil moisture from microwave sensors constrains ET models by indicating whether sufficient water is available in the root zone to support transpiration demand. When soil moisture drops below a critical threshold, actual ET falls below the potential rate even if energy is available.
Bastiaanssen et al. (as reviewed in Frontiers in Remote Sensing, 2026) found that SEBAL, validated in more than 30 countries, achieves 85% accuracy for daily ET estimates and 95% accuracy for seasonal ET estimates at field scale.
A seasonal accuracy of 95% means crop water accounting across an entire irrigation district can be conducted reliably using only satellite data, eliminating the need for dense ground station networks.
Evapotranspiration Estimation Models
1. Energy Balance Models
Energy balance models calculate ET as the residual of the surface energy budget: ET = Rn – G – H. Each model differs in how it estimates sensible heat flux H, which is the most computationally demanding and error-sensitive component.
i. Surface Energy Balance Algorithm for Land (SEBAL) was developed by Bastiaanssen in 1998 and remains one of the most widely applied satellite ET models globally. SEBAL uses three core satellite-derived parameters: land surface temperature (T0), surface hemispherical reflectance (albedo r0), and NDVI.
To estimate sensible heat flux, SEBAL identifies two anchor pixels — the “hot pixel” (dry bare soil, where ET is near zero) and the “cold pixel” (well-watered crop, where ET is at its maximum) — and interpolates H across the scene relative to these extremes. This self-calibration feature makes SEBAL less sensitive to absolute calibration errors in meteorological inputs.
ii. Mapping Evapotranspiration at High Resolution with Internalized Calibration (METRIC) model builds on SEBAL but adds automated calibration against a reference ET calculated from a weather station. METRIC is better suited for regions with complete weather data networks and has been widely adopted for operational irrigation management in the western United States.
iii. Surface Energy Balance System (SEBS) uses turbulent flux theory to estimate sensible heat flux from satellite-derived LST, surface roughness, and wind speed. SEBS is more physically rigorous than SEBAL but requires additional input data, making it better suited for research than operational farm management.
The choice of ET model is not merely a technical decision — it is a decision about what question you are trying to answer. A basin-level water accounting exercise and a field-level irrigation scheduling tool require fundamentally different levels of spatial resolution and temporal frequency.
iv. Two-Source Energy Balance (TSEB) model treats the soil and canopy as two separate ET sources, each with its own temperature and energy balance. This approach is more accurate for sparse vegetation or mixed land covers where a single-source model may conflate soil evaporation with plant transpiration.
2. Vegetation Index-Based ET Models
Not all ET models require thermal imagery. Vegetation index-based models estimate ET through the crop coefficient approach (Kc x ET0), where the crop coefficient Kc is derived from NDVI or EVI, and reference ET (ET0) comes from a weather station. The FAO-56 methodology formalizes this approach and it is widely used for irrigation scheduling because it requires no thermal band data.
Machine learning models, including Random Forest, Artificial Neural Networks (ANNs), and deep learning architectures, are increasingly applied to ET estimation by learning complex non-linear relationships between satellite-derived inputs (LST, NDVI, albedo, LAI) and flux tower ET measurements.
A 2023 study published in Remote Sensing of Environment found that a Random Forest model trained on MODIS and meteorological inputs predicted daily ET with an R2 of 0.87 and RMSE of 0.51 mm/day across diverse biomes — competitive with traditional energy balance models but requiring far less parameterization effort.
A study published in Taylor and Francis Open (2021) found that the SEBAL algorithm, applied to Landsat 8 imagery over a corn-growing region in Adana, Turkey, produced ET estimates with a correlation coefficient of R = 0.91 against the FAO Penman-Monteith method and an RMSE of just 1.14 mm/day.
SEBAL’s accuracy at field scale means satellite-derived ET can replace or substantially reduce the need for expensive lysimeter installations in operational irrigation management systems.
Satellite-Based ET Products Available for Operational Use
Several global and regional ET products now translate remote sensing inputs into ready-to-use ET data layers. Practitioners no longer need to run their own energy balance models — they can access these pre-computed datasets directly.
1. MOD16 ET Product (NASA) uses MODIS data with a Penman-Monteith algorithm driven by MODIS land cover, LAI, EVI, and global reanalysis meteorological data. It delivers 8-day and monthly ET composites at 500-meter resolution globally. MOD16 is well-suited for landscape-scale studies but is too coarse for individual field management.
2. SSEBop (Simplified Surface Energy Balance operational) model, developed by USGS, simplifies the hot-pixel/cold-pixel calibration challenge of SEBAL by using pre-defined temperature boundaries derived from long-term climatological data. SSEBop runs operationally at 30-meter resolution using Landsat data and forms one of the six models within the OpenET ensemble.

3. OpenET platform, launched in 2021 and operated as a public-private collaboration led by NASA, USGS, California State University Monterey Bay, Environmental Defense Fund, and Desert Research Institute, delivers field-scale ET data at 30-meter resolution across the western United States.
A landmark study published in Nature Water in January 2024, comparing OpenET estimates against measurements from 152 ground-based flux sites, confirmed that OpenET achieves high accuracy for annual crops like wheat, corn, soy, and rice — particularly in arid regions where water scarcity makes irrigation precision most critical.
4. WaPOR portal (FAO) provides ET data for Africa and the Near East at 30-meter, 100-meter, and 250-meter resolution, specifically designed to support agricultural water productivity analysis in data-scarce developing regions.
5. GLEAM (Global Land Evaporation Amsterdam Model) separates ET into transpiration, bare soil evaporation, interception loss, and open-water evaporation components, driven by microwave soil moisture data and satellite vegetation products. It excels at partitioning the ET signal into biological and physical components.
Applications of Remote Sensing
1. Precision Irrigation and Crop Water Management
The most immediate application of satellite ET data is irrigation scheduling. When a farmer accesses weekly field-scale ET maps, they can calculate the irrigation deficit — the difference between actual ET and effective precipitation — and apply exactly that volume of water. This eliminates the chronic over-irrigation habit that wastes water without adding yield.
In California’s Sacramento-San Joaquin Delta, water resource managers are using OpenET to help farmers comply with state regulations requiring accurate water use reporting.
The high accuracy of satellite ET data for annual crops provides a legally defensible basis for water accounting that no ground-based method could provide at such spatial coverage.
A 2024 study published in Agricultural Water Management (Ott et al., 2024; Desert Research Institute) evaluated OpenET against metered irrigation data in Nevada groundwater basins.
In Diamond Valley, OpenET estimates showed only a 7% difference from metered water use data, demonstrating operational reliability for regulatory groundwater management.
A 7% margin of error at the basin scale means satellite ET data can substitute for expensive metering infrastructure in regions where groundwater is critically depleted.
2. Drought Assessment and Early Warning Systems
Drought monitoring is another high-impact application. The Evaporative Stress Index (ESI), derived from ECOSTRESS and MODIS thermal data, measures the ratio of actual ET to potential ET.
When the ESI drops significantly below 1.0, it signals that plants are experiencing water stress — a reliable early indicator of agricultural drought, often detectable 4 to 8 weeks before crop yield loss becomes measurable.
USDA’s National Drought Mitigation Center integrates satellite ET-based drought indices into operational drought monitoring maps used by state governments, crop insurance agencies, and emergency management authorities. This integration makes drought response faster and better targeted than calendar-based or precipitation-only approaches.
3. Water Resources Management at Basin Scale
Basin-scale water accounting requires knowing how much water leaves the land surface as ET across millions of hectares. This is exactly what satellite ET products like MOD16, GLEAM, and WaPOR provide at global scale.
- Reservoir management agencies use ET data to estimate catchment water yield — the difference between precipitation and ET — which determines how much water actually reaches rivers and reservoirs.
- Transboundary river basin authorities apply satellite ET to independently verify national water use reporting without requiring access to national ground data networks.
- Irrigation district managers use ET to track consumptive use by crop type across entire service areas, supporting equitable water allocation and regulatory compliance.
4. Environmental and Ecological Applications
Wetland ET monitoring with satellite data quantifies ecosystem water use in inaccessible marshes, peatlands, and estuaries where ground sensors cannot be deployed. Forest ET monitoring reveals how deforestation, reforestation, and wildfire alter the water balance of entire watersheds — critical data for forest carbon accounting and water supply planning.
Evapotranspiration is the invisible thread connecting every plant on Earth to the global water cycle. Remote sensing is the only tool we have to see it at the scale that matters for water governance.
Accuracy Assessment and Validation of Satellite ET Products
No ET product is useful without rigorous validation. The standard approach compares satellite ET estimates against measurements from eddy covariance flux towers — the most accurate available ground-truth for ET at landscape scale.
The global FLUXNET network provides open-access flux tower data from hundreds of sites across diverse biomes. ET product developers compare their model outputs against FLUXNET measurements to calculate statistical performance metrics including
- R2 (correlation coefficient),
- RMSE (root mean square error), and
- Bias (systematic over- or under-estimation).
Validation is performed separately for different land cover types, climate zones, and seasons, because ET model accuracy varies substantially across these conditions.
Energy balance models like SEBAL and METRIC generally perform best in semi-arid agricultural landscapes with clear skies. Performance degrades in humid tropical forests, complex mountainous terrain, and areas of frequent cloud cover.
The OpenET accuracy study published in Nature Water compared six ET models against measurements from 152 flux tower sites across the United States, finding that the OpenET ensemble achieved the strongest performance specifically for annual crops in arid western regions — the areas where irrigation management is most economically and ecologically critical.
Water managers in arid regions can deploy OpenET data with high confidence for irrigation compliance and water budget tracking, replacing expensive metering infrastructure.
Challenges in Remote Sensing ET Monitoring
Despite rapid progress, several technical and operational challenges limit the accuracy and applicability of satellite-based ET monitoring.
1. Cloud cover limitations: Optical and thermal remote sensing requires cloud-free conditions. In humid tropical regions or during monsoon seasons, persistent cloud cover can create data gaps of weeks to months, breaking the temporal continuity that irrigation management requires.
2. Spatial resolution constraints: MODIS, the most temporally frequent satellite, provides ET data at 500-meter resolution — too coarse for fields smaller than about 25 hectares. Landsat’s 30-meter resolution suits most agricultural fields but comes with a 16-day revisit cycle, which misses rapid changes in water stress.
3. Temporal resolution trade-offs: High spatial resolution (Landsat, Sentinel-2, ECOSTRESS) and high temporal resolution (MODIS, VIIRS) exist in an inverse relationship. Bridging this gap requires data fusion techniques.
4. Model assumptions in heterogeneous landscapes: Single-source energy balance models assume a uniform canopy, which breaks down in sparse vegetation, mixed cropping systems, or urban-agricultural interfaces where soil and plant temperatures diverge sharply.
5. Data availability in developing regions: Ground weather station data needed to constrain ET models is sparse across much of sub-Saharan Africa, South Asia, and Central Asia — exactly the regions where improved water management is most urgently needed.
Emerging Technologies and Future in ET Monitoring
Several converging technological developments are poised to dramatically expand the accuracy, coverage, and accessibility of remote sensing ET monitoring within the next five to ten years.
1. AI, Machine Learning, and Data Fusion
Deep learning models trained on large multi-sensor datasets are starting to outperform classical energy balance models in certain landscapes. Convolutional neural networks can integrate Landsat, Sentinel-2, MODIS, and meteorological reanalysis data simultaneously, learning spatial-temporal ET patterns that no single-sensor model captures.
Meanwhile, data fusion algorithms — most prominently the STARFM (Spatial and Temporal Adaptive Reflectance Fusion Model) approach — blend high-resolution Landsat imagery with daily MODIS data to produce synthetic daily ET maps at 30-meter resolution, effectively solving the spatial-temporal trade-off that currently limits precision agriculture applications.
2. High-Resolution Thermal Satellites and CubeSat Constellations
The next generation of dedicated thermal Earth observation satellites will deliver sub-30-meter thermal imagery with daily revisit frequency.
Planned missions including the Landsat Next successor and commercial CubeSat thermal constellations will eliminate the historical trade-off between spatial detail and temporal frequency that has constrained field-scale ET monitoring.
As the Future Market Insights report (2025) noted, the remote sensing services market — valued at USD 22.87 billion in 2025 — is projected to reach USD 84.28 billion by 2035, driven significantly by LEO satellite constellation expansion.
3. Digital Twins for Water Management
Digital twin frameworks — dynamic virtual replicas of agricultural landscapes that update in near-real-time from satellite and IoT sensor feeds — are integrating ET remote sensing as a core data stream. These systems synchronize satellite ET maps, soil moisture sensor data, weather forecasts, and crop growth models to simulate future field water status and prescribe irrigation automatically.
Software and Tools for ET Monitoring
A rich set of platforms now makes remote sensing ET analysis accessible to practitioners without deep programming expertise.
1. Google Earth Engine (GEE) is a cloud-based geospatial computing platform that hosts the complete Landsat, MODIS, Sentinel, and ECOSTRESS archives alongside pre-built ET algorithms. Analysts can run ET calculations across years of data for entire regions without downloading any imagery locally. GEE has become the dominant research platform for large-area ET mapping.
2. OpenET Platform provides a web interface where any registered user can access field-scale ET data for agricultural land across the western United States. Users can export daily, monthly, or seasonal ET summaries for individual fields or entire water management districts, with no programming knowledge required.
3. WaPOR Portal (FAO) provides a similar point-and-click ET download interface for Africa and the Near East, with direct links to agricultural water productivity indicators.
4. Python and R workflows using libraries such as rasterio, xarray, geopandas (Python) or terra, raster (R) allow researchers to build custom ET processing pipelines that integrate satellite data with local meteorological records, crop models, and irrigation databases.
Case Studies For Remote Sensing ET Monitoring
1. Irrigation Management in Arid Regions
In the High Plains Aquifer region of the United States — one of the most intensively irrigated agricultural zones on Earth — researchers from the Desert Research Institute demonstrated that OpenET data integrated with climate datasets could estimate groundwater pumping volumes with sufficient accuracy to support regulatory management of declining aquifer levels.
The study matched satellite ET estimates against metered pump records, finding less than 17% deviation in most study basins — an accuracy level sufficient for water rights administration.
2. Precision Agriculture Across Crop Types
Remote sensing ET monitoring has been implemented for cotton irrigation scheduling using SEBAL and METRIC models to map actual ET across individual fields during the growing season.
Studies published in the Astrophysics Data System (2020) showed that both models detected higher-than-expected actual ET during early crop stages due to high bare-soil evaporation — a finding that the standard crop coefficient approach systematically missed, leading to over-irrigation in that critical period.
3. Watershed-Scale Water Accounting
FAO’s WaPOR platform has been used to conduct water productivity analysis across irrigation schemes in Ethiopia, Egypt, and Jordan, quantifying ET per unit of crop biomass produced.
These analyses identified fields with water productivity below the basin average, providing the spatial evidence base for targeted extension programs to improve irrigation efficiency in underperforming areas.
Best Practices for Selecting an ET Monitoring Approach
Choosing the right combination of satellite data, ET model, and validation strategy depends on the specific question being answered, the available resources, and the acceptable level of uncertainty.
1. Define the spatial and temporal scale first. Basin-scale monthly water accounting requires a different tool than field-scale daily irrigation scheduling. Match the resolution and revisit frequency of the satellite platform to the management need before selecting any model.
2. Match the model to the landscape type. Energy balance models like SEBAL and METRIC work best in semi-arid, crop-dominated landscapes with clear skies. Vegetation index-based models work better in regions with limited thermal data availability. Machine learning models work best when large, locally validated training datasets are available.
3. Always validate locally. Even the most accurate global ET product should be validated against at least one local flux tower or lysimeter dataset before operational deployment. Performance metrics from published studies rarely transfer exactly to new locations and crop types.
4. Plan for cloud cover gaps. In humid or tropical regions, plan data fusion or gap-filling strategies from the outset. Relying on a single thermal satellite with a 16-day revisit cycle will produce unacceptable data gaps during critical crop growth periods.
5. Use open platforms where possible. Google Earth Engine, OpenET, and WaPOR provide access to validated, well-documented ET products at no cost. Building a custom ET model from scratch is rarely justified unless unique local conditions demand it.
6. Integrate ET data with existing farm management systems. ET data is most valuable when it feeds directly into irrigation scheduling software, decision support tools, or water accounting databases rather than existing as a standalone satellite output.
Conclusion
Evapotranspiration monitoring with remote sensing has evolved from an experimental research discipline into a critical operational tool for agricultural water management. The combination of increasingly accurate satellite ET products, open-access platforms like OpenET and WaPOR, and AI-powered data fusion is removing the barriers that once limited satellite ET monitoring to well-funded research institutions.
The current capabilities are substantial: energy balance models validated across 30 or more countries, satellite ET products achieving better than 90% seasonal accuracy for major annual crops, and cloud-based platforms that deliver field-scale ET data to any farmer or water manager with an internet connection. These capabilities are already being used to manage irrigation compliance on the Colorado River, to monitor groundwater depletion in the High Plains Aquifer, and to improve agricultural water productivity across Africa through the FAO WaPOR system.
Remote Sensing





 English
  German
  Ukrainian
  French
  Kazakh
  Portuguese
  Spanish
  Arabic
  Swedish
  Serbian
  Romanian
  Norwegian
  Finnish
  Lithuanian
  Estonian
  Latvian
  Croatian
  Slovenian
  Slovak
  Japanese
  Polish