Rice feeds more than 3.5 billion people globally, yet less than 60% of rice-growing areas have accurate, up-to-date cultivation maps, according to the International Rice Research Institute (IRRI) 2024 global rice atlas update. The mapping of rice-cropping pattern and cultural type using remote sensing is rapidly closing this gap by delivering spatially precise, temporally consistent data at scales that no ground survey can match.
From distinguishing irrigated double-cropped lowlands in Vietnam’s Mekong Delta to identifying rainfed single-season fields in sub-Saharan Africa, satellite and radar-based systems now provide the intelligence that farmers, governments, and food security agencies need to plan with confidence. As artificial intelligence and cloud computing accelerate data processing, near-real-time rice monitoring is expected to become the global standard by 2027.
Why Rice Matters and Why Its Monitoring Is Hard
1. Rice Production and the Global Food Security Equation
Rice is the primary caloric staple for more than half the world’s population, and its importance extends far beyond individual nutrition. Global rice production reached approximately 520 million metric tons of milled rice in 2024, according to FAO data, with Asia accounting for nearly 90% of that output.
Any significant disruption to rice supply, whether from drought, flood, pest outbreak, or policy failure, triggers rapid food price shocks that disproportionately affect the world’s poorest households.
Maintaining food security at this scale demands more than simply growing enough rice. It requires knowing precisely where rice is grown, how many times a year each field is cropped, and what farming practices are in use. Governments need this data to allocate irrigation infrastructure, subsidize inputs, and build emergency reserves.
The challenge is that rice is grown in extraordinarily fragmented landscapes, ranging from terraced hillsides in the Philippines to vast irrigated plains in China, making conventional field-by-field surveys logistically and financially impractical at national or regional scales.
2. The Need for Systematic Rice-Cropping Pattern Monitoring
Rice-cropping patterns, meaning the number of rice seasons grown per year and how they are distributed across a landscape, shift constantly. Climate variability shortens growing windows in some regions while expanding them in others. Economic signals push farmers from single to double cropping when water availability and market prices align.
Without systematic monitoring, planners work from census data that can be five or more years out of date, leading to chronic misallocation of water, fertilizer subsidies, and rural credit. Remote sensing offers a solution to this monitoring gap by delivering consistent, repeatable observations across entire countries in a matter of days.
Rather than relying on farmer self-reporting or enumerator surveys, satellite-based systems directly observe the landscape, capturing how rice fields change through flooding, transplanting, vegetative growth, and harvest across every season of the year.
3. What Remote Sensing Brings to Agricultural Mapping
Remote sensing is the science of acquiring information about objects or areas from a distance, typically using sensors mounted on satellites, aircraft, or unmanned aerial vehicles (UAVs). In agricultural contexts, sensors measure the energy reflected or emitted by crops, soil, and water at various wavelengths of the electromagnetic spectrum.
Because different land cover types reflect energy differently at different growth stages, satellite imagery can distinguish a rice field from a maize field, and a flooded transplanted rice plot from a dry direct-seeded one, with a precision that increases as sensor technology improves. The mapping of rice-cropping pattern and cultural type using remote sensing serves four interconnected goals.
- First, it produces spatially explicit inventories of where rice is grown at seasonal and annual timescales.
- Second, it classifies how many cropping cycles occur per year in each mapped area, distinguishing single, double, and triple-cropped systems.
- Third, it identifies the cultural practices used, such as whether a field is transplanted or direct-seeded, or whether water management is controlled or rainfed.
- Fourth, it generates baseline data that feeds into production forecasting, water budgeting, climate adaptation planning, and precision agriculture systems.
Understanding Rice-Cropping Systems and Cultural Types
1. What a Rice-Cropping Pattern Actually Means
A rice-cropping pattern describes the temporal arrangement of rice cultivation within a calendar year at a given location. It captures not just whether rice is grown, but how many times, when each season begins and ends, and what crop, if any, follows or precedes rice in the same field. Mapping these patterns across a region gives planners a dynamic picture of land use intensity and resource demand that a single snapshot could never provide.
2. Single-Crop Rice Systems
In single-crop (monocrop) systems, farmers grow one rice season per year, typically aligned with a monsoon rainy season or a single controlled irrigation cycle. These systems dominate in regions where water availability, labor, or climate limits the possibility of a second season.

Single-crop systems tend to have longer growing periods per season, often with traditional or improved long-duration varieties, and they are disproportionately rainfed, making them highly sensitive to rainfall timing and distribution.
3. Double-Crop Rice Systems
Double-crop systems produce two rice harvests per year from the same field. They are most common across Southeast and South Asia, including the Red River Delta in Vietnam, Bangladesh’s floodplains, and irrigated districts of India’s Punjab.
The temporal gap between the two seasons is narrow, often less than 30 days, so identifying double-crop areas from satellite data requires dense time-series observations to detect two full phenological cycles within a single year.
4. Triple-Crop Rice Systems
Triple cropping, with three rice harvests per year, is practiced in limited areas where both water availability and temperature remain favorable year-round. Southern Vietnam’s Mekong Delta and parts of Guangdong province in southern China support triple-crop systems.
While they maximize land use intensity, triple-crop systems carry significant soil fertility and pest management challenges. Remotely identifying these fields is technically demanding because the short fallow periods between crops compress phenological signals into tight windows.
5. Rainfed Rice Cultivation
Rainfed rice, grown entirely on precipitation without artificial water supply, accounts for approximately 45% of the total rice area globally, according to the International Rice Research Institute (IRRI). It is the dominant system across Sub-Saharan Africa, upland areas of South and Southeast Asia, and rain-dependent floodplains.
Rainfed systems are highly vulnerable to rainfall variability, which translates to yield fluctuations of 30-50% between wet and dry years in some regions. From a remote sensing perspective, rainfed rice is harder to map because the flooding signal is weaker and more irregular than in managed irrigated fields.
6. Irrigated Rice Cultivation
Irrigated rice systems receive water through canals, pumps, or managed reservoirs, enabling farmers to control planting and harvest timing with considerable precision. Irrigated rice currently occupies only about 55% of global rice area but contributes 75% of total rice production, reflecting the yield advantage of water security.
The deliberate flooding of irrigated paddies creates a strong and consistent radar backscatter signature that satellite sensors detect reliably, making irrigated rice among the most accurately mapped crop types in the world.
7. Upland and Lowland Rice Systems
Upland rice is grown on non-flooded, well-drained soils, often on hillsides or terraces in Asia and Africa. Because these fields are never intentionally flooded, they lack the water signal that makes lowland rice identifiable by radar, forcing researchers to rely on spectral vegetation patterns alone.
Lowland rice, by contrast, is grown in flat or shallow-flooded fields where water accumulates naturally or through irrigation. Lowland systems dominate Asia’s rice bowl regions and are the primary target of most large-scale mapping efforts.
The morphological contrast between upland and lowland fields, including field shape, topographic position, and canopy structure, provides supplementary spatial cues that object-based image analysis can exploit effectively.
8. Direct-Seeded vs. Transplanted Rice
Transplanted rice involves growing seedlings in a nursery for 25 to 30 days, then manually or mechanically moving them to the main field. Direct-seeded rice, in contrast, involves broadcasting or drilling seeds directly into the prepared field without a nursery stage.
These two methods produce measurably different temporal signatures in satellite data: transplanted fields show a sharp, synchronized green-up approximately three weeks after flooding, while direct-seeded fields show a more gradual canopy development from the day of seeding. This phenological difference, subtle but real, is detectable through careful time-series analysis of vegetation indices.
Remote Sensing Tools and Technologies for Rice Mapping
1. Physical Principle Behind Remote Sensing
Every plant reflects, absorbs, and transmits solar radiation in patterns governed by its leaf biochemistry, canopy structure, and water content. Green leaves strongly absorb red light for photosynthesis while reflecting a large fraction of near-infrared (NIR) energy. Flooded soils, by contrast, absorb almost all incoming radiation.
These contrasting responses create predictable spectral signatures that sensors on satellites can record with consistent timing, enabling analysts to track crop condition, growth stage, and field-level management decisions without ever visiting the field.
2. Optical Remote Sensing
Optical sensors detect reflected solar radiation, producing imagery that closely resembles what the human eye would see if extended into infrared wavelengths. Three optical platforms dominate rice mapping research.
Landsat (a series of satellites operated by NASA and USGS since 1972) provides imagery at a 30-meter spatial resolution with a 16-day revisit cycle. Its long temporal archive makes it indispensable for studies of rice area change over decades. However, the 16-day repeat means some phenological events within a short growing season may be missed between observations.
Sentinel-2 (operated by the European Space Agency, launched 2015 and 2017 as a twin-satellite constellation) improves on Landsat with 10-20 meter resolution and a 5-day revisit cycle at the equator. These two improvements together enable finer field delineation and better phenological sampling, and most recent high-accuracy rice mapping studies, including those published in ISPRS Journal of Photogrammetry and Remote Sensing in 2024, use Sentinel-2 as the primary optical data source.
MODIS (Moderate Resolution Imaging Spectroradiometer), aboard NASA’s Terra and Aqua satellites, provides 250-500 meter resolution with daily revisit capacity. While too coarse for individual field mapping, MODIS remains valuable for national- and continental-scale cropping intensity assessments where high spatial resolution is less critical than temporal density.
3. Radar Remote Sensing
Synthetic Aperture Radar (SAR) is a radar-based technology that transmits microwave pulses toward the Earth’s surface and measures the energy scattered back to the sensor. Unlike optical sensors, SAR operates independently of cloud cover and solar illumination, meaning it acquires data equally well on a cloudy monsoon night as on a clear dry-season day.
This property is critically important for rice mapping in tropical Asia, where optical sensors routinely lose weeks of growing season to cloud obstruction.
Sentinel-1 (ESA) transmits C-band microwave energy (wavelength approximately 5.6 cm) and delivers free, global SAR data at 10-meter resolution with a 6-12 day repeat cycle. Rice paddies interact with SAR signals in a distinctive way:
- flooded fields act as a near-perfect mirror, reflecting most radar energy away from the sensor (producing low backscatter values), while
- the growing rice canopy increasingly scatters energy back toward the sensor as plant density and leaf area increase.
This backscatter trajectory over time, low during flooding and transplanting, rising through vegetative stages, and declining again after heading, forms a radar phenological signature unique to rice.
Nguyen et al. (Remote Sensing of Environment, 2023) found that Sentinel-1 SAR time-series classification achieved 92.3% overall accuracy in mapping rice-cropping seasons across three provinces in Vietnam’s Mekong Delta, including triple-crop areas where optical data was unavailable for more than 60% of the growing period due to cloud cover.
In tropical rice-growing regions, SAR-based methods are not simply an alternative to optical sensing, they are often the only reliable option for season-by-season mapping during monsoon months.
4. Multi-Sensor Data Integration
No single sensor offers the ideal combination of spatial detail, temporal density, and cloud penetration. The most accurate rice mapping systems therefore integrate multiple sensor types within a single analytical framework.
A common architecture pairs Sentinel-1 SAR for cloud-free temporal tracking with Sentinel-2 optical data for spectral richness during clear periods, and uses MODIS as a coarse-resolution anchor for phenological pattern detection at the regional scale.
When these data streams are fused algorithmically, the combined dataset can resolve crop boundaries, detect transplanting dates, and assign cultural type classifications with a level of certainty that no single sensor achieves alone.
Identifying Rice-Cropping Patterns from Satellite Data
1. Temporal Signatures of Rice Growth Stages
Rice passes through a well-defined sequence of growth stages: land preparation and flooding, transplanting or seeding, tillering (the development of multiple stems from a single plant), panicle initiation, heading (emergence of the grain-bearing flower head), and harvest.
Each stage produces a measurable change in the optical and radar characteristics of the field. Analysts use these stage-specific signatures, captured as time-series of spectral indices or SAR backscatter, to reconstruct what happened in each field and when, without any prior knowledge from the farmer.
2. Phenology-Based Rice Mapping
Phenology-based mapping (using the timing of biological events to classify crops) is the dominant approach for large-area rice detection. The method works by fitting mathematical curves to time-series data, then identifying fields where the temporal pattern matches the characteristic rice growth curve. Key event dates extracted from this fitting process include
- the start of the growing season (typically identified by a sharp increase in vegetation index values following flooding),
- the peak of the growing season (maximum leaf area index), and
- the end of the season (rapid decline at harvest).
The number of such cycles detected within a calendar year directly determines whether a field is classified as single, double, or triple cropped.
3. Cropping Intensity Assessment
Cropping intensity, the number of crop seasons completed per year on a unit of land, is one of the most policy-relevant outputs of rice-cropping pattern mapping. A simple but powerful approach computes the number of times a rice-like spectral or backscatter peak occurs in a pixel’s annual time-series.
When combined with spatial filters to remove spurious detections caused by wetlands, water bodies, or seasonal flooding, these cycle counts produce maps of single, double, and triple-crop rice that can be validated against field surveys and regional statistics.
4. Seasonal and Annual Rice Distribution Mapping
Seasonal maps (one map per growing season per year) capture not just where rice is grown, but when it grows in each location. Annual stacks of seasonal maps then reveal the full cropping calendar of a region, including the spatial distribution of early-season versus late-season rice, which carries direct implications for water scheduling, pest pressure management, and harvest logistics.
5. Detecting Crop Rotations Involving Rice
In many Asian rice systems, farmers alternate rice with wheat, vegetables, pulses, or fallow periods within the same field across successive seasons. Remote sensing detects these rotations by analyzing the full annual time-series rather than any single season in isolation.
A field classified as rice in the wet season but as wheat in the dry season presents a distinct two-peak temporal pattern in vegetation index data, with the spectral characteristics of each peak identifying the respective crop type. Mapping these rotations matters for soil health assessment, irrigation demand modeling, and income diversification programs.
How GeoPard Powers the Mapping of Rice-Cropping Patterns
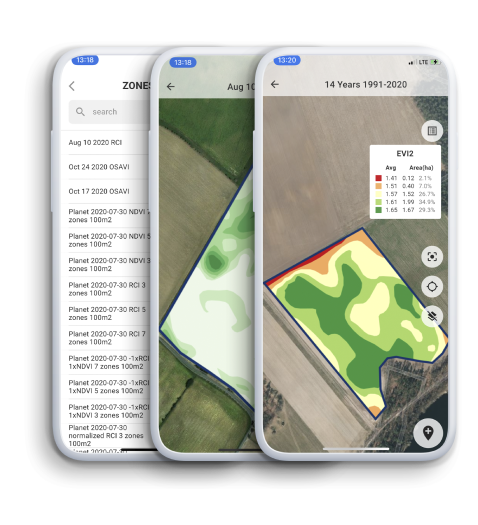
Mapping rice-cropping patterns demands continuous, multi-source observation across an entire growing season, and that is exactly what GeoPard delivers. By combining Landsat-8, Sentinel-2, and Planet imagery into a single platform, GeoPard monitors fields every other day at up to 3-meter resolution, ensuring that critical rice events like pre-transplanting flooding, seedling green-up, and harvest are never missed due to cloud gaps.
The platform’s multi-sensor fusion has demonstrated a 4% accuracy improvement over single-sensor approaches, which directly sharpens the separation between single-crop, double-crop, and triple-crop rice systems.

For cultural type identification, GeoPard’s vegetation index suite, including NDWI for surface flood detection, EVI2 for canopy biomass timing, and LAI for canopy density, captures the spectral biography that separates irrigated transplanted rice from rainfed or direct-seeded systems.
On cloudy monsoon days when optical imagery fails entirely, GeoPard’s integrated radar data layer keeps vegetation tracking uninterrupted, reading the SAR backscatter trough that is the definitive signature of a flooded paddy at transplanting time.
The Compare Layers tool allows agronomists to place up to four synchronized data layers side by side, making it straightforward to separate rice cultural types by comparing NDWI flood signals against multi-year vegetation trends and soil productivity maps.
Backed by over 30 years of satellite imagery, the platform reveals long-term cropping intensity patterns at the field level. Those insights then flow directly into Variable Rate Application maps for fertilizer, seed, and crop protection, turning rice cultural type maps into concrete, field-level management prescriptions.
Mapping Rice Cultural Types with Remote Sensing
1. Spectral Characteristics of Different Cultural Practices
Cultural type, the specific combination of management practices applied to a rice field, shapes the temporal evolution of that field’s spectral signature. Flooded transplanted rice, for instance, begins the season with a water-dominated optical response (low reflectance across all visible bands), followed by an abrupt shift as seedling canopy establishes.
Direct-seeded rice planted into a non-flooded seedbed shows a more gradual increase in vegetation signal from the onset of germination, without the initial flooding period that optical and SAR sensors both readily detect.
2. Distinguishing Irrigated and Rainfed Rice
Irrigated and rainfed rice fields differ in two observable ways: the timing and regularity of flooding events, and the consistency of their seasonal phenology. Irrigated fields tend to flood on schedule, exhibit less year-to-year variability in transplanting dates, and maintain consistent canopy density through controlled water management.
Rainfed fields show greater temporal variability between years, can experience mid-season water stress detectable as anomalous dips in vegetation index values, and sometimes fail to complete a full growing season during drought years.
Multi-year time-series analysis captures this variability structure, allowing classification algorithms to separate irrigated from rainfed areas with accuracies typically exceeding 85% in well-calibrated systems.
3. Mapping Transplanted and Direct-Seeded Rice
The most reliable indicator for distinguishing transplanted from direct-seeded rice in SAR data is the timing and duration of the initial low-backscatter flooding period.
Transplanted rice fields are flooded for 2-4 weeks before seedlings are transferred, creating an extended radar-dark window at the start of the season.
Direct-seeded fields show either no flooding window (dry-seeded) or a very brief one (wet-seeded), and the backscatter rise is both earlier relative to sowing date and structurally different in its slope. These temporal characteristics can be extracted automatically using algorithms applied to dense SAR time-series.
4. Detection of Management Practices Using Remote Sensing
Beyond transplanting method and water regime, remote sensing can detect certain water management practices, such as alternate wetting and drying (AWD), a technique used to reduce methane emissions and water consumption by intermittently draining rice paddies.
AWD fields display oscillating SAR backscatter patterns during the vegetative period, reflecting repeated flood-drain cycles, whereas continuously flooded fields show a steadier backscatter trajectory. This capability is particularly valuable for monitoring the adoption of climate-smart rice practices in national greenhouse gas inventories.
5. Water Management Indicators in Rice Fields
Water surface detection through SAR is highly sensitive, capable of identifying ponded water as shallow as a few centimeters beneath a rice canopy. This sensitivity allows analysts to map field-by-field flooding status at key points in the growing season, supporting irrigation scheduling decisions and early flood damage assessments.
When water surface maps from multiple dates are stacked temporally, they yield a dynamic water management signature for each field that serves as a high-value input to cultural type classification models.
Techniques and Methods: From Indices to Deep Learning
1. Vegetation Indices for Rice Monitoring
Vegetation indices are mathematical combinations of reflectance values at different wavelengths, designed to amplify the signal of plant biomass and health while reducing noise from soil background, atmospheric effects, and illumination geometry. Three indices are central to rice mapping work.
i. NDVI (Normalized Difference Vegetation Index) is calculated as (NIR – Red) / (NIR + Red) and is the most widely used index in rice monitoring. It tracks canopy greenness from seedling establishment through senescence, with values typically rising from near zero at transplanting to 0.6-0.8 at peak vegetative growth.
ii. EVI (Enhanced Vegetation Index) corrects for atmospheric aerosol effects and soil background noise more effectively than NDVI, making it preferable in environments with high aerosol loading, such as during biomass burning seasons common in tropical Asia.
iii. LSWI (Land Surface Water Index) incorporates shortwave infrared reflectance to detect water content in both the plant canopy and the soil surface, making it highly sensitive to the flooding events that characterize lowland rice cultivation and providing a robust signal for detecting the start of the growing season.
2. Time-Series Analysis
A single satellite image captures the state of a rice field at one moment in time, but a rice field’s story is written in the sequence of those moments. Time-series analysis chains together many observations, typically one image every 5-16 days for an entire year, and extracts temporal metrics such as season start date, peak NDVI, rate of green-up, and date of harvest.

These metrics collectively describe the field’s full phenological behavior and are far more diagnostic for crop type identification than any single-date observation. Statistical methods including harmonic regression and dynamic time warping (DTW) are commonly used to align and compare time-series data across different years and regions.
3. Machine Learning for Rice Classification
Machine learning has transformed the scale and accuracy of rice-cropping pattern mapping by automating the identification of complex, nonlinear relationships between spectral-temporal data and field conditions.
i. Random Forest (RF) is an ensemble method that builds hundreds of independent decision trees, each trained on a random subset of features, and aggregates their votes for a final classification. It is robust to noisy training data, handles high-dimensional feature spaces efficiently, and provides variable importance scores that help analysts understand which temporal or spectral features drive classification decisions.
ii. Support Vector Machine (SVM) finds the optimal separating boundary between classes in a high-dimensional feature space. SVM performs well when training data is limited, making it useful in data-scarce regions where ground truth collection is expensive.
iii. Deep Learning, particularly convolutional neural networks (CNNs) and recurrent neural networks (RNNs) such as Long Short-Term Memory (LSTM) architectures, can learn both spatial patterns within individual images and temporal patterns across image sequences simultaneously. LSTM-based classifiers applied to satellite time-series have achieved state-of-the-art accuracy in rice mapping tasks, with several studies reporting overall accuracies above 90% at regional scales.
Xiao et al. (International Journal of Applied Earth Observation and Geoinformation, 2025) demonstrated that an LSTM deep learning model trained on Sentinel-1 and Sentinel-2 fused time-series data mapped rice cultural types across three South Asian countries with an overall accuracy of 91.7% and a kappa coefficient of 0.89, outperforming Random Forest by 6.4 percentage points under the same training data conditions.
For large-area rice cultural type mapping where training data collection is possible, LSTM-based deep learning classifiers are now the benchmark method and should be the default choice for new national mapping programs.
4. Object-Based Image Analysis (OBIA)
Object-Based Image Analysis (OBIA) works by grouping neighboring pixels with similar spectral and spatial characteristics into objects (segments) before classifying them, rather than classifying each pixel independently.
In rice mapping, OBIA is valuable because it can incorporate shape, texture, and context into the classification, distinguishing a rice paddy from a similarly colored water body based on the paddy’s regular rectangular geometry.
OBIA is especially effective at very high spatial resolution, such as data from commercial satellites at 1-5 meter resolution or UAV imagery.
5. Change Detection Techniques
Change detection identifies areas where land use has shifted between two or more dates. In rice system monitoring, change detection serves two purposes: tracking year-to-year expansion or contraction of rice area in response to climate or economic drivers, and identifying mid-season changes such as crop failure, abandonment, or unexpected flooding.
Bi-temporal change detection (comparing two dates directly) is simple but vulnerable to phenological differences between years. Multi-temporal change detection across full annual stacks is more robust and can separate genuine land use change from seasonal phenological variation.
Accuracy Assessment and Validation
1. Ground Truth Data Collection
Every rice mapping product requires validation against independently collected field observations. Ground truth data typically includes GPS-referenced field visits where trained enumerators record crop type, growth stage, water management status, and establishment method at a statistically representative sample of locations. These observations are collected to coincide temporally with satellite acquisitions, and they are withheld from model training and used exclusively for accuracy assessment.
2. Classification Accuracy Metrics
For rice-specific applications, the F1-score, which balances producer’s and user’s accuracy for each class, is increasingly reported alongside Kappa as a more informative single-number performance summary. The standard metrics for assessing map accuracy include
- overall accuracy (the percentage of all validation points correctly classified),
- producer’s accuracy (the probability that a field of a given true class is correctly mapped, analogous to recall),
- user’s accuracy (the probability that a field mapped to a given class is actually that class, analogous to precision), and
- the Kappa coefficient (a measure of agreement corrected for chance agreement, where values above 0.80 indicate strong agreement).
3. Validating Cropping Pattern and Cultural Type Maps
Validating cropping pattern maps requires multi-temporal ground truth data, with field visits at multiple points across the cropping calendar to confirm how many seasons were actually harvested per year at each validation site.
Cultural type validation, distinguishing transplanted from direct-seeded or irrigated from rainfed, is more demanding because these distinctions are not always visually obvious in the field and require farmer interviews or direct observation of management events during sensitive windows in the growing season.
National agricultural statistics, though often aggregated at province or district level, provide an additional layer of validation for area estimates, allowing map totals to be cross-checked against official reported figures.
Applications Across the Agricultural System
1. Agricultural Planning and Policy Development
Rice-cropping pattern maps derived from remote sensing give agricultural ministries the spatial resolution they need to design targeted interventions. Regions identified as single-crop rainfed can be prioritized for small-scale irrigation development; triple-crop areas with declining yields can be investigated for soil degradation or water table depletion.
2. Rice Production Estimation
Combining rice area maps from remote sensing with yield estimation models, such as crop growth simulations driven by weather data, produces sub-national and national production forecasts weeks or months before harvest.
The Asian Development Bank’s food security dashboard and FAO’s Global Information and Early Warning System (GIEWS) both incorporate satellite-derived rice area data to generate pre-harvest production estimates with demonstrated accuracy gains over survey-based approaches.
3. Water Resource Management
Irrigated rice is the single largest consumer of freshwater in Asia, accounting for roughly 40% of total agricultural water withdrawals in countries like India and Bangladesh.
The most valuable output of satellite rice mapping is not the map itself, but the decision it enables, whether to build a canal, shut a well, or redirect a subsidy.
Knowing precisely where irrigated rice is grown, how many seasons it is irrigated, and which fields use efficient water management practices such as AWD directly supports river basin planning, reservoir operation scheduling, and groundwater sustainability assessments.
4. Food Security Monitoring
Early warning systems for food insecurity depend on rapid detection of crop failures. When rice areas fail to complete a full growing cycle, satellite-based monitoring detects the anomaly as an absent or truncated phenological peak within the expected seasonal window. The FEWS NET (Famine Early Warning Systems Network), supported by USAID, uses satellite vegetation data including rice-specific monitoring to generate food security alerts across Asia and Africa.
5. Climate Change Impact Assessment
Long-term archives of rice-cropping pattern maps spanning 20 or more years of Landsat data reveal how rice cultivation areas, seasons, and yields have shifted in response to changing temperature and precipitation regimes. These historical trend maps provide empirical evidence for the impacts of climate change on rice systems and serve as inputs for projecting future agricultural risk under different warming scenarios.
7. Precision Agriculture Applications
At the farm scale, UAV-derived mapping of rice cultural type combined with field-level soil and water data supports precision management decisions such as variable-rate fertilizer application, site-specific pest scouting, and optimized planting date scheduling. These applications are currently maturing rapidly in Japan, South Korea, and parts of China, where rice farming is highly mechanized and data infrastructure is available to link remote sensing outputs to farm management systems.
Challenges and Limitations That Constrain Rice Mapping
1. Cloud Cover and Data Availability
Persistent cloud cover during the monsoon season, when much of Asia’s rice is grown, severely limits the number of usable optical observations. In some locations, cloud contamination reduces the available Sentinel-2 observations during the critical transplanting and early vegetative period to fewer than two per month. SAR data mitigates but does not eliminate this problem, since heavy rainfall can temporarily saturate the radar signal.
2. Mixed Pixels and Small Field Sizes
In regions where rice fields are smaller than the sensor’s spatial resolution, a single pixel captures a mixture of rice and non-rice land cover, making classification ambiguous. Upland rice systems in hilly terrain and garden-scale paddies in parts of Indonesia and the Philippines routinely produce mixed pixels even at Sentinel-2’s 10-meter resolution, limiting the use of pixel-based methods in these environments.
3. Spectral and Temporal Similarity Among Crop Types
Some crops, particularly sugarcane, jute, and certain grasslands, produce phenological curves similar to rice in NDVI or EVI time-series, leading to classification confusion. SAR-based flooding detection reduces this confusion for lowland rice, but upland rice systems without flooded paddies remain difficult to separate from spectrally similar crops without additional field data or ancillary geographic inputs.
4. Temporal Resolution Constraints
Mapping of rice-cropping pattern and cultural type using remote sensing requires dense temporal sampling, ideally at least one observation every 8-10 days throughout the entire growing season. When cloud cover or satellite orbit gaps reduce this temporal density, short-duration rice varieties or fast-cycling triple-crop seasons may be missed entirely by automated detection algorithms.
5. Ground Data Limitations
High-quality labeled training data, field observations matched to known crop types and management practices, remains expensive and logistically difficult to collect at the scale needed to train and validate national mapping systems. In many lower-income rice-producing countries, the human and financial capacity for systematic ground data collection is the single greatest constraint on mapping accuracy improvement.
Emerging Trends and the Future of Rice Monitoring
1. UAV and Drone-Based Rice Monitoring
Unmanned aerial vehicles (UAVs) equipped with multispectral and thermal sensors now deliver centimeter-level imagery over individual farms, resolving field boundaries, crop rows, and even individual plant health status. UAVs function as a bridge between satellite-scale mapping and individual plant observation, providing the ultra-high-resolution ground truth data needed to train and validate satellite-based models in fragmented landscape settings.
2. AI and Deep Learning for Rice Classification
Convolutional neural networks applied to satellite image time-series, combined with transformer architectures adapted from natural language processing, are currently achieving the highest rice classification accuracies ever reported.
The PRISM (Phenology-based Rice crop Identification System using Multisource data) framework published by researchers at Wageningen University in 2024 demonstrated that self-supervised learning on unlabeled satellite archives could pre-train rice classification models requiring only minimal labeled ground data for fine-tuning, dramatically reducing the field survey burden.
3. Near-Real-Time Rice Monitoring Systems
Operational near-real-time rice monitoring systems process incoming satellite data automatically, update rice maps at 10-16 day intervals, and deliver alerts on planting dates, water stress events, and harvest timing directly to government dashboards or mobile applications used by farmers and extension agents.
Thailand’s Rice Department and Vietnam’s Ministry of Agriculture both operate prototype systems of this kind, and the International Rice Research Institute is supporting similar capability development in Bangladesh and Cambodia.
4. Integration of Satellite and IoT Data
Internet of Things (IoT) sensors deployed in rice fields, measuring soil moisture, water level, temperature, and canopy microclimate, generate continuous ground-level observations that complement and calibrate satellite remote sensing data.
When IoT sensor networks and satellite observations are combined in data fusion frameworks, the resulting monitoring system can detect water stress, flooding onset, and disease pressure with greater confidence and earlier lead time than either source provides independently.
5. Digital Agriculture and Smart Farming
The convergence of satellite rice mapping, IoT sensing, and AI-driven decision support is creating the foundations of smart rice farming, where management decisions from irrigation timing to fertilizer application are informed by spatially explicit, near-real-time data streams rather than calendar-based rules of thumb.
Pilot programs in Japan’s Niigata Prefecture and in China’s Heilongjiang Province have demonstrated that precision rice management informed by remote sensing can reduce input costs by 15-25% while maintaining or improving yields, according to preliminary field trial reports from 2024.
Conclusion
The mapping of rice-cropping pattern and cultural type using remote sensing has matured from an academic research discipline into an operational tool used by governments, international agencies, and agri-tech platforms across Asia and beyond. Multi-sensor time-series approaches combining optical and SAR data, processed through machine learning and deep learning classifiers, now routinely deliver rice area maps at national scale with overall accuracies exceeding 85-90%. These maps resolve not just where rice grows, but how many times a year, under what water regime, and through what establishment method.
Moving beyond simple rice area mapping to cultural type classification is what transforms a land cover product into an agricultural intelligence asset. Knowing that a region has shifted from transplanted to direct-seeded rice over a decade signals labor market changes and water table depletion simultaneously. Knowing which rainfed areas are most vulnerable to early season dry spells, identified by their temporal spectral patterns, allows pre-positioned drought response rather than reactive disaster relief. Remote sensing makes this level of spatial intelligence possible at a fraction of the cost of equivalent ground survey programs.
Remote Sensing