Potato stands as one of the world’s most important food crops, serving as a staple for millions of people. Firstly, knowing how potato plants grow and being able to predict their yield helps farmers manage irrigation, fertilization, and pest control more effectively.
Secondly, food processors and storage facilities can better plan logistics and labor when they have reliable yield estimates. However, traditional methods—such as physically walking through fields and measuring plants by hand—are time‑consuming and prone to human error.
Therefore, scientists have turned to remote sensing, which uses cameras and sensors on satellites, drones, or handheld devices, to monitor potato growth and forecast yield more rapidly and accurately.
Understanding Potato Yield Forecasts
Over the past two decades, interest in applying remote sensing to potato research has grown substantially. In fact, a systematic review identified 79 studies published between 2000 and 2022 on this topic, out of 482 initially screened articles.
To ensure transparency and reproducibility, the authors followed established guidelines (Kitchenham & Charters 2007; PRISMA framework), searching eight major databases—Google Scholar, ScienceDirect, Scopus, Web of Science, IEEE Xplore, MDPI, Taylor & Francis, and SpringerLink—using terms like “potato yield prediction” AND “remote sensing.”
Consequently, only original research in English that used remote sensing data for growth monitoring or yield estimation was included. Moreover, data from each selected paper were extracted according to four key questions:
- Which sensing platform was used (satellite, UAV, or ground‑based)?
- Which vegetation indices or spectral features were evaluated?
- Which crop traits were monitored (biomass, leaf area, chlorophyll, nitrogen)?
- How accurately could final tuber yield be predicted (coefficient of determination, R²)?
These questions helped the reviewers map out the state of the art and identify gaps where future research could focus.
Remote Sensing Platforms and Vegetation Indices
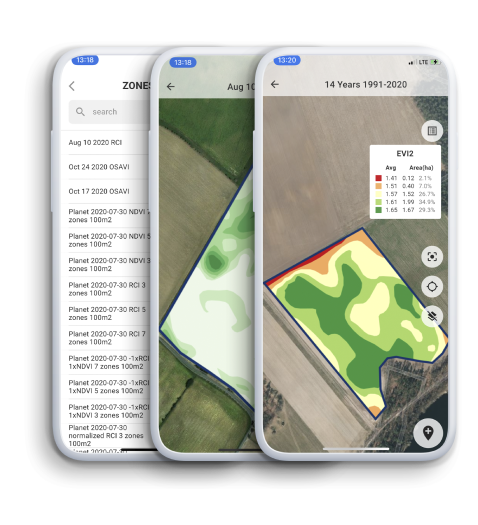
Researchers have employed three main types of remote sensing platforms, each with its own advantages and limitations. Firstly, optical satellites such as Sentinel‑2 (10 m spatial resolution, 5 day revisit) and Landsat 5–8 (30 m, 16 day revisit) offer broad coverage and often free data access.
Secondly, satellites like MODIS/TERRA/Aqua (250–1000 m, daily to 2 day revisit) and commercial systems like PlanetScope (3 m, daily, costing about $218 per 100 km²) allow for more frequent or higher‑resolution monitoring, although costs can be a factor.

Thirdly, unmanned aerial vehicles (UAVs) carrying multispectral or hyperspectral cameras provide very high resolution (down to a few centimeters per pixel) and can be flown on demand, but they cover smaller areas and require more logistics.
Finally, ground‑based sensors—such as handheld NDVI meters and SPAD chlorophyll meters—give spot measurements that are highly precise, although they are time‑intensive when used over large fields.
Vegetation indices (VIs) translate raw reflectance values into meaningful estimates of plant traits. The most common indices in potato studies include:
- NDVI (Normalized Difference Vegetation Index): (NIR – Red) / (NIR + Red)
- GNDVI (Green NDVI): (NIR – Green) / (NIR + Green)
- NDRE (Normalized Difference Red‑Edge): (NIR – RedEdge) / (NIR + RedEdge)
- OSAVI (Optimized Soil‑Adjusted Vegetation Index): 1.16 × (NIR – Red) / (NIR + Red + 0.16)
- EVI (Enhanced Vegetation Index), CIred‑edge, CIgreen, and more .
These indices are chosen based on their sensitivity to canopy cover, chlorophyll content, and soil background. Consequently, they serve as the foundation for estimating plant health and predicting yield.
Potato Monitoring Growth and Predicting Yield
Through remote sensing, researchers monitor key potato crop traits—aboveground biomass (AGB), leaf area index (LAI), canopy chlorophyll content (CCC), and leaf nitrogen status—and then relate these to final tuber yield.
Firstly, estimating AGB using VIs alone can be challenging when canopy cover is dense because many indices saturate; therefore, combining VIs with plant height or texture features in machine‑learning models often improves accuracy.

Secondly, assessing LAI—the total one‑sided leaf area per ground area—has achieved R² values up to 0.84 by using time‑series data from both UAV hyperspectral and satellite multispectral sensors.
Thirdly, CCC estimates, derived from indices like CIred‑edge, CIgreen, TCARI/OSAVI, and TCARI + OSAVI, reached R² ≈ 0.85 during the vegetative stage, indicating strong correlation with lab‑measured chlorophyll.
Lastly, leaf nitrogen status, vital for healthy growth, was predicted with R² ranging from 0.52 to 0.95 when using ground‑based sensors plus regression or random‑forest models.
When it comes to tuber yield prediction, two main modeling approaches stand out:
Empirical Regression Models: Here, a single VI—most often NDVI, GNDVI, or NDRE—is fitted to ground‑truth yield data. Reported R² values for NDVI vs. yield range from 0.23 to 0.84 (median ≈ 0.67), while NDRE–yield correlations range from 0.12 to 0.85 (median ≈ 0.61).
Machine‑Learning Models: These include random forest, support vector machines, and neural networks that combine multiple VIs, spectral bands, and non‑spectral factors such as weather, soil, and management. Such models have pushed R² up to 0.93 in some studies.
Moreover, the timing of data collection greatly affects prediction accuracy. Across multiple studies, VI measurements taken at 36–55 days after planting (DAP) yielded the highest correlations with final tuber yield.
This stage aligns with maximum ground cover and the onset of tuber initiation, making plant structure most indicative of eventual yield. Some of the key statistics found:
- 79 studies (2000–2022) met the review criteria, out of 482 identified.
- Focus areas: yield prediction (37 %), leaf N status (21 %), AGB (15 %), LAI (15 %), CCC (12 %).
- Satellite platforms most used: Sentinel‑2, Landsat, MODIS; commercial: PlanetScope.
- R² ranges: NDVI–yield (0.23–0.84), NDRE–yield (0.12–0.85), GNDVI–yield (0.26–0.75).
Potato Yield Prediction Recommendations
Based on these findings, practitioners should first select the appropriate platform for their goals. For regional yield forecasts, free Sentinel‑2 data provide reliable coverage with 10 m resolution and a 5 day revisit schedule.
To refine local estimates, UAV flights scheduled around 36–55 days after planting capture critical canopy dynamics and improve calibration of satellite models. Ground sensors are best used for spot checks and to calibrate remote observations, especially when combining spectral data with field measurements.
In terms of vegetation indices, practitioners should prioritize NDVI, NDRE, and CI<sub>red‑edge</sub> for predicting final yield, as these consistently show strong correlations.

When estimating chlorophyll and nitrogen content, combining red‑edge indices with soil‑adjusted VIs—such as TCARI/OSAVI—yields the most accurate results. For biomass estimation, integrating VIs with plant height or texture features within machine‑learning frameworks further boosts accuracy.
As for modeling, simple linear or non‑linear regressions using a single index are effective when ground‑truth data are limited. However, when multiple indices and ancillary data (weather, soil, management) are available, machine‑learning methods such as random forest or neural networks offer superior performance. Importantly, timing imagery around 36–55 days after planting is crucial, as this window consistently delivers the highest prediction accuracy.
Conclusion
In conclusion, remote sensing offers a fast, flexible, and accurate toolkit for monitoring potato growth and predicting tuber yield. By choosing the appropriate platform, selecting the most informative vegetation indices, timing data collection around 36–55 DAP, and applying suitable modeling techniques, researchers and practitioners can significantly improve yield forecasts.
This approach not only saves time but also supports smarter management decisions, ultimately benefiting farmers, agronomists, and the entire potato supply chain.
Reference: Mukiibi, A., Machakaire, A.T.B., Franke, A.C. et al. A Systematic Review of Vegetation Indices for Potato Growth Monitoring and Tuber Yield Prediction from Remote Sensing. Potato Res. 68, 409–448 (2025). https://doi.org/10.1007/s11540-024-09748-7
Remote Sensing