Розширена статистика для зон управління в точному землеробстві

У "The accurate calculation of statistics is a cornerstone of precision agriculture data analysis. GeoPard has added more detailed statistical precision calculations to the agriculture zones created on the platform to ensure that your maps and the analytic conclusions you draw from them are precise and reliable. 

Advanced statistics are calculated per zone, containing the attributes: minimum і maximum values of the vegetation index (or other attributes), medianaveragestandard deviation, and the sum of all the values in the zone.

The median is the middle value of a dataset that has been numerically ordered, as opposed to the average. This relates to the standard deviation, which reflects how the data is arranged around the average value.

A low standard deviation suggests that the data in a given zone is grouped closely around the average, whereas a high standard deviation indicates that the zone data is spread out more widely around the average.

The sum attribute is simply the total sum of all pixel values in that zone. Before any stats are calculated for your zones, all the outliers or anomalous data points are removed to prevent the creation of misleading statistics that do not accurately reflect your zone data. 

After the manual amendments of agriculture zones through the Merge/Split tool, zone statistics are recalculated based on the new zone geometries. This allows for a refined and accurate understanding of data distribution inside and across zones.

Management zones statistics in GeoPard

As always, GeoPard values transparency throughout all aspects of the platform. During the aggregation of classified data into agriculture zones, all details are smoothed and hidden without metrics to show what happened, so the results of the data aggregation are provided through precision statistics.

It is also always possible to backpedal and extract the original values from your zones to recheck them or to utilize them in your own models. You never need to worry about losing your original data in GeoPard.

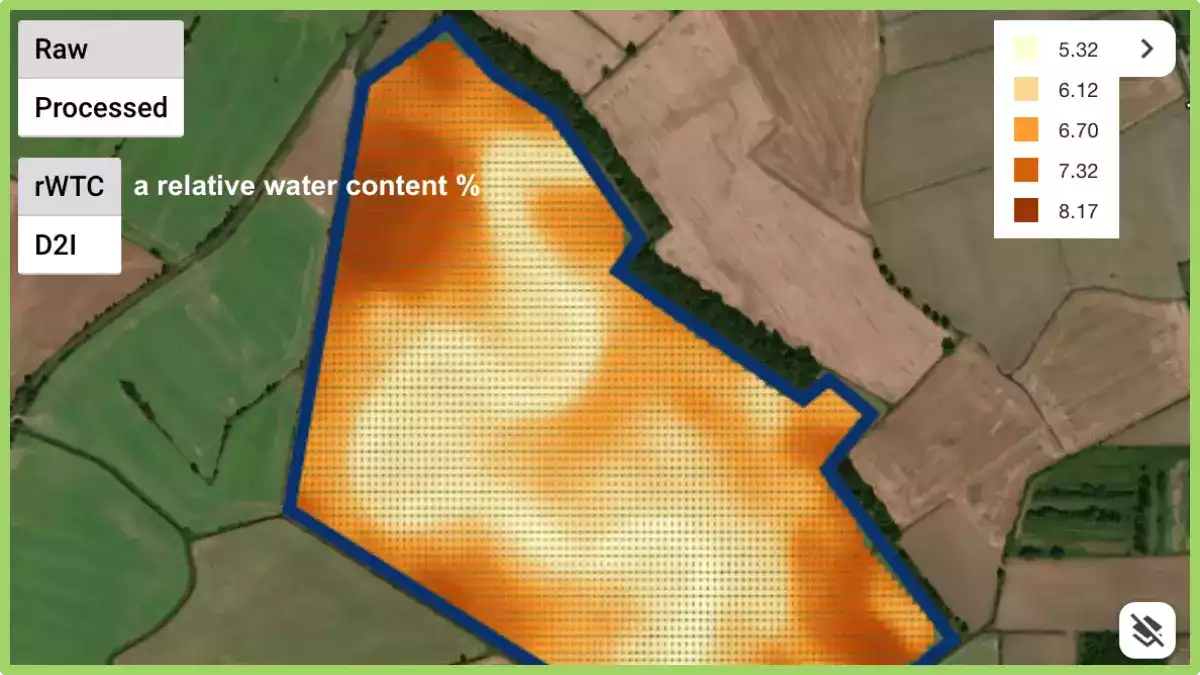
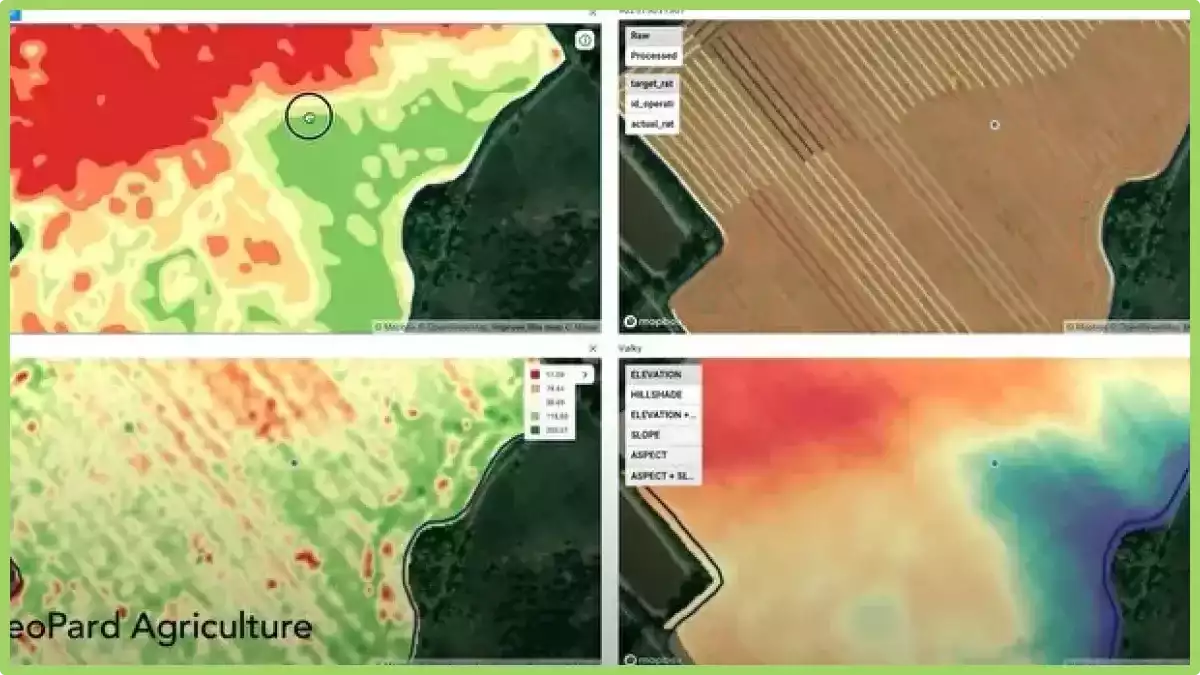
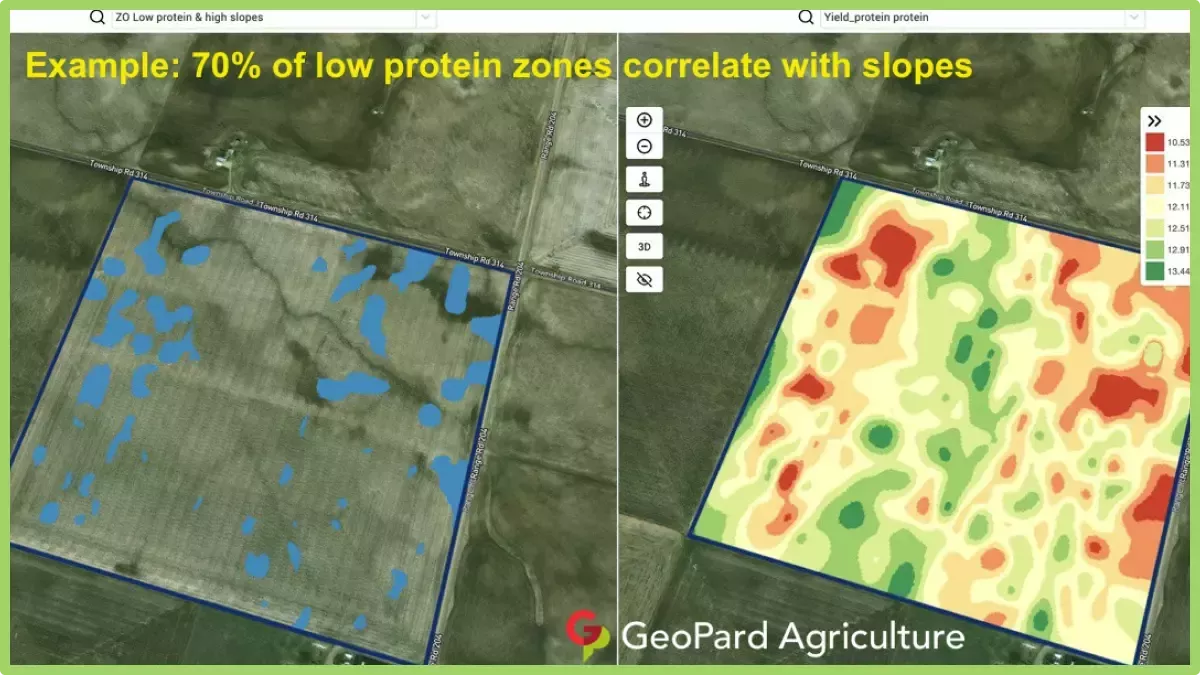
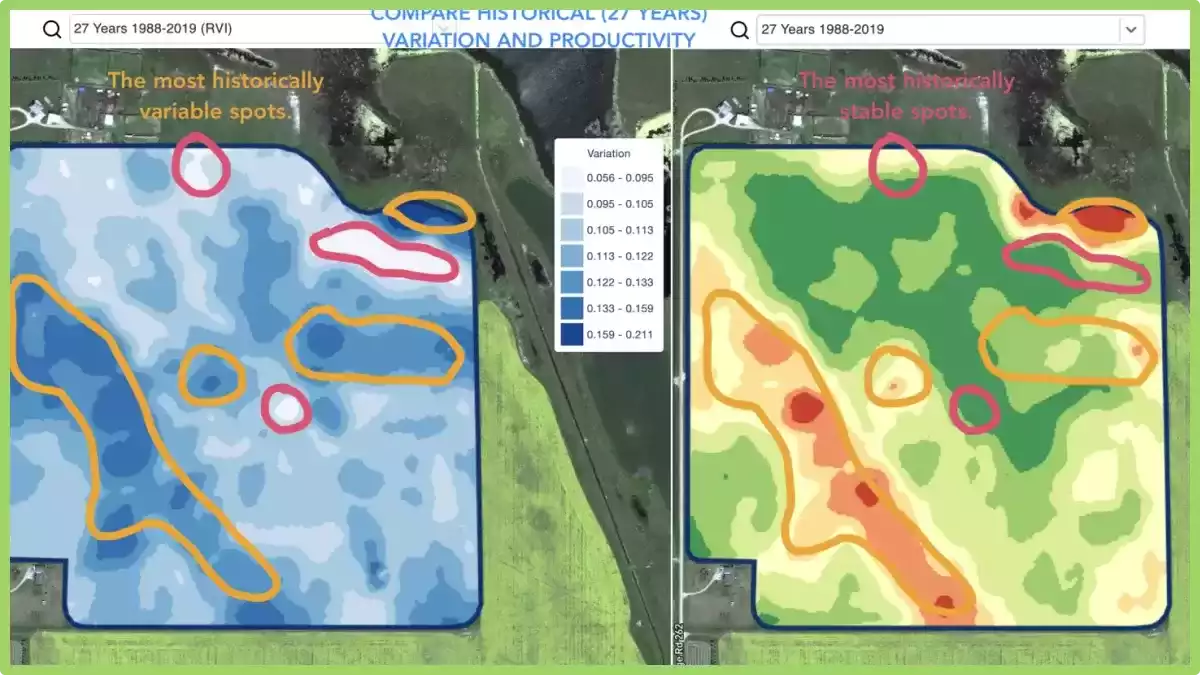
Statistics are of high value in determining map accuracy and are calculated for agriculture zones based on any data layer of your choice, including yield, ground sensors, satellite, topography, and multi-layer. 

GeoPard presents zone statistics in a highly readable and straightforward manner, which can be seen in the example images below.

At GeoPard we want to make it easy for you to be confident in the decisions you are making about your fields by providing you with the best and most comprehensive access to statistical precision calculations we can.

What is advance statistics?

Advanced statistics is a branch of statistical analysis that involves more complex and sophisticated techniques beyond basic statistical methods. It encompasses a range of statistical models and techniques used to analyze and interpret complex data sets.

Advanced statistical methods include regression analysis, multivariate analysis, time series analysis, and experimental design, among others. These techniques allow researchers and analysts to uncover deeper insights, identify patterns and relationships, and make more accurate predictions or informed decisions based on the data.

Аналіз даних георозвідників / TopsoilMapper

GeoPard здатний обробляти та аналізувати різні типи просторових сільськогосподарських даних. Це приклад роботи з наборами даних датчиків високої щільності з великою просторовою мінливістю, що забезпечується Геопроспектори ГмбХ

Після імпорту даних, отриманих за допомогою Картограф верхнього ґрунту, ви можете бачити 

  • відносний вміст води
  • глибина взаємодії з інформацією про ущільнення
  • електропровідність на 4 кумулятивній глибині
Відносний вміст води, сирі бали

Geopard дозволяє бачити точки з необробленими значеннями та безперервною поверхнею; порівнювати різні шари даних; розмежовувати ґрунтові зони для зонального відбору проб ґрунту та VRA; об'єднувати дані TopsoilMapper з даними, доступними в GeoPard, такими як історична, сучасна рослинність та висота, в одну карту зон. 

Порівняння шарів: рослинність (WDRVI), карта зон (EC+Рельєф), EC, ущільнення


Цікаво знати, що низькі значення електропровідності (EC) позначені на карті у вигляді кривої? Це стародавнє русло річки, поховане під землею.

Порівняння шарів даних для прийняття рішень щодо сільськогосподарських культур

Щоб візуалізувати польові дані та приймати обґрунтовані рішення, часто необхідно порівнювати шари на кількох синхронізованих виглядах.

У GeoPard ви можете візуально порівнювати до чотирьох шарів даних на одному екрані. Усі шари працюють синхронно під час масштабування або переміщення карти для вашої зручності.

Як увійти в режим розділеного екрана? Виберіть поле та натисніть піктограму порівняння шарів у верхньому правому куті екрана. Потім виберіть будь-які знімки, зони контролю поля або інші шари, які ви хочете бачити одночасно на одному екрані. Натисніть "Порівняти шари". 

Функція порівняння шарів синхронізує карти, курсори, рівні масштабування. Також ви маєте можливість додавати/видаляти шари. Наразі ми підтримуємо до 4 шарів даних.

Що таке шари даних у точному землеробстві?

У точному землеробстві шарами даних називаються різні типи даних, які збираються та аналізуються для прийняття обґрунтованих рішень щодо управління врожаєм. Ці шари можуть включати:

  • Дані ґрунту: Інформація про характеристики ґрунту, такі як рівень поживних речовин, pH та текстура, яка може допомогти у прийнятті рішень щодо внесення добрив та інших методів управління ґрунтом.
  • Дані про погоду: Дані про поточні та історичні погодні умови, включаючи температуру, опади та вітер, можуть допомогти фермерам приймати рішення щодо посіву, зрошення та інших практик.
  • Дані врожаюДані про ріст та стан посівів, включаючи висоту рослин, площу листя та рівень хлорофілу, можуть допомогти у прийнятті рішень щодо удобрення, поливу та боротьби зі шкідниками.
  • Дані про врожайність: Інформація про врожайність та якість може допомогти фермерам приймати рішення щодо збору та продажу своєї продукції.
  • Топографічні дані: Інформація про форму та висоту місцевості може допомогти у прийнятті рішень щодо посадки та зрошення, а також виявити території, які можуть бути схильні до ерозії чи інших екологічних проблем.
  • Дані дистанційного зондування: Дані, зібрані супутниками, дронами або іншими дистанційними датчиками, можуть надавати інформацію про стан посівів, вологість ґрунту та інші фактори, які можуть допомогти у прийнятті рішень щодо управління сільськогосподарськими культурами.

Аналізуючи та інтегруючи ці різні шари даних, фермери можуть приймати більш обґрунтовані рішення щодо управління культурами, що призведе до більш ефективних та стійких методів ведення сільського господарства.

Операції в сільськогосподарських зонах для прийняття рішень на основі даних

ZONES OPERATIONS ACROSS DIFFERENT LAYERS

In precision farming, field data collection and data-driven decision making are absolutely essential. As the next stage in the development of multi-layers analytics and finding dependencies across layers we introduce new module Zones Operations. 

There you can search for dependencies between different ag zones maps such as historical vegetation, topography including its derivatives, data from yield monitors, soil data, scanners, stability maps, and so on. This is a step forward in defining the most influenced areas and understanding the reasons for field heterogeneity. 

How can you identify the areas? 

First of all select field maps, you want to cross-investigate. A layer comparison view is a good approach to define specific agriculture zones for analyzing.

You may want to compare low yield potential and sloppy areas, most unstable zones and low vegetation, low electrical conductivity and yield, as applied fertilization map and current vegetation, and others.

Secondly, mark specific agriculture zones on every map you want to compare in the Zones Operations module. And finally, obtain a zone of interest. Note that it is possible to use more than two maps in analyses. 

How can you apply this knowledge? 

In addition to finding relationships that can help explain yield, it is possible to set yield goals for defined agriculture zones; to scout interesting areas; to reduce investments in such localized zones or build the plan of mitigating limiting factors and pull up underperforming areas knowing the underlying causes; to build agronomy plan using VRA practices. 

There are several examples of field insights on screenshots. Note that every field is unique and below-mentioned cases do not guarantee 100% same result for your field but it is a good way to start the investigation from. 

You are very welcome to share your agronomic practices by commenting on this post, contact the GeoPard Agriculture team directly. We are open to the feedback because we build the solution for you for a better understanding of field variability and managing it.

Якість зон

Almost all management zones are adjusted before becoming a Variable Rate Application map. This can be merging some zones together, manual corrections in well-known spots, the addition of extra buffer areas, ag equipment compatibility, etc.

We, in the GeoPard team, understand that accurate natural management zones with valid polygons will save a lot of time during zone verification and correction processes.

The GeoPard engine does the following:

  • automatically removes noise,
  • automatically merges small polygons into the closest bigger zone,
  • keeps only the necessary minimum amount of points in every zone polygon,
  • makes VRA maps compatible with any agricultural equipment and machinery.

In addition to automatic correction, the tool to merge and split zones is available to adjust the map according to your own field knowledge and agronomic practice. 

There are many different maps from various providers on the market, but you will definitely recognize GeoPard maps.

Об'єднання та розділення зон для управління в сільському господарстві

Ніхто не знає своє поле краще, ніж фермер або агроном, який працює на ньому багато років. Саме тому будь-яка аналітика, що базується на алгоритмах, часто потребує перевірки та коригування професіоналом, який використовує свої глибокі знання про поле.

Функція об'єднання та розділення зон дозволяє професіоналу зробити кілька важливих речей: 

  • Розділені багатокутники
  • Об'єднати полігони
  • Призначити полігон або цілу зону до іншого класу

Ці налаштування можна застосувати до будь-якого шару даних, і це дуже корисна функція для підготовки ваших ідеальних зон для точних сільськогосподарських операцій, таких як віртуальний посів, внесення добрив або обприскування.

Що таке розкол у сільському господарстві?

У сільському господарстві під розпаюванням розуміють поділ або розбиття поля на різні ділянки для різних методів господарювання.

Такий поділ дозволяє фермерам застосовувати різні методи обробки або техніки на кожній ділянці залежно від конкретних потреб.

Наприклад, фермери можуть розділити поле, щоб застосовувати різні добрива, гербіциди або методи зрошення залежно від стану ґрунту або вимог культури.

Розподіл дозволяє цілеспрямовано та ефективно застосовувати ресурси, оптимізувати ріст врожаю та мінімізувати витрати, вирішуючи конкретні завдання на різних ділянках поля.

Контроль врожаю з аналітикою стабільності та продуктивності


Detecting changes that happened in the field during the last 1-2 weeks or 1-2 months or even a couple of years helps to get insights about crop development.

It can be used to:

  • locate spots with similar performance across the 5-10-20 years and place the trials in areas with similar conditions to reduce the probability of mistakes,
  • track the changes during the season and evaluate crop performance during the growth,
  • recognize the damaged areas after a weather disaster or a disease or a pest attack and calculate damaged areas,
  • detect the difference between the last 2 images and control the crop performance.
Field Stability Zones

And all that and even more cases are covered with GeoPard Field Stability Zones. Especially, it will provide more insights together in combination with in-season and historical management zones.

Simply choose your field and satellite images to track the changes across them, control crops, and get insights about every spot in your field.

selection of field stability zones

Порівняння шарів

It’s no secret that we constantly enrich the GeoPard Agriculture solution and increase its value to users. Just look at the “coming soon” section of our website https://geopard.tech to get an idea of some features on the way.

Their prioritization can be challenging. Here, feedback and product demos come to the rescue. Thus, presenting our solution to many attendants of the World Agri-Tech Summit in London, we were able to adjust the delivery plan and release a new layers comparison feature just within a few days.

What is it about? You can visually compare field analytics side by side in a split view. It is possible to select any type of layers for comparison: imagery with natural or infrared colors, imagery with vegetation views, in-season or historical management zones. Two layers behave synchronously when you zoom-in / zoom-out or move a map for your conveniences.

How to enter the split view mode? Select your field and click compare layers icon in the top menu. On the split view screen, select the analytics layer using a searchable drop-down list located on the top.

enter the split view mode
choice of field analysts
comparison of field analysts

Багаторічні зони

What does it mean? Historical (multi-year) management zones are built based on 30+ years archive of satellite imagery.

Images with peak vegetation during every season are automatically selected as inputs for analytics. Otherwise, every such image represents a potential yield file for the related year.


Historical (multi-year) management zones provide insights about every spot in the field.

How can you use it? The field crop development pattern helps to know the agricultural area better and to apply the right decision with the right input rates in the right spots.

Historical management zones could be used as a blueprint for prescription (Rx) files for seeding, fertilization, zones based soil sampling.

We support all regions by request.

What are Multi-Year Zones?

Multi-Year Zones in precision agriculture refer to specific areas within a field that exhibit consistent and distinguishable patterns of crop growth and yield over multiple growing seasons.

These zones are identified using various technologies such as remote sensing, GPS mapping, and soil sampling.

By analyzing the data collected from these technologies, farmers and agronomists can identify patterns of variability within a field and create maps that distinguish areas of high productivity from those with lower yields.

This information can then be used to optimize crop management practices, such as varying planting density, adjusting irrigation and fertilization rates, and even implementing precision harvesting techniques.

They provide a valuable tool for precision agriculture as they allow farmers to make informed decisions about resource allocation and crop management, resulting in improved efficiency, reduced costs, and increased yields.

By understanding the variability within a field and tailoring management practices to each specific zone, farmers can maximize the potential of their land and resources.


wpChatIcon
wpChatIcon

    Замовити безкоштовну демонстрацію / консультацію GeoPard


    Натискаючи кнопку, ви погоджуєтесь з нашими Політика конфіденційності. Нам це потрібно, щоб відповісти на ваш запит.

      Підписатися


      Натискаючи кнопку, ви погоджуєтесь з нашими Політика конфіденційності

        Надішліть нам інформацію


        Натискаючи кнопку, ви погоджуєтесь з нашими Політика конфіденційності