Applications of (GIS) Geoinformatics in Agriculture

Geoinformatics (GIS) bridges the gap between spatial data and agriculture decision-making, allowing farmers to optimize resource utilization while minimizing environmental impact. This technology-driven approach helps tailor precision agriculture practices to specific field conditions, thus increasing productivity and efficiency.

Geoinformatics in Agriculture

By analyzing precise spatial information, such as soil variability, moisture content, and pest distribution, farmers can make well-informed choices, ensuring that each area of their land receives the exact treatment it requires.

Recent data shows that this technology is widely used, with over 70% of farms using it in some capacity. Geospatial data integration is becoming a standard practice in decision-making processes across a range of industries, from small-scale subsistence farming to major commercial operations.

Farmers are able to keep an eye on their crops in real time using satellite photography and ground sensors. With less waste and a smaller negative influence on the environment, they may use this to apply water, fertilizer, and pesticides precisely where and when they are needed.

The CottonMap project in Australia uses geoinformatics to monitor water use, resulting in a 40% decrease in water consumption. Enhanced resource management minimizes environmental impact by reducing chemical runoff and over-irrigation.

geoinformatics in agriculture

Increased productivity aids global food security. By optimizing planting patterns using spatial data, farmers can achieve higher crop yields without expanding agricultural land.

What is Geoinformatics?

Geoinformatics, also known as geographic information science (GIScience), is a multidisciplinary field that combines elements of geography, cartography, remote sensing, computer science, and information technology to gather, analyze, interpret, and visualize geographical and spatial data.

It focuses on capturing, storing, managing, analyzing, and presenting spatial information in digital forms, contributing to a better understanding of the Earth’s surface and the relationships between various geographic features. It is a powerful tool that can be used for a variety of purposes, including:

1. Precision agriculture: It can be used to collect data on a variety of factors, such as soil type, crop yield, and pest infestation. This data can then be analyzed to identify areas of variability within a field. Once these areas have been identified, farmers can use GIS to develop customized management plans for each area.

2. Environmental monitoring: It can be used to monitor changes in the environment, such as deforestation, land use change, and water quality. This data can then be used to track the progress of environmental policies and to identify areas that need further protection.

3. Urban planning: Geoinformatics can be used to plan and manage urban areas. This data can be used to identify areas that are in need of development, to plan transportation networks, and to manage infrastructure.

4. Disaster management: It can be used to manage disasters, such as floods, earthquakes, and wildfires. This data can be used to track the progress of a disaster, to identify areas that have been affected, and to coordinate relief efforts.

what is Geoinformatics? Components of Geoinformatics

Components of Geoinformatics

These components work together to provide insights into various aspects of the Earth’s surface and its relationships. Here are the main components of geoinformatics:

  • Geographic Information Systems (GIS): GIS involves the use of software and hardware to collect, store, manipulate, analyze, and visualize geographic data. This data is organized into layers, allowing users to create maps, conduct spatial analysis, and make informed decisions based on spatial relationships.
  • Remote Sensing: Remote sensing involves the collection of information about the Earth’s surface from a distance, typically using satellites, aircraft, or drones. Remote sensing data, often in the form of imagery, can provide insights into land cover, vegetation health, climate patterns, and more.
  • Global Positioning Systems (GPS): GPS technology enables accurate positioning and navigation through a network of satellites. In GIS, GPS is used to collect precise location data, which is crucial for mapping, navigation, and spatial analysis.
  • Spatial Analysis: It enables the application of various spatial analysis techniques to understand patterns, relationships, and trends within geographic data. These techniques include proximity analysis, interpolation, overlay analysis, and network analysis.
  • Cartography: Cartography involves the creation of maps and visual representations of geographic data. It provides tools and methods to design informative and visually appealing maps that effectively communicate spatial information.
  • Geodatabases: Geodatabases are structured databases designed to store and manage geographic data. They provide a framework for organizing spatial data, allowing for efficient storage, retrieval, and analysis.
  • Web Mapping and Geospatial Applications: Geoinformatics has expanded into web-based mapping and applications, allowing users to access and interact with geographic data through online platforms. This has led to the development of various location-based services and tools.
  • Geospatial Modeling: Geospatial modeling involves the creation of computational models to simulate real-world geographic processes. These models help predict outcomes, simulate scenarios, and aid decision-making in various fields.

8 Applications and Uses of Geoinformatics in Agriculture

Here are some of the key applications and uses of GIS in agriculture:

1. Precision Farming

Precision Agriculture harnesses the power of Geographic Information Systems (GIS) to provide farmers with intricate insights into their fields. These insights range from detailed vegetation and productivity maps to crop-specific information.

The heart of this approach lies in data-driven decision-making, empowering farmers to optimize their practices for maximum yield and efficiency.

Uses of Geoinformatics in Agriculture

Through the generation of productivity maps, GeoPard Crop Monitoring provides a crucial solution for Precision Agriculture. These maps make use of historical information from prior years, enabling farmers to identify productivity patterns throughout their farms. Farmers can identify fruitful and unproductive locations by using these information.

2. Crop Health Monitoring

The significance of monitoring crop health cannot be overstated. The well-being of crops directly impacts yields, resource management, and the overall health of the agricultural ecosystem.

Traditionally, manual inspection of crops across expansive fields was arduous and time-consuming. However, with the advent of advanced technologies like GIS and remote sensing, a transformative shift has occurred, enabling precision monitoring on an unprecedented scale.

Geoinformatics aids in the early detection of potential issues affecting crop health. By analyzing remote sensing data and satellite imagery, farmers can identify stressors like nutrient deficiencies or disease outbreaks, allowing for targeted interventions.

3. Crop Yield Prediction

By integrating historical data, soil composition, weather patterns, and other variables, It enables farmers to predict crop yields with remarkable accuracy. This information empowers them to make informed decisions regarding planting, resource allocation, and marketing strategies.

zones 2019 yield data map

In the field of predicting crop yields, GeoPard has become a leading innovator. GeoPard has developed a trustworthy method that claims an excellent accuracy rate of over 90% by combining historical and current crop data obtained from satellites. This innovative approach is proof of how technology may revolutionize contemporary agriculture.

4. Livestock Monitoring With Geoinformatics

Spatial data from GPS trackers on livestock offers insights into animal movements and behavior. These tools empower farmers to pinpoint the exact location of livestock within the farm, ensuring efficient management and care.

Beyond location tracking, GIS agriculture tools provide a comprehensive view of livestock health, growth patterns, fertility cycles, and nutritional requirements.

The global market for precision agriculture, which includes livestock monitoring, is projected to reach a substantial valuation by the coming years. This trend underscores the transformative potential of GIS in optimizing livestock management.

5. Insect and Pest Control

Traditional methods, such as manual scouting of large fields, have proven both time-consuming and inefficient. However, the convergence of technology, specifically deep learning algorithms and satellite data, has brought about a revolution in pest detection and management.

Geoinformatics helps in creating pest distribution maps, enabling precise application of pesticides. By targeting specific areas, farmers can minimize chemical usage, reduce environmental impact, and protect beneficial insects.

GeoPard Crop Monitoring is an effective method for spotting a variety of threats, such as weed infestations and crop diseases. Potential issue regions are detected by the study of field-collected vegetation indices.

For example, a low vegetation index value in a particular location may be a sign of potential pests or diseases. This realization simplifies the procedure and eliminates the need for time-consuming manual reconnaissance of large fields.

6. Irrigation Control

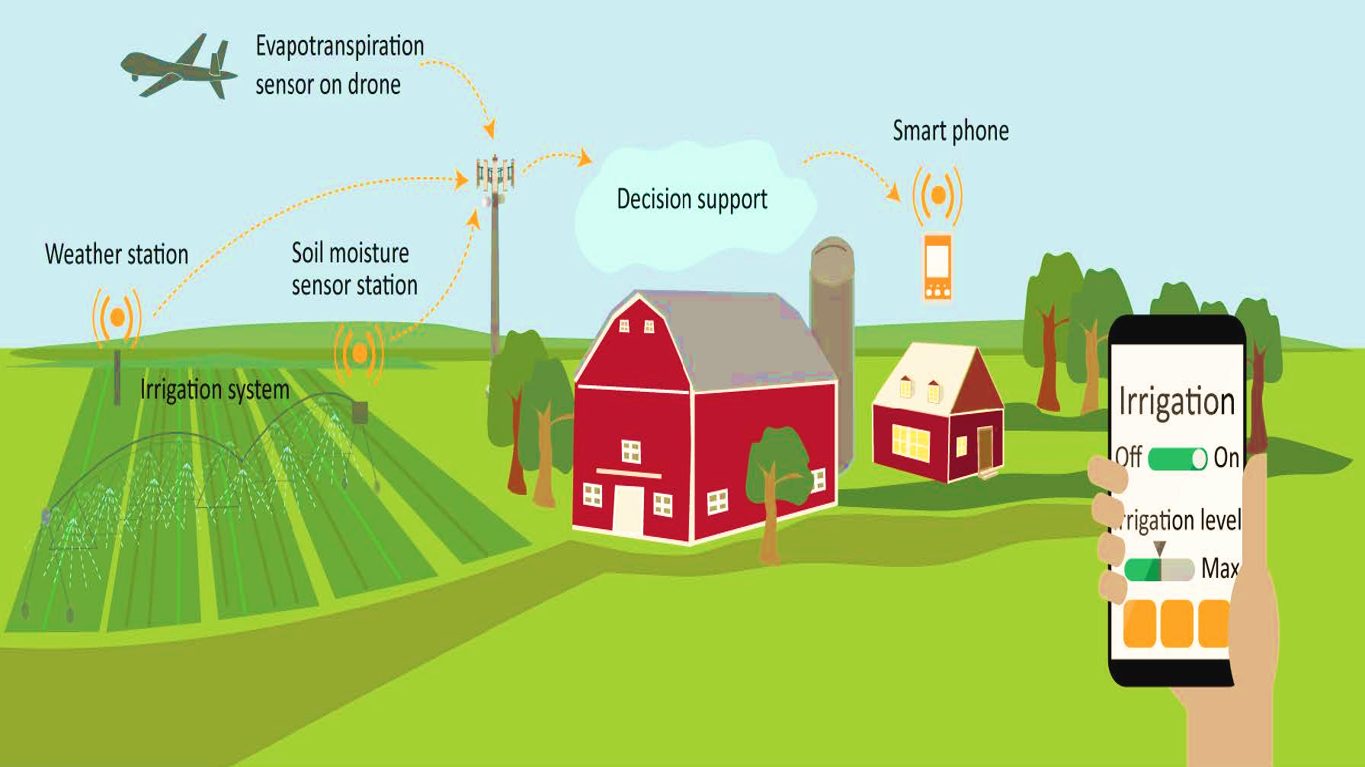
GIS-driven data provides valuable insights into soil moisture levels, helping farmers make informed decisions regarding irrigation scheduling. This ensures water efficiency and prevents overwatering or drought stress.

The Importance of Variable Rate Irrigation

GIS technology for agriculture provides a potent toolbox for spotting crops that are under water stress. Farmers can learn more about the water state of their crops by using indices like the Normalized Difference Water Index (NDWI) or the Normalized Difference Moisture Index (NDMI).

The default component of GeoPard Crop Monitoring, the NDMI index, offers a scale from -1 to 1. Water shortages are indicated by negative values around -1, but waterlogging may be indicated by positive values close to 1.

7. Flooding, Erosion, and Drought Control

Flooding, erosion, and drought represent formidable adversaries that can inflict substantial damage on agricultural landscapes. Beyond physical destruction, these challenges disrupt water availability, soil health, and overall crop productivity. Effectively managing these threats is pivotal to ensuring food security, preserving natural resources, and fostering sustainable farming practices.

Geoinformatics aids in assessing landscape vulnerabilities to flooding, erosion, and drought. By analyzing topographical data, rainfall patterns, and soil characteristics, farmers can implement strategies to mitigate these risks.

8. GIS in Farming Automation

Geographic Information Systems (GIS) have transcended their traditional role as mapping tools to emerge as critical enablers in guiding automated machinery. This technology empowers various agricultural equipment, such as tractors and drones, with spatial data and precision navigation systems.

As a result, tasks that range from planting to spraying and harvesting can be executed with unprecedented accuracy and minimal human intervention.

GIS in Farming Automation

Imagine a scenario where a tractor is tasked with planting crops across a vast field. Equipped with a GPS system and GIS technology, the tractor utilizes spatial data to navigate along predetermined routes, ensuring consistent seed placement and optimal spacing. This precision not only enhances crop yield but also minimizes resource wastage.

Role of Geoinformatics in Precision Agriculture

It plays a critical role in precision agriculture by providing farmers with the data and tools they need to make informed decisions about crop management. It can be used to collect data on a variety of factors, such as soil type, crop yield, and pest infestation.

This data can then be analyzed to identify areas of variability within a field. Once these areas have been identified, farmers can use GIS to develop customized management plans for each area.

The use of geoinformatics in precision agriculture is growing rapidly around the world. In the United States, for example, the use of precision agriculture has increased by more than 50% in the past five years. And in China, the use of precision agriculture is expected to grow by more than 20% per year in the coming years.

Studies have revealed that precision application of inputs through Geoinformatics techniques can lead to yield increases of up to 15% while reducing input costs by 10-30%.

Furthermore, a study published in the journal Nature in 2020 found that using GIS to manage water irrigation in a wheat field resulted in a 20% increase in crop yield. Another study, published in the journal Science in 2021, found that using GIS to apply fertilizer more precisely in a corn field resulted in a 15% increase in crop yield.

It can also be used to create maps of crop yield. These maps can be used to identify areas of low yield, which can then be investigated to determine the cause of the problem. Once the cause of the problem has been identified, farmers can take corrective action to improve yields in those areas.

Role of Geoinformatics in Precision Agriculture

For example, farmers can use it to create maps of soil type and fertility. These maps can then be used to target fertilizer applications more precisely, which can help to improve crop yields and reduce the amount of fertilizer that is applied unnecessarily.

In addition to collecting and analyzing data, it can also be used to visualize spatial data. This can be helpful for farmers to see how different factors, such as soil type and crop yield, are distributed across a field. Visualization tools can also be used to help farmers communicate their findings to others, such as crop consultants or government officials.

The real-world applications of geoinformatics in precision agriculture are abundant. For instance, Variable Rate Technology (VRT) employs spatial data to deliver varying amounts of inputs like water, fertilizers, and pesticides across a field.

This approach ensures that crops receive the exact nutrients they need, optimizing growth and yield. In another instance, satellite imagery and drones provide valuable insights into crop health and disease detection, enabling prompt intervention.

GeoPard Crop Monitoring As An Example Of Agriculture GIS Software

It’s crucial to keep in mind that the GIS software used in agriculture can differ depending on its intended use. While some tools indicate soil moisture levels to aid with planting selections, others display crop varieties, yields, and distributions.

Even comparing the economics of logging against forestry can be done with the use of various applications. Each farmer or agriculture manager must therefore discover the ideal GIS solution that provides them with the information they need to make wise decisions on their land.

When it comes to field data, GeoPard’s Crop Monitoring platform has a number of advantages. It offers summaries of vegetation and soil moisture dynamics, historical vegetation and weather data, and precise 14-day weather forecasts.

GeoPard provides automated synchronization of crop monitoring

This platform provides capabilities like scouting to organize activities and exchange real-time information, as well as a field activity log for planning and monitoring operations, so it offers more than just GIS-based data.

Data from additional sources is also included in GeoPard’s Crop Monitoring. The Data Manager tool, for instance, incorporates machine data into the platform. It supports popular file formats as SHP and ISO-XML.

You can measure crop yield using data from field machines, compare it to fertilizer maps, examine fertilizer tactics, and create plans to increase yield. The organizations that agricultural enterprises collaborate with and themselves benefit greatly from this all-in-one platform.

Challenges in Precision Agriculture and Geoinformatics

The integration of Precision Agriculture and Geoinformatics introduces a host of policy implications and regulatory considerations. Governments worldwide grapple with devising frameworks that foster innovation while safeguarding data privacy, land use, and environmental sustainability.

For instance, regulations may govern the collection and sharing of spatial data, intellectual property rights for precision farming technologies, and ethical use of AI in agriculture.

In the European Union, the Common Agricultural Policy (CAP) acknowledges the role of digital technologies, including Geoinformatics, in enhancing agricultural productivity.

Financial incentives are provided to encourage farmers to adopt precision farming practices that align with environmental and sustainability goals. This example illustrates how policy can drive technology adoption for collective benefit.

However, the adoption of geoinformatics technologies in agriculture presents significant benefits, yet it’s accompanied by challenges, particularly for farmers of varying scales. Small-scale farmers often face financial limitations, lacking the resources for technology acquisition and training.

Larger operations encounter data management complexities due to the scale of their activities. Technical knowledge gaps are common, with both small and large farmers requiring training to effectively utilize geoinformatics tools.

Limited infrastructure and connectivity hinder access, especially in remote areas. Customization struggles arise, as solutions may not fit small farms or integrate seamlessly into larger operations.

Cultural resistance to change and concerns over data privacy affect adoption universally. Government policies, ROI uncertainties, and interoperability issues further impede progress.

Addressing these challenges will demand tailored strategies to ensure that geoinformatics benefits all farmers, regardless of scale.

Conclusion

The seamless integration of Geoinformatics into modern agriculture holds transformative potential. By harnessing the power of spatial data, farmers and agricultural stakeholders can make informed decisions, optimize resource utilization, and foster sustainable practices. Whether it’s predicting crop yields, managing water resources, or enhancing precision agriculture, GIS emerges as a guiding light, shaping a more efficient, resilient, and productive future for the world of farming.

LfL Leverages GeoPard Platform for Its Future Crop Farming Project

Agriculture today faces major challenges. It has to produce high-quality food and raw materials, but increasingly it also has to take into account requirements for the protection of soil, water, climate, and biodiversity.

The Bavarian State Research Center for Agriculture (LfL) has long been conducting research on these challenges and is now testing the GeoPard precision agriculture platform for its Future Crop Farming project.

Dmitry Dementiev, CEO and Co-Founder of GeoPard: “Traditional crop farming methods often face challenges such as inefficient resource management and limited access to real-time data. These factors can lead to suboptimal crop yields, increased costs, and environmental strain.”

GeoPard’s platform provides LfL with a centralized platform to visualize and analyze critical farming data. The platform’s user-friendly interface permits the combination of satellite data and experimental data from the field trial, simplifying complex data interpretation and empowering users to make informed choices that optimize productivity and sustainability.

The field was divided into sections to showcase a specific setup for the trial: LfL has implemented a strip intercropping system, i.e., the simultaneous cultivation of multiple crops in parallel strips in the same field.

These strips can subsequently be employed separately in equations for inputs (such as fertilizer and plant protection) and yield results, enabling the computation of overall field

profit. Moreover, the profits generated by individual crops and the possible impacts at the edges between strips can be assessed.

The collaboration between LfL and GeoPard through the Future Crop Farming project can move forward analysis tools for unconventional field structures.

By leveraging GeoPard’s advanced platform, it can complement its research results and create valuable visualizations for communicating insights from the project to the public.

With a focus on precision farming, productivity, and environmental stewardship, the innovative LfL project showcases the potential for a more sustainable future in crop farming.

PD Dr. Markus Gandorfer, Head of Digitalization and Project Lead at LfL: “It is a pleasure for us to work with the enthusiastic GeoPard team. Deeper insights into our strip-intercropping data enabled by the GeoPard tool are very valuable to us.”

About

Bavarian State Research Center for Agriculture (LfL) The Bavarian State Research Center for Agriculture (LfL) is the knowledge and service center for agriculture in Bavaria. The applied research of the LfL takes up issues of agricultural practice and provides applicable solutions for agricultural enterprises in various ways.

The interdisciplinary Future Crop Farming project is located in Ruhstorf a.d. Rott in southeastern Bavaria. More information about the project can be found on the project website: http://www.future-crop-farming.de

GeoPard Agriculture is a leading provider of precision farming software. The company was founded in 2019 in Cologne, Germany, and is represented globally. The company offers a range of solutions that help farmers to optimize their operations and increase yields.

With a focus on sustainability and regenerative economics, GeoPard Agriculture aims to promote precision farming practices around the world.

The company’s partners include such well-known brands as John Deere, Corteva Agriscience, ICL, Pfeifer & Langen, IOWA Soybean Association, Kernel, MHP, SureGrowth, and many others.

Utilizing GPS Technology to Optimize Cover Crop Cultivation

The agricultural industry is experiencing a big change, with the adoption of modern technologies like GPS systems becoming more common.

This is especially noticeable in how farmers grow cover crops. GPS technology is revolutionizing the way they manage their fields, helping them become more efficient and sustainable in their agricultural practices.

Cover crops, sometimes called green manure, are plants grown primarily to improve soil health rather than for harvest. They are usually cultivated during the off-season and provide benefits like controlling weeds, enhancing biodiversity, and boosting soil fertility.

Yet, growing cover crops can be laborious and time-consuming. That’s where GPS technology comes in handy.

Incorporating GPS technology into farming brings numerous advantages. Firstly, it allows precision farming, where farmers can use GPS coordinates to create precise maps of their fields.

This helps them closely monitor crop growth and soil conditions. By relying on data, they can apply fertilizers and pesticides more accurately, reducing waste and minimizing harm to the environment.

Moreover, GPS technology greatly boosts the efficiency of planting cover crops. Conventional methods may lead to uneven distribution of seeds, leaving some areas poorly covered.

With GPS-guided machinery, farmers can ensure even distribution across the entire field, promoting better growth and soil coverage. This not only enhances the effectiveness of the cover crops but also reduces the need for labor and resources.

Additionally, GPS technology enables farmers to implement more effective crop rotation strategies. With precise field mapping and crop growth tracking, they can optimize soil health and productivity through well-planned rotations. This can result in higher yields over time, further improving agricultural efficiency.

Moreover, GPS technology plays a vital role in monitoring and managing pests and diseases. It allows farmers to track the location and spread of these problems, enabling them to take targeted actions for control. As a result, the use of broad-spectrum pesticides can be reduced, promoting a healthier and more sustainable agricultural system.

GPS technology offers benefits beyond just individual farmers when it comes to cover crop cultivation. It has the potential to encourage sustainable and efficient agricultural practices on a global scale.

By reducing waste and making the best use of resources, GPS technology can play a significant role in meeting the rising global food demand in an environmentally friendly manner.

However, using GPS technology in agriculture poses challenges for many farmers, such as expensive upfront costs and a lack of technical know-how. To tackle these hurdles, it is crucial to offer support to farmers.

This can be achieved through financial incentives, training programs, and the development of user-friendly software and equipment, enabling them to make the most of this technology effectively.

In conclusion, using GPS technology in cover crop cultivation has the potential to significantly improve agricultural efficiency. It allows for precise farming, better seeding practices, effective crop rotation, and enhanced pest and disease management. By offering the right support and resources, farmers can take advantage of GPS technology to create a more sustainable and productive agricultural sector.

Introducing GeoPard’s Profit Maps: A Step Forward in Precision Agriculture

The profit map from the example in the screenshot takes into account the as-applied datasets of fertilization, seeding, two times of crop protection application, and harvesting. Other expenses can be added to the calculation, such as land preparation, miscellaneous activities as well.

Precision agriculture is a data-driven approach that seeks to increase efficiency and profitability. GeoPard, a leading provider of precision agriculture solutions, is enhancing its data analysis capabilities with the introduction of Profit Maps.

This feature provides a visual representation of profitability at the subfield level, enabling more informed decision-making and resource allocation. You’ll be able to see at a glance where your fields are making you money and where the costs of inputs and changes aren´t paying off.

Profit Maps are generated by integrating various data layers, including as-applied seeding, crop protection application, fertilizer usage, and harvesting data. This information is sourced directly from agricultural equipment and the John Deere Operations Center.

GeoPard then applies a custom equation, factoring in the cost of each input, to calculate zone-level profitability. These profit maps provide a comprehensive view of the profit spread across different field zones.

One of the key features of GeoPard’s Profit Maps is the ability to display the spread in profit across different zones of a field. This is calculated in dollars/euros/any currency and provides a clear indication of how much profit a farmer is making in each specific area.

By having this information at their fingertips, farmers can make more informed decisions about where and how to use their agricultural inputs.

For instance, they might choose to invest more in areas with higher profitability or reconsider their strategies in zones with lower returns. This granularity level in data analysis sets GeoPard’s Profit Maps apart.

Vladimir Klinkov, Managing Director of GeoPard, emphasizes the transformative potential of this tool, stating, “These maps allow farmers to make more informed decisions about resource distribution and costs on each hectare of the field and plan their business more effectively.”

The practical application of Profit Maps is already being demonstrated in real-world scenarios. Eurasia Group Kazakhstan, an official John Deere dealer, has been leveraging this feature to optimize its operations.

Evgeniy Chesnokov, Director of Agricultural Management at Eurasia Group Kazakhstan LLP, shares his experience: “With the help of GeoPard Agriculture’s Profit Map, we were able to gain a deeper understanding of the profitability of our partners’ fields.

This allowed our farmers to make more strategic decisions on the allocation of resources, which ultimately increased operational efficiency and improved bottom line indicators.”

GeoPard’s Profit Maps represent a significant advancement in precision agriculture, providing farmers with the insights they need to optimize their operations and maximize profitability. As the industry continues to evolve, tools like these will play an increasingly important role in shaping the future of farming.

For more insights into the development and application of profitability maps in precision agriculture, you can explore these resources: Kansas State University, ASPEXIT, Chilean Journal of Agricultural Research, USDA, and ResearchGate.

Stay tuned for more updates as GeoPard continues to innovate and push the boundaries of what’s possible in precision agriculture.

About the companies:

GeoPard is a leading provider of precision farming software. The company was founded in 2019 in Cologne, Germany, and is represented globally. The company offers a range of solutions that help farmers optimize their operations and increase yields.

With a focus on sustainability and regenerative economics, GeoPard aims to promote precision farming practices around the world.

The company’s partners include such well-known brands as John Deere, Corteva Agriscience, ICL, Pfeifer & Langen, IOWA Soybean Association, Kernel, MHP, SureGrowth, and many others.

Eurasia Group Kazakhstan is the Kazakh representative office of Swiss company Eurasia Group AG, an official dealer of John Deere in the Republic of Kazakhstan and Kyrgyzstan since 2002. The company delivers solutions for agriculture from leading world manufacturers like JCB, Väderstad, GRIMME, and Lindsay, covering all areas of crop and horticulture.

Eurasia Group Kazakhstan pays great attention during all its activity to the technologies of precise agriculture, completing the line of machinery with products of digitalization of agriculture.

Eurasia Group Kazakhstan has an extensive regional network – 14 regional offices in Kazakhstan and one in Kyrgyzstan, more than 550 employees, of which almost half – after-sales service employees, its own department of agricultural management and digitalization.

Over the years, more than 13,000 units of equipment have been supplied to Kazakhstan and 4.4 million hectares of land have been digitized. This year the company celebrates its 25th anniversary.

GeoPard’s Crop Development Graphs for Precision Agriculture

Today’s agricultural industry requires not only hard work and understanding of the land, but also the smart application of technology. I am thrilled to share an insight into one of the tools making a significant difference in sustainable farming practices: GeoPard’s Crop Development Graphs.

Our Crop Development Graphs offer a comprehensive, user-friendly display of crop growth data since 1988. Automatically generated for any field, these graphs are designed to ensure precision and accuracy.

The data is calculated solely for the cloud and shadow-free area of the field. A simple hover reveals the average NDVI (Normalized Difference Vegetation Index) value, providing an instant snapshot of crop health.

But what sets our tool apart? The capability to switch views. GeoPard’s interface allows users to alternate between Yearly and Monthly views. This level of detail ensures you are equipped with the essential data to make well-informed decisions about crop management, harvest timing, and yield prediction.

In the hands of a farmer, this precise insight can guide field management strategies, helping to detect the optimal harvest time, monitor crops at scale, and overall, optimize productivity and sustainability.

This is an exciting step forward in precision farming, a path that leads not only to improved yields but also to more sustainable practices that consider our environmental footprint.

Stay tuned for more updates as we continue to develop and refine our tools to serve the agricultural community better. We’re on a journey to make precision farming more accessible and efficient, and we’re thrilled to have you join us. Together, let’s redefine the future of farming!

Calculating Difference Between Target Rx and As-Applied Maps

In precision agriculture, one of the common challenges is ensuring the application of seeds, fertilizers, or crop protection agents as per the prescribed rate (Target Rx).

Variations between the target prescription and what is actually applied on the field (As-Applied) could lead to inefficient use of resources and impact crop performance.

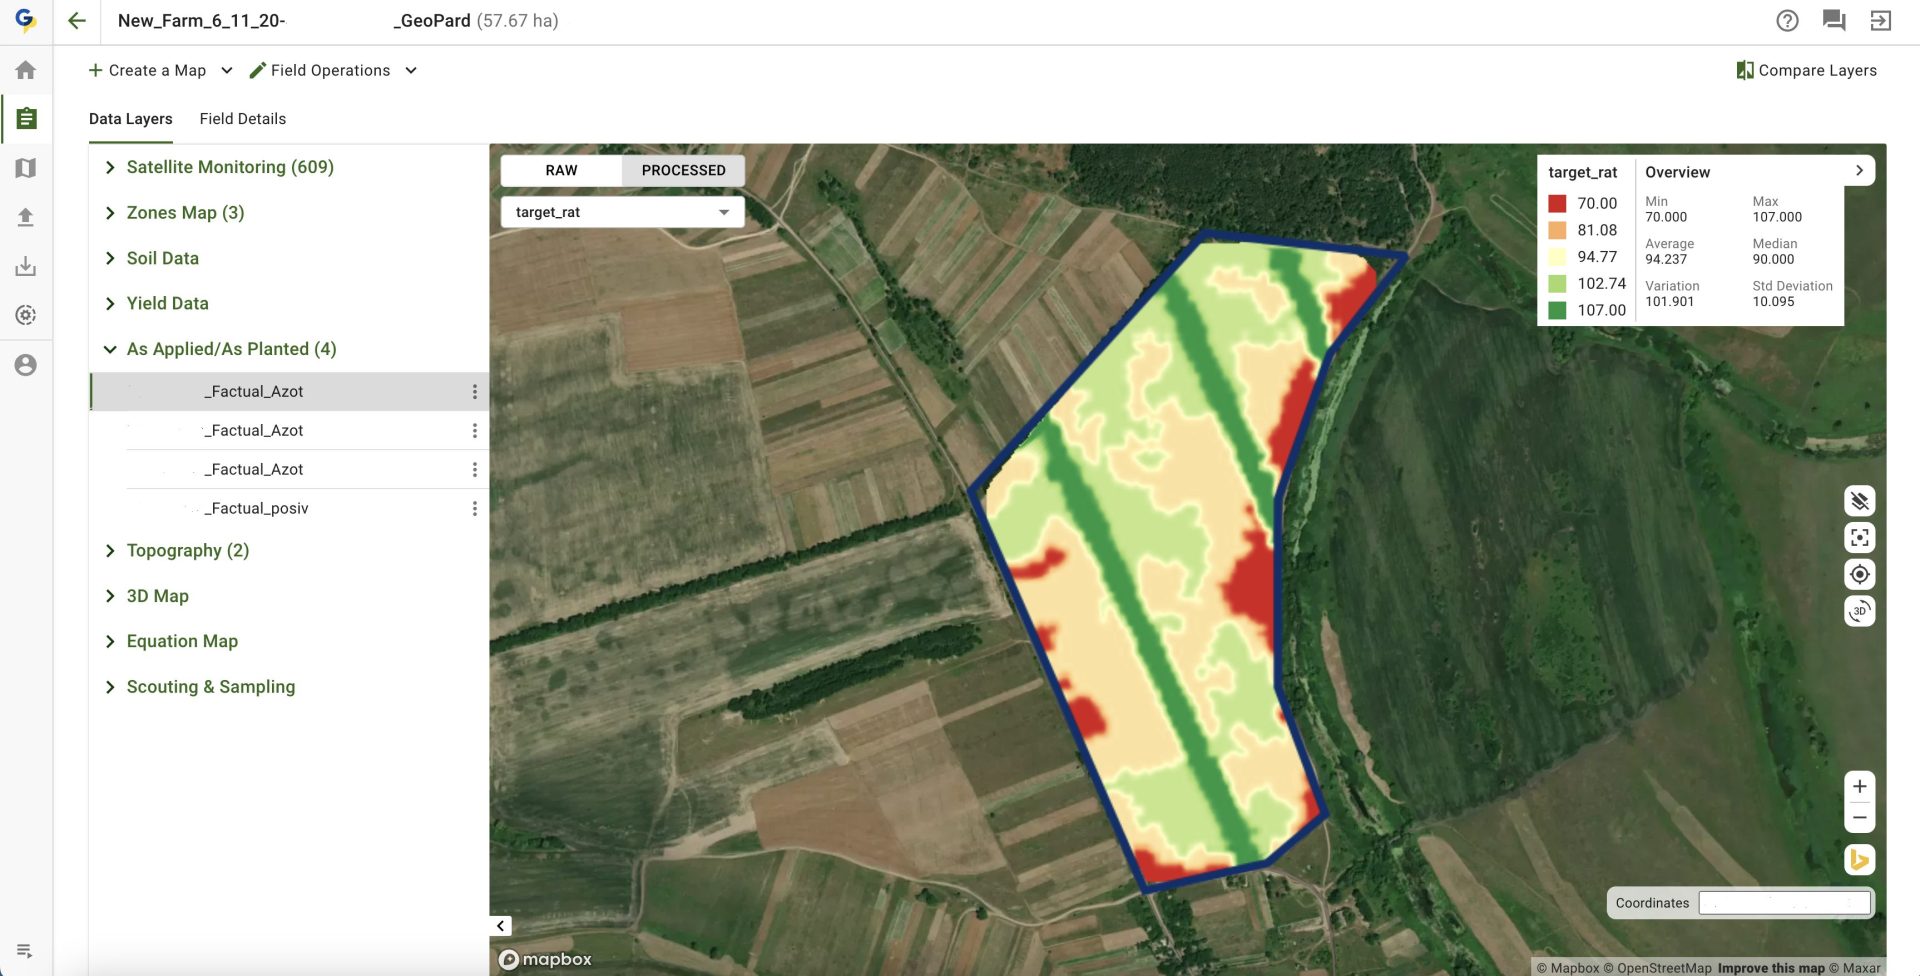
By leveraging GeoPard’s powerful analytics, you can calculate and visualize the differences between your Target Rx and As-Applied maps.

This difference analysis can serve as an important tool to quickly identify issues with equipment, application timing, or the actual application itself.

Let’s take a deeper look into this:

  • Visualizing Differences: GeoPard’s platform allows you to generate a “difference map”, overlaying your Target Rx and As-Applied data. This visual representation of variance provides a quick and intuitive way to spot areas where the actual application didn’t match the target.
  • Identifying Problems: By comparing the difference map against your original Rx and As-Applied maps, you can pinpoint specific areas or trends that might indicate equipment malfunction, sub-optimal application timing, or issues with the applied product itself.
  • Improving Efficiency: This analysis can help you optimize resource usage by addressing the identified issues, thus aligning your As-Applied rates closer to your Target Rx for future applications.
  • Enhancing Crop Performance: By ensuring that your field receives the right amount of inputs at the right time, you can boost crop health and potentially increase yield.

Remember, precision agriculture is all about making more informed and accurate decisions. By integrating this feature into your regular farm management practices, you can ensure you’re getting the most out of your inputs and drive your farm towards greater productivity and profitability.

Application prefix contains the operations related to the applied application some of them are:

1. Application Applied Rate – original applied map from the machinery (how was the product applied)

Application_AppliedRate.png - original applied map from the machinery (how was the product applied)

2. Application Target Rate – original target from the machinery (how has the product to be applied)

Application_TargetRate.png - original target from the machinery (how has the product to be applied)

3. Application Accuracy Clusterization – clusterization of the results: 0 – no data (machine did not visit these spots), 1 – applied below the target and not in the acceptable range (+-5% from the target)t, 2 – applied in the acceptable range ( +-5% from target), 3 – applied above the target and not in the acceptable range (+-5% from the target)

Application_AccuracyClusterization.png - clusterization of the results: 0 - no data (machine did not visit these spots), 1 - applied below the target and not in the acceptable range (+-5% from the target)t, 2 - applied in the acceptable range ( +-5% from target), 3 - applied above the target and not in the acceptable range (+-5% from the target)

4. Application Rate Difference – difference between applied and target rates in absolute numbers (l/ha units)

Application_RateDifference.png - difference between applied and target rates in absolute numbers (l/ha units)


Seeding prefix contains the operations related to the seeding some of them are:

1. Seeding Applied Rate – original applied from the planter (how many seeds were seeded)

Seeding_AppliedRate.png - original applied from the planter (how many seeds were seeded)

2. Seeding Target Rate – original target from the planter (how many seeds have to be seeded)

Seeding_TargetRate.png - original target from the planter (how many seeds have to be seeded)

3. Seeding Accuracy Clusterization – same clusterization rules, BUT the acceptable range is +-1% from the target

Seeding_AccuracyClusterization.png - same clusterization rules, BUT the acceptable range is +-1% from the target

4. Seeding Accuracy Clusterization Zoomed – same as Seeding Accuracy Clusterization but zoomed to show same area as Seeding Target Rate and Seeding Applied Rate

Seeding_AccuracyClusterizationZoomed.png - same as Seeding_AccuracyClusterization.png but zoomed to show same area as Seeding_TargetRate.png and Seeding_AppliedRate.png

5. Seeding Rate Difference – the difference between applied and target rates in absolute numbers (seeds/ha units)

5. Seeding Rate Difference - the difference between applied and target rates in absolute numbers (seeds/ha units)

What is target prescription (Target Rx) in agriculture?

In agriculture, the target prescription refers to the recommended or desired set of practices or inputs prescribed for optimal crop growth, health, and yield. It serves as a guideline or plan for farmers to follow in order to achieve specific agricultural objectives.

The target prescription takes into account various factors such as crop type, growth stage, soil conditions, climate, pest and disease pressures, and nutrient requirements.

It provides instructions on the application of fertilizers, pesticides, irrigation, crop rotation, seed selection, planting density, and other essential agricultural practices.

The purpose of a target prescription is to provide farmers with scientifically backed recommendations based on research, agronomic knowledge, and local conditions. It aims to optimize resource utilization, minimize crop losses, and enhance overall agricultural productivity.

Target prescriptions are often developed by agricultural experts, agronomists, agricultural extension services, or research institutions.

They may be specific to different crops, regions, or even individual fields, taking into account the unique characteristics and challenges of each farming context.

Farmers use target prescriptions as a reference point to guide their decision-making and management practices.

By following the recommended guidelines, farmers aim to maximize crop health, yield, and quality while minimizing the negative impact on the environment.

It is important to note that target prescriptions should be flexible and adaptable to account for variations in local conditions and the need for sustainable farming practices.

Farmers may need to make adjustments based on real-time observations, on-farm experiences, and continuous monitoring to ensure the best possible outcomes for their specific agricultural operations.

What is applied on the field (As-Applied)?

As-applied agriculture encompasses the process of accurately and precisely applying inputs, such as fertilizers, pesticides, and irrigation, to crops based on real-time data and site-specific conditions.

It involves the integration of various technologies, including GPS (Global Positioning System), GIS (Geographic Information System), sensors, and variable rate application equipment.

What is Variations between them?

In agriculture, variations between the target prescription and the actual application on the field refer to the differences or deviations between the recommended or desired agricultural practices and the real-world implementation.

These variations can manifest in various aspects, including the use of fertilizers, pesticides, irrigation, cultivation techniques, and more.

Factors Influencing Variations

Several factors contribute to variations between the target prescription and actual field application in agriculture:

  • Environmental Factors: Agricultural practices are influenced by dynamic environmental conditions, including soil composition, climate patterns, and water availability. Variations may arise due to unexpected changes in these factors, affecting the feasibility and effectiveness of prescribed practices.
  • Human Factors: The knowledge, skills, and expertise of farmers play a crucial role in implementing prescribed practices accurately. Variations can occur when farmers encounter challenges in understanding or interpreting the prescribed instructions, leading to deviations during the application.
  • Technological Limitations: Agricultural technology, while advanced, may not always be accessible or affordable to all farmers. Variations can arise when farmers do not have access to the latest equipment, precision farming tools, or real-time data, impacting the accuracy of field applications.
  • Timing and Logistics: Agriculture is time-sensitive, with specific windows for planting, harvesting, and applying agrochemicals. Variations may occur if farmers face logistical constraints, such as delays in procuring inputs or adverse weather conditions that disrupt the timely application of prescribed practices.

Conclusion

Variations between the target prescription and actual field application in agriculture present challenges that need to be addressed for sustainable and efficient farming practices. Understanding the factors contributing to these variations and their impact on agricultural outcomes is crucial.

Automated Field Boundaries Detection Model for Precision Agriculture by GeoPard

GeoPard have completed a successful development of an automated field boundaries detection model using mutli-year satellite imagery, accurate cloud and shadow detection, and advanced proprietary algorithms, including deep neural networks.

The GeoPard field detection model has achieved a state-of-the-art accuracy of 0.975 on the Intersection over Union (IoU) metric, validated across diverse regions and crop types globally.

Check out these images to see the results in Germany (average field size is 7 hectares):

1 - Raw Sentinel-2 image

1 – Raw Sentinel-2 image

3 - Segmented field boundaries

2 – Super-resolution Sentinel-2 image by GeoPard (1 meter resolution)

2 - Super-resolution Sentinel-2 image by GeoPard

3 – Segmented field boundaries, 0.975 Intersection over union (IoU) accuracy metric, across multiple international regions and crop types.


Integration into our API and GeoPard application is coming soon. This automated and cost-effective method helps predict yields, benefits governmental organizations, and assists large landowners who often need to update field boundaries between seasons.

GeoPard’s approach utilizes multi-year crop vegetation trends using multi-factor analysis and crop rotation.


The model is accessible via the GeoPard API on a pay-as-you-go basis, offering flexibility without the need for costly subscriptions.


What is Field Boundaries Delineation?

Field boundaries delineation refers to the process of identifying and mapping the boundary of agricultural fields or parcels of land. It involves using various techniques and data sources to demarcate the limits of individual fields or agricultural plots.

Traditionally, field boundaries were delineated manually by farmers or landowners based on their knowledge and observations.

However, with advancements in technology, particularly in remote sensing and geographic information systems (GIS), automated and semi-automated methods have become increasingly prevalent.

One common approach is the analysis of satellite or aerial imagery. High-resolution images captured by satellites or aircraft can provide detailed information about the landscape, including the boundaries between different land parcels.

Image processing algorithms can be applied to these images to detect distinct features such as changes in vegetation type, color, texture, or patterns that indicate the presence of field boundaries.

Another technique involves using LiDAR (Light Detection and Ranging) data, which uses laser beams to measure the distance between the sensor and the Earth’s surface.

LiDAR data can provide detailed elevation and topographic information, allowing for the identification of subtle variations in terrain that may correspond to field boundaries.

Additionally, geographic information systems (GIS) play a crucial role in delineation of field boundaries.

GIS software allows for the integration and analysis of various data layers, including satellite imagery, topographic maps, land ownership records, and other relevant information. By combining these data sources, GIS can aid in the interpretation and identification of field boundaries.

The accurate delineation of field is essential for several reasons. It facilitates better management of agricultural resources, enables precision farming techniques, and supports the planning and implementation of agricultural practices such as irrigation, fertilization, and pest control.

Accurate field boundary data also assists in land administration, land-use planning, and compliance with agricultural regulations.

How it is useful?

It plays a crucial role in agriculture and land management, providing several benefits and importance supported by evidence and global figures. Here are some key points:

1. Precision Agriculture: Accurate field boundaries help in implementing precision agriculture techniques, where resources such as water, fertilizers, and pesticides are precisely targeted to specific areas within fields.

According to a report by the World Bank, precision agriculture technologies have the potential to increase crop yields by 20% and reduce input costs by 10-20%.

2. Efficient Resource Management: It enables farmers to better manage resources by optimizing irrigation systems, adjusting fertilization practices, and monitoring crop health. This precision reduces resource wastage and environmental impact.

The Food and Agriculture Organization (FAO) estimates that precision agriculture practices can reduce water usage by 20-50%, decrease fertilizer consumption by 10-20%, and reduce pesticide usage by 20-30%.

3. Land Use Planning: Accurate field boundary data is essential for land use planning, ensuring efficient utilization of available agricultural land. It allows policymakers and land managers to make informed decisions regarding land allocation, crop rotation, and zoning.

This can lead to increased agricultural productivity and improved food security. A study published in the Journal of Soil and Water Conservation found that effective land use planning could increase global food production by 20-67%.

4. Farm Subsidies and Insurance: Many countries provide agricultural subsidies and insurance programs based on field boundaries. Accurate delineation helps in determining eligible land areas, ensuring fair distribution of subsidies, and calculating insurance premiums accurately.

For instance, the European Union’s Common Agricultural Policy (CAP) relies on accurate field boundaries for subsidy calculations and compliance monitoring.

5. Land Administration and Legal Boundaries: Field boundaries delineation in agriculture is crucial for land administration, property rights, and resolving land disputes. Accurate maps of field boundaries help establish legal ownership, support land registration systems, and facilitate transparent land transactions.

The World Bank estimates that only 30% of the world’s population has legally documented rights to their land, highlighting the importance of reliable field boundary data for secure land tenure.

6. Compliance and Environmental Sustainability: Accurate field boundaries aid in compliance monitoring, ensuring adherence to environmental regulations and sustainable farming practices.

It helps identify buffer zones, protected areas, and areas prone to erosion or water contamination, enabling farmers to take appropriate measures. Compliance with environmental standards enhances sustainability and reduces negative impacts on ecosystems.

According to the FAO, sustainable farming practices can mitigate up to 6 billion tons of greenhouse gas emissions annually.

These points illustrate its usefulness and importance in agriculture and land management. The evidence and global figures presented support the positive impacts it can have on resource efficiency, land use planning, legal frameworks, environmental sustainability, and overall agricultural productivity.

In summary, field boundaries delineation in agriculture is the process of identifying and mapping the boundary of agricultural fields or parcels of land. It relies on various techniques such as satellite imagery analysis, LiDAR data, and GIS to accurately define and demarcate these boundaries, enabling effective land management and agricultural practices.

What are Major Components of Precision Farming?

Precision farming, also known as precision agriculture (PA), is a modern approach to agricultural management that uses advanced technologies and primary components of precision farming to optimize agricultural production and minimize waste.

It has gained significant momentum in recent years due to its potential to improve agricultural productivity, reduce waste, and promote sustainability.

According to a report by Grand View Research, the global precision farming market size was valued at USD 5.44 billion in 2020 and is expected to grow at a compound annual growth rate (CAGR) of 12.7% from 2021 to 2028.

This growth is attributed to the increasing adoption of precision farming technologies by farmers worldwide.

Components of Precision Farming

The major components include information, technology, and management, which are integrated to optimize production.

Information:

Information is a key component of precision farming. This component includes gathering data about soil, weather, crops, and other factors that affect agricultural production. This information is collected through various sources such as sensors, drones, satellites, and ground-based equipment.

Once the data is collected, it is analyzed using advanced software and algorithms to generate actionable insights. These insights help farmers to make informed decisions about planting, fertilizing, irrigating, and harvesting crops.

For example, soil sensors can be used to measure soil moisture, temperature, and nutrient levels, which can help farmers to determine the optimal time to plant and fertilize crops.

Similarly, weather data can be used to predict the likelihood of pests and diseases, which can help farmers to take preventive measures before the crops are affected.

components of precision farming include information

Technology:

Technology is another major component. This component includes a wide range of technologies such as GPS, drones, robotics, and advanced machinery.

These technologies are used to automate various agricultural processes, reduce labor costs, and improve efficiency.

For example, GPS technology can be used to guide tractors and other farm equipment, which can reduce overlap in operations and minimize fuel consumption.

Similarly, drones can be used to monitor crop health and detect pests and diseases, which can help farmers to take timely action to prevent crop damage.

Management:

Management is the third major component of precision farming. This component includes the use of advanced software and tools to manage agricultural operations, optimize resource use, and minimize waste. This component also includes the adoption of sustainable agricultural practices to protect the environment and promote long-term sustainability.

For example, precision farming software can be used to plan crop rotations, optimize irrigation, and monitor crop growth, which can help farmers to maximize yields and minimize waste.

Similarly, sustainable agricultural practices such as conservation tillage, cover cropping, and integrated pest management can help farmers to reduce soil erosion, conserve water, and minimize the use of pesticides.

How Components of Precision Farming Can be Implemented?

There are several systems and processes that farmers can follow. These systems are designed to help farmers collect and analyze data, automate agricultural processes, and make informed decisions about resource use and crop management.

Here are some of the systems and processes that farmers can adopt to implement the components of precision agriculture:

Farm Management Software:

Farm management software is a key tool for implementing the management component. This software can help farmers to plan and manage their agricultural operations, track input use and costs, and monitor crop growth and yields.

How Components of Precision Farming Can be Implemented

Farm management software can also be used to integrate data from various sources, such as soil sensors and weather stations, to provide real-time insights that can inform decision-making.

GPS and Auto-steering:

GPS technology is essential for implementing the technology. By using GPS-enabled farm equipment, farmers can ensure that they are operating with maximum efficiency, reducing overlap in operations and minimizing fuel consumption.

Auto-steering technology can also be used to guide farm equipment, which can improve accuracy and reduce operator fatigue.

Sensors and Drones:

Sensors and drones are essential for implementing the information. These tools can be used to collect data on soil moisture, temperature, and nutrient levels, as well as monitor crop growth and detect pests and diseases.

This data can then be analyzed to generate insights that can inform crop management decisions, such as when to plant and fertilize crops, and when to take preventive measures against pests and diseases.

Irrigation Management:

Irrigation management is a critical component. By using soil moisture sensors and weather data, farmers can optimize irrigation schedules to ensure that crops receive the right amount of water at the right time.

This can help to reduce water waste, minimize the risk of crop damage due to over- or under-watering, and improve yields.

Crop Monitoring:

Crop monitoring is another important component. By using drones or satellite imagery, farmers can monitor crop growth and detect potential issues such as nutrient deficiencies or pest infestations.

This can help farmers to take timely action to address these issues, improving crop health and maximizing yields.

In conclusion, to implement the components, farmers can adopt a range of systems and processes that enable them to collect and analyze data, automate agricultural processes, and make informed decisions about resource use and crop management. By leveraging the power of technology, data, and management, precision farming can help farmers to achieve greater efficiency, sustainability, and profitability in their agricultural operations.

GeoPard integration with UP42

GeoPard and UP42 are proud to announce technical partnership between the platforms.


GeoPard analytical blocks are now available at the UP42 GIS marketplace and include the following capabilities:

  • Integrated satellite constellations: Pleiades, Pleiades NEO, SPOT
  • Supported vegetation indices: NDVI, EVI, SAVI, NDWI
  • The output in COG format (Cloud Optimized GeoTIFF)


The integration will allow Up42 clients to get access to the advanced crop (without limitation to only crops) monitoring using GeoPard satellite imagery processing algorithms.

GeoPard analytical block is used to calculate NDWI on top of 30cm resolution Pleiades NEO.


Dmitry Dementiev, GeoPard’s CEO: “Technical partnership with UP42 allows UP42 clients to use novel GeoPard’s geospatial analytics, including the processing of satellite images at high scale and unpreceded speed for such huge datasets. The analytical derivatives could be used for prescriptive precision agriculture, regenerative/ carbon farming, and high temporal and spatial crop monitoring.
It also indicates the ambition of GeoPard to be integrated with the most advanced technology platforms in the world .”


Earlier GeoPard team announced integration with JohnDeere (the biggest producer of agricultural machinery and equipment) via MyJohnDeere Operation center platform (the biggest by acres digital ag platform in the world), and Planet – a satellite imagery company with the biggest amount of satellites.


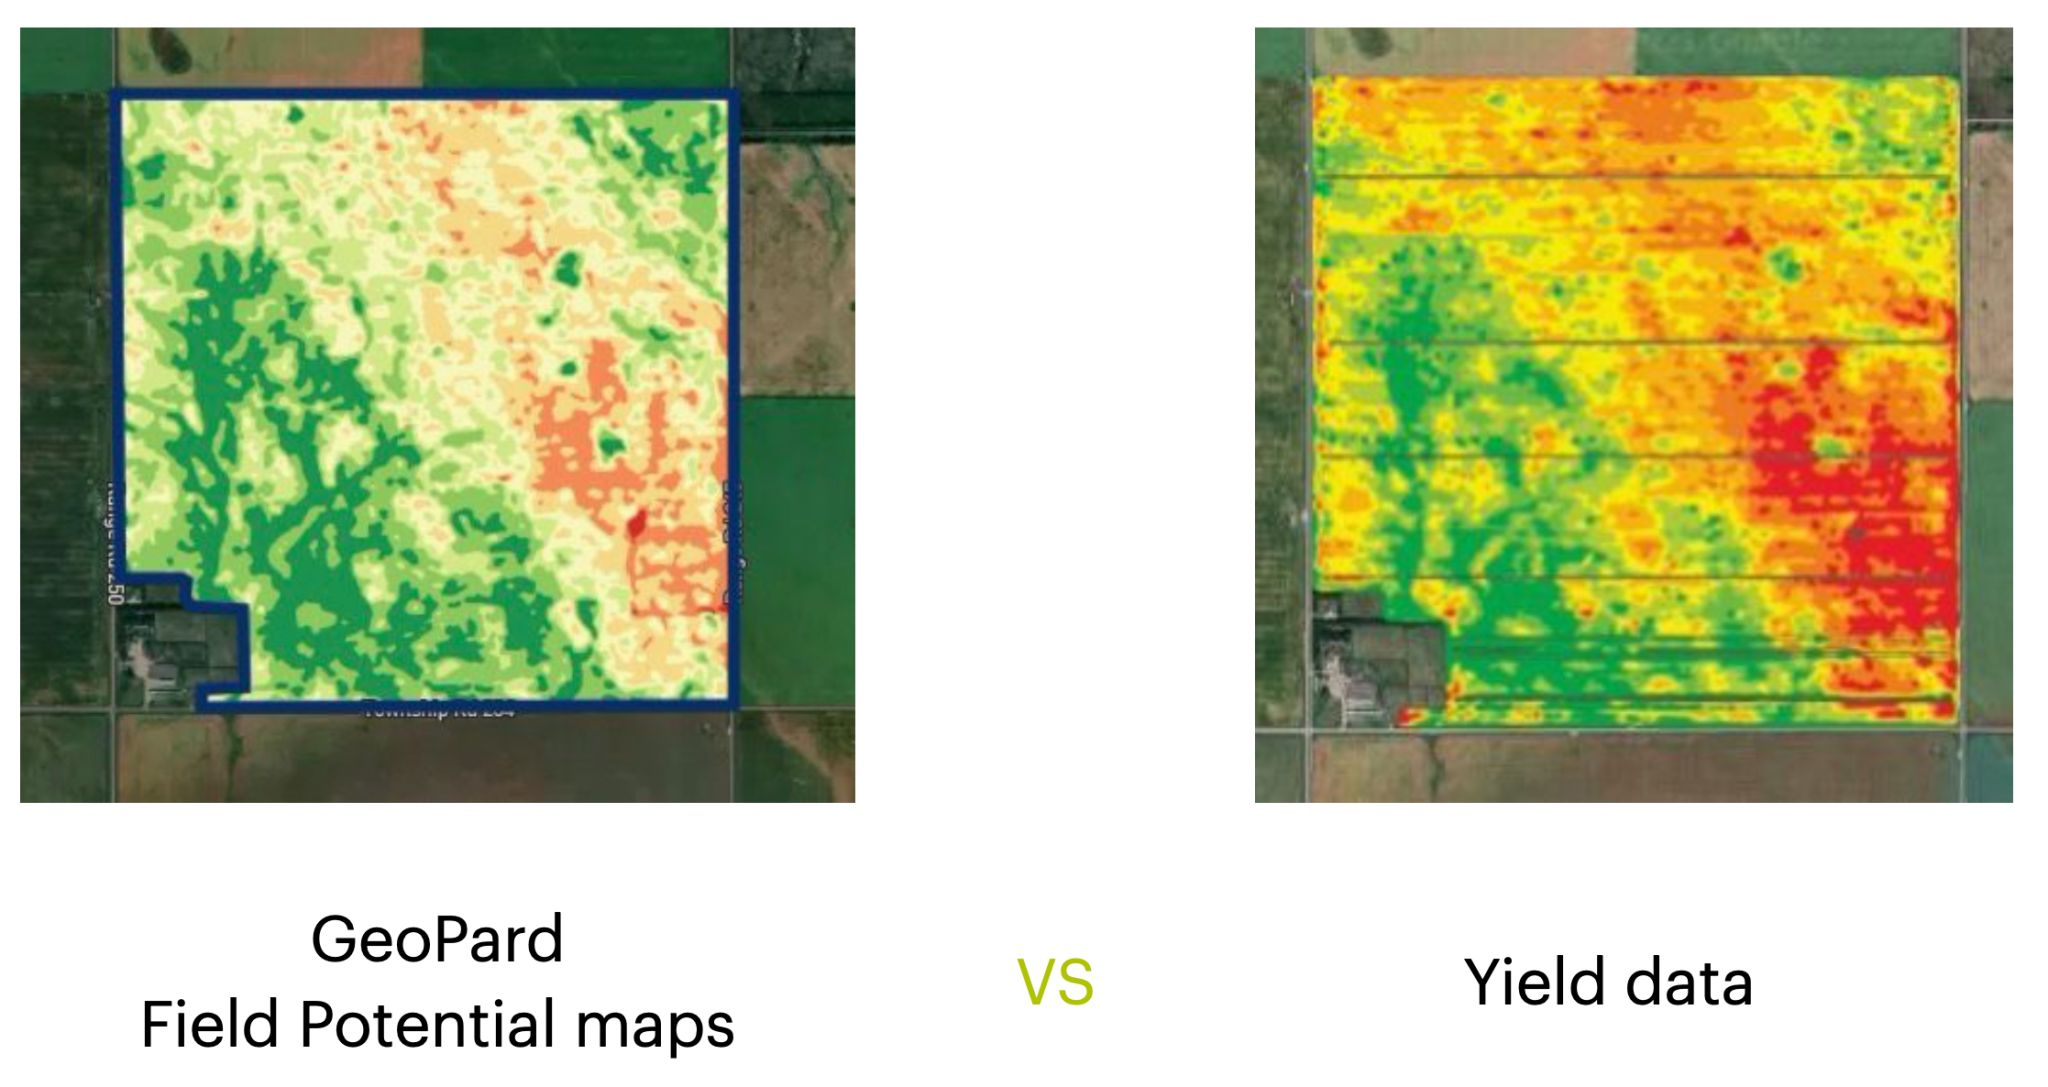
GeoPard Field Potential maps vs Yield data

GeoPard Field Potential maps very often look exactly like yield data.

We create them using multi-layer analytics of historical information, topography, and bare soil analysis.

The process of such synthetic Yield maps is automated (and patented) and it takes about 1 minute for any field in the world to generate it.


GeoPard Field Potential maps vs Yield data

Can be used as the basis for:

What are Field Potential maps?

Field potential maps, also known as yield potential maps or productivity potential maps, are visual representations of the spatial variability in potential crop yield or productivity within a field. These maps are created by analyzing various factors that influence crop growth, such as soil properties, topography, and historical yield data.

These maps can be used in precision agriculture to guide management decisions, such as variable-rate application of fertilizers, irrigation, and other inputs, as well as to identify areas that require specific attention or management practices.

Some key factors that are typically considered when creating field potential maps include:

  1. Soil properties: Soil characteristics such as texture, structure, organic matter content, and nutrient availability play a significant role in determining crop yield potential. By mapping soil properties across a field, farmers can identify areas of high or low productivity potential.
  2. Topography: Factors like elevation, slope, and aspect can influence crop growth and yield potential. For example, low-lying areas may be prone to waterlogging or have a higher risk of frost, while steep slopes may be more susceptible to erosion. Mapping these topographical features can help farmers understand how they affect productivity potential and adjust their management practices accordingly.
  3. Historical yield data: By analyzing historical yield data from previous years or seasons, farmers can identify trends and patterns in productivity across their fields. This information can be used to create these maps that highlight areas of consistently high or low yield potential.
  4. Remote sensing data: Satellite imagery, aerial photography, and other remote sensing data can be used to assess crop health, vigor, and growth stage. This information can be used to create these maps that reflect the spatial variability in crop productivity potential.
  5. Climate data: Climate variables such as temperature, precipitation, and solar radiation can also influence crop growth and yield potential. By incorporating climate data into these maps, farmers can better understand how environmental factors affect productivity potential in their fields.

They are valuable tools in precision agriculture, as they help farmers visualize the spatial variability in productivity potential within their fields. By using these maps to guide management decisions, farmers can optimize the use of resources, improve overall crop yields, and reduce the environmental impact of their agricultural operations.

Difference between Field Potential maps vs Yield data

Field potential maps and yield data are both used in precision agriculture to help farmers understand the spatial variability in their fields and make better-informed management decisions. However, there are some key differences between the two:

Data sources:

These maps are created by integrating data from various sources, such as soil properties, topography, historical yield data, remote sensing data, and climate data. However, this data is collected using yield monitors installed on harvesting equipment, which record the crop yield as it is harvested.

Temporal aspect:

These maps represent an estimation of the potential productivity of a field, which is generally static or changes slowly over time, barring significant changes in soil properties or other influencing factors. However, yield data is specific to a particular growing season or multiple seasons and can vary significantly from year to year based on factors like weather conditions, pest pressure, and management practices.

In summary, field potential maps and yield data are complementary tools in precision agriculture. These maps provide an estimate of the potential productivity of a field, helping farmers identify areas that may require different management practices. Yield data, on the other hand, documents the actual crop output and can be used to assess the effectiveness of management practices and inform future decision-making.

wpChatIcon
wpChatIcon

    Request Free GeoPard Demo / Consultation


    By clicking the button you agree our Privacy Policy. We need it to reply to your request.

      Subscribe


      By clicking the button you agree our Privacy Policy

        Send us information


        By clicking the button you agree our Privacy Policy