Intelligent tomato leaf disease detection sits at the intersection of two powerful forces reshaping global agriculture: the economic weight of the tomato crop itself, and the rapid maturation of computer vision technology. Tomatoes are the world’s most widely grown vegetable crop, with production spanning over 5 million hectares across more than 170 countries.
Losses from leaf diseases alone erode a significant portion of that output every season, and conventional visual inspection by farm workers is too slow, too variable, and too costly to scale. Precision agriculture, powered by AI, offers a better path. This guide covers the full scope of intelligent tomato leaf disease detection, from foundational biology to cutting-edge architectures.
Why Tomato Cultivation and Disease Detection Matter
Tomato (Solanum lycopersicum) is the single most researched vegetable crop in plant pathology, and the economic justification for that focus is clear. Global tomato production reached 186 million metric tonnes in 2024, with China contributing 37% of total output.
The crop feeds food processing industries, fresh markets, and household gardens across every continent. In the United States alone, the 2023 production value of fresh market tomatoes exceeded several billion dollars, according to the Agriculture Marketing Research Center.
Leaf diseases are the primary threat to tomato productivity. The Food and Agriculture Organization (FAO) estimates that plant diseases account for approximately 40% of crop losses globally, translating to enormous food security and economic consequences.
Fungal diseases alone cause annual losses worth $60 billion worldwide. For tomatoes specifically, bacterial spot under favorable disease conditions can reduce yields by up to 90%, making detection and response time critical.

Early and accurate disease identification is the leverage point. A farmer who detects early blight in its initial lesion stage can contain it with targeted fungicide application. A farmer who misses it until visible defoliation occurs faces yield losses that no intervention can fully reverse. This is where artificial intelligence, specifically intelligent tomato leaf disease detection powered by deep learning, changes the equation.
The broader context supports this shift. The global AI in precision agriculture market was valued at $3.1 billion in 2024 and is forecast to reach $12.7 billion by 2034 at a CAGR of 15.1% (Market.us, 2024). Intelligent crop disease monitoring is one of the fastest-growing segments within that expansion.
Tomato Leaf Diseases: An Overview for Detection Work
Before any detection system can work, you need a precise understanding of what it is being asked to find. Tomato leaves are affected by a wide range of pathogens, each leaving distinct but sometimes overlapping visual signatures.
1. Common Tomato Leaf Diseases and Their Causal Agents
Early Blight, caused by the fungus Alternaria solani, produces dark brown concentric ring lesions on older leaves. The rings resemble a target pattern, and yellowing surrounds each lesion as tissue dies.
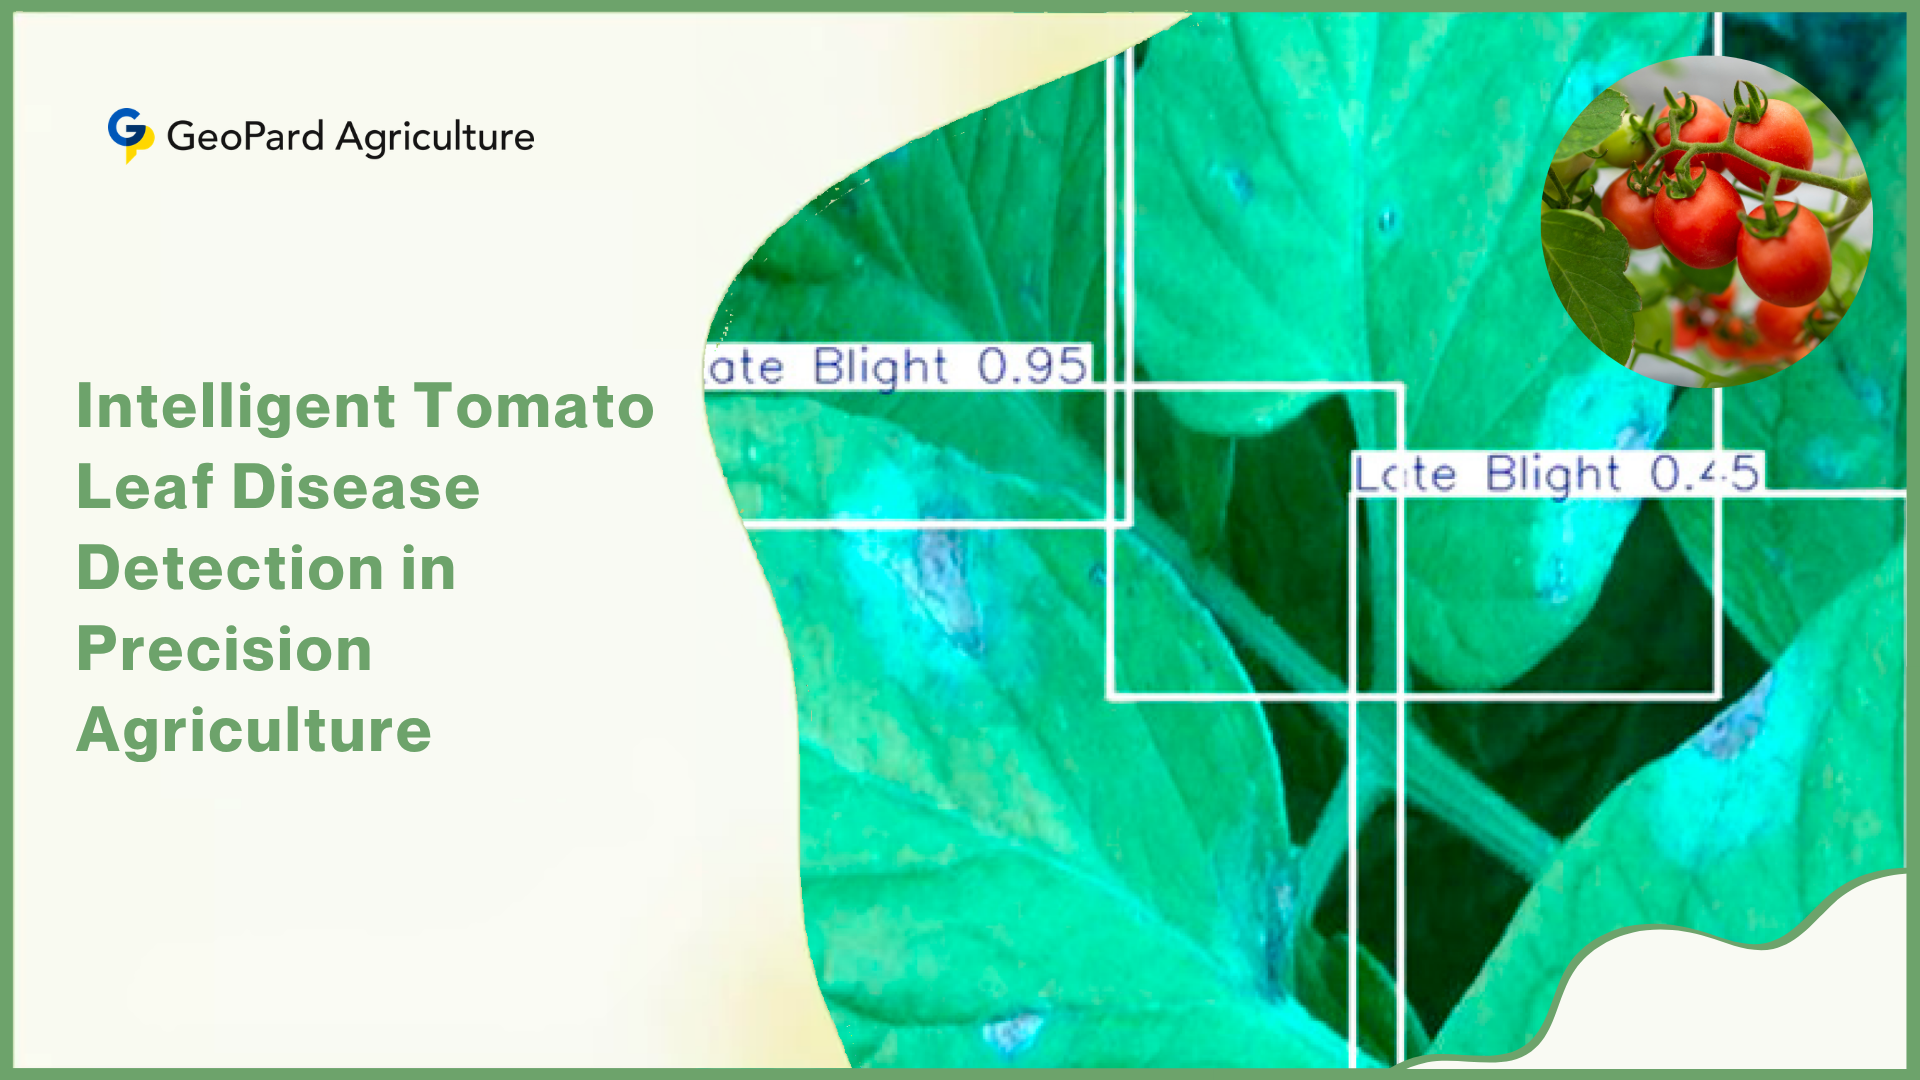
Late Blight, caused by the oomycete Phytophthora infestans — the same organism behind the Irish potato famine — produces water-soaked, grayish-green blotches that rapidly turn brown in warm, humid conditions. It spreads extremely fast and can destroy an entire field in days.
Septoria Leaf Spot presents as small, circular spots with dark brown borders and lighter tan centers. It typically starts on lower leaves and progresses upward, caused by the fungus Septoria lycopersici.
Bacterial Spot, caused by Xanthomonas vesicatoria, produces small, water-soaked spots that become brown and angular, often surrounded by yellow halos. Unlike fungal spots, bacterial lesions do not respond to fungicide treatments.
Leaf Mold, caused by Passalora fulva, appears as pale green or yellow patches on upper leaf surfaces with olive-green to grayish-purple mold growth underneath. It thrives in humid greenhouse environments.
Tomato Mosaic Virus (ToMV) produces mottled light and dark green patterns on leaves, often with leaf curling and blistering. The irregular color distribution distinguishes it from nutrient deficiencies.
Tomato Yellow Leaf Curl Virus (TYLCV), transmitted by the whitefly Bemisia tabaci, causes upward curling of leaf margins, interveinal yellowing, and severe stunting. It is one of the most economically damaging viral diseases in warm tomato-growing regions worldwide.
2. Disease Symptoms and the Core Detection Challenge
The visual identification challenge is significant even for trained agronomists. Early-stage symptoms of different diseases can look nearly identical on a smartphone photo. Septoria leaf spot and bacterial spot both produce small, round lesions. Early blight and late blight both cause brown tissue death. Environmental factors such as nitrogen deficiency, cold stress, and spray phytotoxicity can mimic viral symptoms.
- Lighting conditions at image capture dramatically alter how lesion color and texture appear, with overexposed photos washing out the ring patterns critical for early blight identification.
- Multiple diseases can occur simultaneously on a single leaf, with one pathogen’s symptoms visually overlapping another’s — a scenario that challenges both human experts and AI models.
- Disease progression changes appearance over time, meaning a model trained only on advanced-stage lesions often misses the earliest and most treatable infection stages.
- Background complexity in field images — soil, other leaves, fruit, and irrigation hardware — adds visual noise that degrades classification accuracy in real-world versus lab conditions.
These are not just academic complications. They directly shape how detection datasets must be built, how models must be trained, and how detection systems must be validated before deployment.
Critical Role of Early Disease Detection in Crop Management
Early detection is not simply a matter of acting faster. It is a matter of acting when action is still effective. Fungicides applied at the first sign of early blight lesions prevent sporulation and lateral spread. The same fungicides applied after 30% canopy defoliation have little economic return.
- Crop yield protection is the most direct benefit: fields where disease is caught in the first 10-14 days of symptom onset consistently show significantly smaller yield losses than those where detection is delayed by two or more weeks.
- Pesticide use reduction follows from precision timing. Instead of applying fungicides on a calendar-based schedule, farmers with early detection capability can apply them only when a threshold infection level is confirmed, cutting chemical inputs by up to 40-50%.
- Cost savings accumulate rapidly across a growing season. Fewer spray passes mean less labor, fuel, and chemical expenditure. For a mid-sized tomato operation managing 50+ hectares, these savings are substantial.
- Sustainable agriculture goals are directly supported. Reduced pesticide application lowers runoff into water systems and decreases selection pressure for resistant pathogen strains.
- Disease spread prevention protects not just individual fields but entire farming districts. Late blight, for instance, produces wind-dispersed spores that can infect neighboring farms within hours of sporulation.
The economic and agronomic logic is compelling: invest in early detection technology and the downstream costs of disease management fall sharply.
Sánchez-Sánchez et al. (2024) estimated that viral diseases alone reduce global tomato production value by 2 to 5% annually, a figure that translates to losses in the billions of US dollars given the crop’s worldwide market scale.
Even a modest reduction in disease-related losses through early AI detection can deliver returns on technology investment within a single growing season for large-scale tomato producers.
Precision Agriculture and Smart Disease Monitoring Systems
Precision agriculture is the practice of treating a farm as a mosaic of distinct zones rather than a uniform field. Instead of applying the same seed rate, water volume, or fungicide dose to every square meter, precision systems use real-time data to vary inputs based on actual conditions at each location.
1. Core Concepts of Precision Agriculture
Data-driven farming relies on a continuous loop: sensors and imaging systems collect field data, software processes and interprets that data, and decision support tools translate interpretation into action recommendations. Every link in that chain must be accurate for the system to deliver value.
Smart crop management extends this logic to biological threats. Rather than waiting for disease symptoms to become obvious or relying on weekly scouting walks, a smart monitoring system detects disease at the first visible or spectral sign and triggers an alert that specifies the location, identity, and probable severity of the infection.
2. Disease Monitoring Technologies in Modern Precision Farming
Digital imaging forms the foundational data source for most intelligent disease detection systems. RGB cameras capture the visible color information humans see. Multispectral cameras capture wavelengths beyond visible light, including near-infrared, which reveals chlorophyll stress before it is visible to the naked eye.
Hyperspectral cameras capture hundreds of narrow wavelength bands and can detect biochemical changes at a molecular level, though they remain expensive for most farm deployments.

Ground-based sensors and Internet of Things (IoT) networks complement imaging. Temperature and humidity sensors placed within crop canopies provide the microclimate data that indicates when disease-favorable conditions are developing.
A period of prolonged leaf wetness above 10 hours combined with temperatures between 18-22°C is a known late blight trigger signal — an IoT system can issue a disease risk alert before any lesion appears.
Drones and Unmanned Aerial Vehicles (UAVs) add a spatial dimension to disease monitoring that ground-level imaging cannot provide. A UAV equipped with a multispectral camera can survey a 10-hectare tomato field in under 30 minutes, generating a georeferenced disease risk map that shows exactly which rows and zones show early stress signatures.
This allows targeted treatment of high-risk areas rather than whole-field applications. IoT-enabled farming systems integrate all of these data streams into a unified platform, feeding field-level observations into cloud-based analytics or edge-computing nodes where disease classification algorithms run in near real-time.
Deep Learning for Tomato Leaf Disease Detection
Deep learning is a branch of machine learning in which algorithms learn to extract patterns directly from raw data — in this case, images — through hierarchical layers of mathematical transformations.
The defining advantage over classical machine learning is that deep learning does not require a human expert to manually define what features (shapes, textures, color gradients) to look for in a diseased leaf image. The algorithm learns those features from training examples.
1. Fundamentals of Deep Learning for Image Classification
An Artificial Neural Network (ANN) (a computational system loosely inspired by biological neurons) processes input data through layers of interconnected nodes.
Each connection has a numerical weight that determines how strongly one node’s activation influences the next. Training the network means adjusting those weights using labeled examples until the network’s output predictions match the correct labels with minimal error.
A Convolutional Neural Network (CNN) (a specialized neural network architecture designed for image data) applies mathematical operations called convolutions across an image. A convolution slides a small filter window — typically 3×3 or 5×5 pixels — across the image and computes a weighted sum at each position, producing a feature map that captures local patterns such as edges, textures, and color gradients.
Stacking multiple convolutional layers allows the network to learn progressively more abstract features: edges in early layers, shapes in middle layers, and disease-specific patterns in deeper layers.

This hierarchical feature learning is exactly what makes CNNs powerful for tomato disease detection. A lesion’s circular border, its internal texture gradient, the yellowing halo surrounding it — all of these become learnable feature combinations across the network’s layers.
2. Why Deep Learning Outperforms Traditional Methods
Traditional machine learning for plant disease detection required domain experts to manually engineer features: extracting color histograms, computing texture descriptors, or measuring shape parameters from leaf images, then feeding those numbers into classifiers like Support Vector Machines (SVMs). This pipeline was labor-intensive, expertise-dependent, and fragile when disease appearance varied from the training conditions.
- Deep learning performs automatic feature extraction, learning directly from pixel data without manual feature engineering — eliminating the bottleneck of expert-defined descriptors.
- Classification accuracy with deep learning routinely exceeds 95% and often reaches 99%+ on benchmark datasets, compared to 80-88% accuracy for traditional SVM-based approaches on the same data.
- Deep learning models scale effectively to large datasets. As more labeled disease images are added, model performance improves, whereas traditional methods plateau when feature sets are fixed.
Lobna et al. (2024) trained a Capsule Neural Network on a large-scale dataset of 70,834 tomato leaf images and achieved a classification accuracy of 96.39% across multiple disease categories, outperforming standard CNN baselines on the same data.
Large, diverse datasets combined with optimized architectures consistently deliver accuracy levels that exceed what is achievable with traditional computer vision pipelines.
Use of Geopard Agriculture in Disease Detection for Real Fields
Geopard Agriculture builds exactly that layer. Its precision scouting platform connects field observation, disease identification, and decision support into a single workflow that any agronomist or grower can operate from a smartphone.
What Geopard Offers for Tomato Disease Management
Geopard’s smart scouting system identifies the highest-value areas of your field for targeted inspection, rather than requiring uniform coverage of every row. It automatically flags anomalies in crop emergence and directs scouting effort to zones where disease pressure or stress is most likely to be developing.
This directly addresses the field coverage problem that limits manual scouting programs on large holdings. The platform supports detection and logging of all major in-field threat categories relevant to tomato production:
- Fungal disease recognition covering early blight, late blight, septoria leaf spot, and leaf mold — the diseases where timing of detection most directly determines whether intervention succeeds.
- Bacterial and viral disease identification, including bacterial spot and mosaic virus symptoms, with photo documentation tied to GPS coordinates for precise field mapping.
- Irrigation and fertilization issue detection, allowing scouting teams to flag abiotic stress symptoms that can mimic or compound disease symptoms in tomato canopies.
- Weed and insect identification alongside disease scouting, so a single field walk generates a complete threat picture rather than siloed reports from separate programs.
- Leaf damage and tissue sampling support, enabling integration of physical laboratory sampling into the digital scouting workflow.
Zone planning is built into the scouting preparation stage. Geopard converts raw field sensor and satellite data into continuous gradient surface maps that visualize field heterogeneity, allowing agronomists to define management zones before scouting begins. Offline zone maps and soil data are accessible without connectivity, which matters on farms where cellular coverage is inconsistent.
Mobile Execution, Reporting, and Emergency Alerts
All field observations are captured through the Geopard mobile app. Scouts record notes, photographs, and georeferenced observations in real time, and completed scouting records feed directly into the platform’s reporting dashboard.

Field managers can see which threats were identified, where they were found, what actions were taken, and which zones remain under surveillance — without consolidating data from paper forms or separate apps.
The emergency alert system monitors disease spread patterns across the platform’s network and sends notifications when disease pressure is building in your area. This early warning function extends the effective detection window beyond what any single farm’s internal scouting can achieve, giving growers lead time to prepare preventive responses before disease reaches their fields.
Geopard’s approach demonstrates the practical integration pathway that precision agriculture researchers describe in theory: satellite and sensor data informing scouting prioritization, mobile tools enabling real-time observation capture, and AI-assisted threat identification supporting faster and more targeted decision-making at the farm level.
Dataset Preparation For Foundation of Detection Model
A deep learning model is only as reliable as the data it was trained on. Dataset preparation for tomato leaf disease detection is a multi-stage process that determines the ceiling on any model’s real-world performance.
1. Image Acquisition Sources
Field images captured under real agricultural conditions — with variable lighting, partial occlusion, water droplets, and soil background — represent the gold standard for dataset diversity, even though they are harder and more expensive to collect than controlled-environment images.
Smartphone images captured by farmers during routine scouting increasingly form a practical data source that bridges the gap between lab conditions and real deployment scenarios.
Public datasets have accelerated research significantly. The PlantVillage dataset, developed by Penn State University, contains over 54,000 images of healthy and diseased plant leaves across 26 species, including 10 tomato disease categories.
It has served as the training foundation for hundreds of published tomato disease detection models and remains the most widely used benchmark dataset in the field.
2. Data Preprocessing Steps
Raw images collected from diverse sources contain noise, inconsistent sizes, and color calibration differences that can introduce spurious patterns into model training. Preprocessing standardizes the data before it reaches the model.
- Image resizing scales all images to a consistent resolution — typically 224×224 or 256×256 pixels for CNN architectures — ensuring that spatial operations within the network apply uniformly across all training examples.
- Noise removal applies smoothing filters, such as Gaussian blur, to reduce sensor noise and JPEG compression artifacts that can mislead texture-sensitive convolutional layers.
- Data augmentation artificially expands the training set by applying random horizontal flips, rotations, color jitter, brightness adjustments, and random cropping to existing images. This teaches the model to recognize disease patterns regardless of leaf orientation, lighting angle, or image composition.
- Normalization rescales pixel values from their original 0-255 range to a smaller range, typically 0-1 or zero-mean, unit-variance. This makes gradient-based training more numerically stable and faster to converge.
3. Dataset Annotation and Labeling
Every image in a supervised learning dataset must carry a ground-truth label: which disease category it belongs to, or whether the leaf is healthy. This labeling must be performed or validated by plant pathologists, not just agricultural generalists, because the visual overlap between diseases makes amateur annotation unreliable.
Class-level annotation for disease classification is relatively straightforward, but bounding-box annotation for object detection models — marking exactly where the lesion appears in the image — requires significantly more time and expertise per image.
Deep Learning Architectures Used for Tomato Disease Detection
The research community has evaluated dozens of architectures for tomato leaf disease classification. Understanding which architectures dominate and why helps practitioners make informed decisions when deploying these systems.
1. Standard Convolutional Neural Networks
Basic CNN models for disease classification follow a standard pattern: convolutional layers for feature extraction, pooling layers that reduce spatial dimensions while retaining dominant features, and fully connected layers at the end that map extracted features to disease class probabilities.
Early work on the PlantVillage dataset demonstrated that even modest CNNs with 5-7 layers could achieve over 90% accuracy on clean, lab-acquired images.
2. Transfer Learning with Pre-Trained Architectures
Transfer learning (the practice of starting with a model pre-trained on a large general dataset and fine-tuning it on a domain-specific dataset) transformed tomato disease detection research by allowing high-accuracy models to be trained with relatively small agricultural datasets.
1. VGG16 and VGG19, developed by the Visual Geometry Group at Oxford, use 16 or 19 weight layers with uniform 3×3 convolutions. They remain reliable baselines for tomato disease classification, typically achieving 94-97% accuracy after fine-tuning on disease datasets.
2. ResNet (Residual Network) introduced skip connections that allow gradients to flow directly across layers, solving the vanishing gradient problem that previously limited training depth. ResNet50 fine-tuned on tomato disease data consistently reaches 96-98% accuracy in recent studies.
3. DenseNet extends the skip connection concept by connecting each layer to every subsequent layer in a dense block, maximizing feature reuse and producing compact models with strong classification performance.
4. EfficientNet, developed by Google Brain, scales network width, depth, and resolution simultaneously using a compound coefficient. EfficientNetB0 with an attention module achieved 99.39% accuracy on plant disease classification in research published by González-Briones et al. (2025), with performance appropriate for edge device deployment.
5. MobileNet, designed explicitly for resource-constrained devices, uses depthwise separable convolutions to dramatically reduce computation while maintaining strong accuracy — making it the preferred architecture for smartphone and edge AI deployment in precision agriculture.
3. Hybrid and Advanced Models
The most recent research has moved beyond standard CNNs toward architectures that can capture longer-range spatial relationships in leaf images.
Vision Transformers (ViT) (neural networks that apply the Transformer attention mechanism, originally developed for natural language processing, to image patches) have shown strong results in plant disease detection when sufficient training data is available.
Unlike CNNs, which process local image regions through convolutions, ViTs learn relationships between all image patches simultaneously, allowing them to detect spatially distributed patterns across an entire leaf.

Attention-based CNN hybrids combine the local feature extraction strength of convolutions with attention mechanisms that allow the model to focus processing resources on the most disease-relevant image regions.
A siamese network-based lightweight framework for tomato disease detection achieved 96.97% accuracy on the Plant Village tomato subset with only approximately 2.96 million parameters (Frontiers in Plant Science, 2025), demonstrating that high accuracy and hardware efficiency are not mutually exclusive goals.
Ensemble learning models combine predictions from multiple independently trained architectures, averaging or voting across them to produce a final prediction that is more robust than any single model alone. Wu et al. (2024) applied ResNet50 with feature augmentation techniques to achieve improved classification performance through this approach.
Abdullah et al. (Agronomy, 2024) compared YOLOv8s, YOLOv5, and Faster R-CNN for detecting diseased tomato leaves and found that YOLOv8s achieved a mean average precision (mAP) of 92.5%, outperforming YOLOv5 at 89.1% and Faster R-CNN at 77.5%, while also demonstrating faster inference speed and a smaller model footprint.
For real-time detection applications in the field, YOLOv8-class models offer the best balance of accuracy and processing speed, making them well-suited for drone-mounted or edge-device deployment.
Intelligent Disease Detection Framework
A deployable intelligent disease detection system is more than a trained model. It is an end-to-end pipeline that moves from raw image capture to actionable disease management recommendations.
1. System Architecture
The core pipeline consists of five sequential stages, each transforming the data before passing it to the next.
1. Image input accepts raw leaf images from any capture source — a field smartphone, a mounted camera on a UAV, or a fixed canopy camera in a greenhouse. Input handling modules validate image resolution and flag blurry or unusable captures before they enter the processing pipeline.
2. The preprocessing stage applies the normalization, resizing, and quality enhancement steps described in Section 6.2, ensuring the input conforms to the format expected by the trained model.
3. Feature extraction runs the preprocessed image through the convolutional layers of the trained deep learning model. At this stage, the model transforms raw pixel data into a compact numerical representation (a feature vector) that encodes the disease-relevant visual characteristics of the leaf.
4. Disease classification applies the fully connected layers and softmax output function to the feature vector, computing a probability score for each disease category. The category with the highest probability becomes the predicted diagnosis.
5. Decision support output translates the classification result into a practical recommendation: the identified disease name, confidence level, suggested management action (targeted fungicide, biocontrol agent, removal of affected plants), and georeferenced location data if the image was captured by a GPS-equipped device.
2. Workflow of a Complete Detection System in Practice
In a real deployment, a farmer opens a mobile application and photographs an affected leaf. The image is either sent to a cloud server running the detection model or processed locally on the device by a compressed edge model.
Within seconds, the app returns a diagnosis: “Early Blight — 94% confidence. Recommended action: Apply mancozeb-based fungicide at 1.5 kg/ha to affected zone.
Monitor neighboring plants for the next 5 days.” The georeferenced result is logged to the farm’s digital health map, and if the same disease appears in multiple zones, the system flags an elevated risk alert for the entire field block.
Demilie (2024), reviewing 161 publications on deep learning-based plant disease detection, found that tomato was the most researched crop across all studies, accounting for 39% of all publications — more than twice the coverage of the second most studied crop (rice at 16%), confirming the crop’s unique intersection of economic importance and disease vulnerability.
The maturity of tomato disease detection research means practitioners can access a wide range of validated architectures and pre-trained models rather than building from scratch.
Performance Evaluation Metrics
Choosing the right evaluation metric matters as much as choosing the right architecture, particularly for disease detection where false negatives (missing a real disease) carry different costs than false positives (misidentifying a healthy leaf as diseased).
Accuracy measures the proportion of all predictions that are correct. It is the most commonly reported metric but can be misleading when disease classes are imbalanced — a model that always predicts “healthy” in a dataset with 90% healthy images achieves 90% accuracy while being completely useless for disease detection.
Precision measures what fraction of disease detections are genuine positive cases, capturing the rate of false alarms. High precision means the model rarely triggers unnecessary treatment recommendations.
Recall (Sensitivity) measures what fraction of actual diseased plants are correctly flagged. High recall means the model rarely misses real infections — the more critical metric for disease management.
F1-Score is the harmonic mean of precision and recall, providing a single balanced measure that punishes models that sacrifice one for the other. It is the preferred metric when both false positives and false negatives carry meaningful costs.
Specificity measures how accurately the model identifies truly healthy leaves as healthy, which matters for preventing unnecessary pesticide applications on disease-free crops.
The Confusion Matrix shows the full breakdown of predictions across all classes, revealing which disease pairs are most frequently confused — critical information for refining training data or model architecture.
The ROC-AUC (Receiver Operating Characteristic — Area Under the Curve) measures overall model discriminability across all classification thresholds, with a value of 1.0 representing perfect discrimination and 0.5 representing chance-level performance.
Real-Time Tomato Disease Detection: Deployment
Moving a high-accuracy model from a research notebook to a working farm system requires solving a different set of problems than model training. Deployment environments have hardware constraints, connectivity limitations, and latency requirements that shape the choice of architecture and infrastructure.
1. Smartphone-Based Applications for Mobile Disease Diagnosis
Smartphone applications represent the most accessible deployment pathway for smallholder and mid-scale farmers. Apps built on MobileNet or EfficientNet-Lite models run inference entirely on-device, requiring no internet connection at the moment of capture.
The highest-accuracy model is worthless in precision agriculture unless it can run on the device that is already in the farmer’s pocket.
This matters enormously for farms in rural or low-connectivity regions. The farmer photographs a suspicious leaf, receives a disease prediction in 1-3 seconds, and logs the result to a database that aggregates farm-wide health data over the growing season.
2. Edge AI Deployment: On-Device Inference
Edge AI (running AI inference directly on hardware located at the data collection point rather than sending data to a remote server) solves the latency and connectivity problems of cloud-based detection. Dedicated edge devices like the NVIDIA Jetson series or Google’s Coral TPU accelerators can run compressed CNN models at 30+ frames per second, enabling continuous real-time leaf monitoring from fixed cameras mounted on greenhouse rails or field irrigation structures.
Model compression techniques — quantization (reducing the numerical precision of model weights), pruning (removing low-importance network connections), and knowledge distillation (training a small model to mimic a large one) — make this possible without sacrificing acceptable accuracy.
3. Drone-Based Monitoring Systems for Large-Scale Farm Surveillance
For farms exceeding 20-30 hectares, ground-level inspection cannot provide the spatial coverage needed to catch disease outbreaks before they spread. UAV systems equipped with multispectral cameras capture disease stress signatures at the whole-field level.
The captured images are fed to an onboard edge processor or transmitted to a ground station, where the detection model identifies infected zones and generates a georeferenced map overlaid on the farm’s digital plot records.
This shifts disease management from reactive (responding after symptoms become obvious) to spatially proactive (responding to specific field coordinates where early stress is detected).
Challenges in Deep Learning-Based Disease Detection
The field has made remarkable progress, but honest assessment of remaining challenges prevents overconfidence in deployment decisions.
Limited field datasets remain the most pervasive problem. Most high-accuracy models are trained and evaluated on PlantVillage, which uses controlled-lighting, single-leaf images against clean backgrounds. Real field performance drops significantly when the same models face complex, multi-element images taken under variable lighting conditions.
Variations in lighting conditions — direct sunlight causing specular reflections on leaf surfaces, overcast diffuse light flattening texture cues, or shadowing from crop canopy — alter the apparent color and texture of lesions in ways that can degrade classification by 5-15 percentage points compared to controlled conditions.
Background complexity in field images introduces irrelevant visual information. Soil, mulch, irrigation drip lines, fruit, and other leaves can all appear in the same image frame as a diseased leaf, and models not specifically trained on complex backgrounds often confuse background elements with disease features.
Multiple diseases on a single leaf present a classification challenge that most single-label models are not designed to handle. A leaf simultaneously expressing bacterial spot and early blight requires multi-label classification capability, which adds training complexity and dataset annotation requirements.
Class imbalance in training datasets — far more images of common diseases like early blight than rare ones like mosaic virus — causes models to be over-confident about frequent classes and unreliable for less-represented ones.
Model interpretability is a significant barrier to farm-level trust. When a model classifies a leaf as diseased with 97% confidence, most farmers and agronomists want to understand which visual features drove that decision before acting on the recommendation.
Recent Advances in Intelligent Disease Detection
The research frontier is moving on multiple tracks simultaneously, addressing different parts of the challenge outlined above.
1. Explainable AI (XAI) tools — particularly Grad-CAM (Gradient-weighted Class Activation Mapping), which produces heatmap overlays showing which regions of a leaf image the model focused on when making a decision — directly address the interpretability problem.
A Grad-CAM visualization showing the model’s attention concentrated on a dark lesion ring provides a form of justification that agronomists can evaluate and trust.
2. Vision Transformers (ViT) continue to gain traction for tomato disease detection as pre-training strategies improve and the data requirements for ViT fine-tuning decrease.
Their ability to capture global leaf-level patterns rather than purely local features makes them particularly promising for detecting viral diseases that affect the entire leaf surface distribution rather than producing localized lesions.
3. Federated Learning addresses the field dataset problem by allowing models to be trained collaboratively across multiple farms without centralizing sensitive data.
Each farm trains a local model on its own images, and only the model parameter updates (not the images themselves) are shared to improve a central global model. This preserves farmer data privacy while dramatically expanding the diversity of training data.
Precision disease management will not be defined by the accuracy of a single model — it will be defined by the intelligence of the system that connects detection, decision, and action.
4. Self-Supervised Learning pre-trains models on large collections of unlabeled plant images to learn general visual representations, then fine-tunes on small labeled disease datasets. This reduces the annotation burden and allows high-quality models to be developed for disease categories where labeled examples are scarce.
5. Multimodal Disease Detection integrates leaf image data with spectral sensor readings, weather station data, and historical disease records into a unified model input. Combining visual and environmental data can push detection performance beyond what image data alone supports, particularly for diseases whose visual symptoms are preceded by biochemical changes detectable in spectral signatures.
Future Research Directions: What the Field Still Needs
The translation from high-accuracy research models to consistently reliable farm-level deployment requires focused work on several fronts.
Real-world deployment validation across diverse geographies and farming systems — not just PlantVillage benchmarks — is needed to honestly characterize the performance gap between controlled-condition and field-condition detection.
Robust field-level detection will require purpose-built field datasets, collected across multiple growing seasons, in multiple countries, with systematic documentation of weather conditions at image capture time.
Integration with IoT and smart farming infrastructure — connecting disease detection alerts directly to automated irrigation and fertigation systems, drone spray platforms, and farm management software — will close the loop between detection and action.
Predictive disease forecasting, combining current disease detection data with weather forecasting models and historical disease spread patterns, will shift the paradigm from reactive detection to anticipatory management: recommending preventive actions before symptoms appear.
Autonomous agricultural systems — UAV fleets that conduct continuous field surveillance, flag disease zones, and coordinate with automated sprayer units without human intervention — represent the horizon toward which current precision agriculture technology is building.
Conclusion
Intelligent tomato leaf disease detection using deep learning is not an experimental technology anymore. It is a mature, well-validated application with a growing body of peer-reviewed evidence confirming its ability to identify tomato diseases accurately, quickly, and at a cost accessible to working farmers. From basic CNN models trained on the PlantVillage dataset to attention-powered hybrid architectures achieving 99%+ accuracy, the technical capability now exceeds the deployment infrastructure available to most farming operations.
The path forward is clear. Precision agriculture systems that integrate image-based disease detection with IoT sensor networks, UAV surveillance, and predictive weather models will define competitive tomato production within this decade. The AI in precision agriculture market growing at a CAGR of 15.1% toward $12.7 billion by 2034 signals that this investment is already underway at scale.