Жүгері егістігіне тыңайтқыштың сіңуін құрғақ өнімнің мөлшеріне қарай қалай есептеуге болады?

Fertilizer management is a crucial aspect of successful corn production. Properly calculating fertilizer uptake based on yield dry value ensures that crops receive the necessary nutrients to maximize yield while minimizing costs and environmental impacts.

What is Fertilizer Uptake?

Fertilizer uptake involves the absorption of nutrients by plant roots from the soil. These nutrients include macronutrients such as nitrogen (N), phosphorus (P), and potassium (K), as well as micronutrients like zinc, iron, and manganese.

Meanwhile, the efficiency of this process depends on several factors, including soil health, fertilizer type, application methods, and environmental conditions. Corn, being a high-demand crop, requires substantial amounts of nutrients to achieve its full yield potential. Efficient fertilizer uptake ensures that the corn plant receives adequate nutrition throughout its growth stages, from germination to maturity.

However, it’s important to note that excessive or improper use of fertilizers can have detrimental effects on both the crop and the environment. Over-fertilization can lead to nutrient leaching into water bodies, causing pollution and eutrophication. It can also result in nutrient imbalances in the soil, negatively impacting soil health and future crop cycles.

Why It’s So Important?

Adequate nutrient uptake promotes vigorous plant growth by ensuring that nitrogen supports leaf and stalk development, phosphorus aids in root growth and energy transfer, and potassium strengthens the plant’s resistance to disease and stress.

What is Fertilizer Uptake

Furthermore, efficient nutrient absorption directly correlates with higher yields, enabling the corn plant to produce more kernels per cob and more cobs per plant. This is particularly important for corn that is used for human consumption, as it directly affects the food’s caloric and nutritional content. Studies have shown that optimized fertilizer use can increase corn yields by 20-30%.

Moreover, nutrient availability also affects the overall quality of the corn crop. Sufficient potassium levels enhance the size and weight of the kernels, while adequate nitrogen contributes to protein content, which is vital for both animal feed and human consumption. Corn plants with access to balanced nutrients can photosynthesize more effectively, leading to better growth and higher biomass production.

What Is Corn Yield and Dry Matter Content?

Corn, a staple crop in many parts of the world, is essential for food, feed, and industrial products. Two critical aspects of corn production are yield and dry matter content. These metrics are vital for evaluating crop performance and determining the economic value of the harvest.

1. Corn Yield

Corn yield refers to the amount of harvested crop produced per unit of land area. It is a crucial metric for farmers, agronomists, and the agricultural sector as it directly correlates with the efficiency and profitability of corn production.

The typical measurement unit for corn yield in the United States is bushels per acre (bu/acre). One bushel of corn is equivalent to 56 pounds (approximately 25.4 kilograms) of shelled corn at standard moisture content (15.5%).

What Is Corn Yield and Dry Matter Content

The process of estimating corn yield is methodical and involves several components, including the number of plants per acre, ears per plant, rows per ear, kernels per row, and kernel weight. These components are measured during the growing season using the Yield Component Method, which provides a systematic approach to predict the potential harvest.

2. Dry Matter

Dry matter content in corn refers to the portion of the corn that remains after all the water content has been removed. It is a vital indicator of the quality and nutritional value of the corn, especially when used for silage. The dry matter content is significant because it affects the storage, processing, and feeding value of the corn.

For instance, research has shown that an increase in total tract starch digestibility occurs when corn silage is between 32 and 40 percent dry matter, compared to unprocessed corn silage.

The dry matter content also plays a pivotal role in the overall growth and development of the corn plant. It is involved in nutrient accumulation and partitioning, which are essential for the plant’s productivity. Understanding the dynamics of dry matter accumulation can help farmers and agronomists make informed decisions about irrigation, fertilization, and harvesting times.

How To Calculate Fertilizer Uptake For Corn Field? Step by Step Guide

Corn, one of the most widely cultivated crops, is a staple in the global food supply. To achieve optimal yields, understanding the precise fertilizer requirements based on the yield’s dry value is crucial.

By determining the nutrient requirements, farmers can apply the right amount of fertilizers. However, calculating fertilizer uptake for a corn field based on yield dry value involves understanding the nutrient removal rates by the crop.

Here is a step-by-step guide to calculating fertilizer uptake for corn fields based on yield dry value.

Step 1: Determine the Corn Yield

First, you need to know the corn yield. This is typically measured in bushels per acre (bu/acre). For dry corn, the yield is often adjusted to a standard moisture content of 15.5%.

Step 2: Convert Yield to Dry Matter

Corn grain is typically considered to be 85% dry matter. If you have the yield in bushels per acre, you can convert it to pounds of dry matter per acre.

  • Dry Matter (lb/acre) = Yield (bu/acre) × 56 lb/bu × 0.85

Step 3: Nutrient Removal Rates

Corn plants require essential nutrients like nitrogen (N), phosphorus (P), and potassium (K) for growth. The nutrient removal rates per unit of dry yield can be found in agronomic guidelines or research publications. Typical values are:

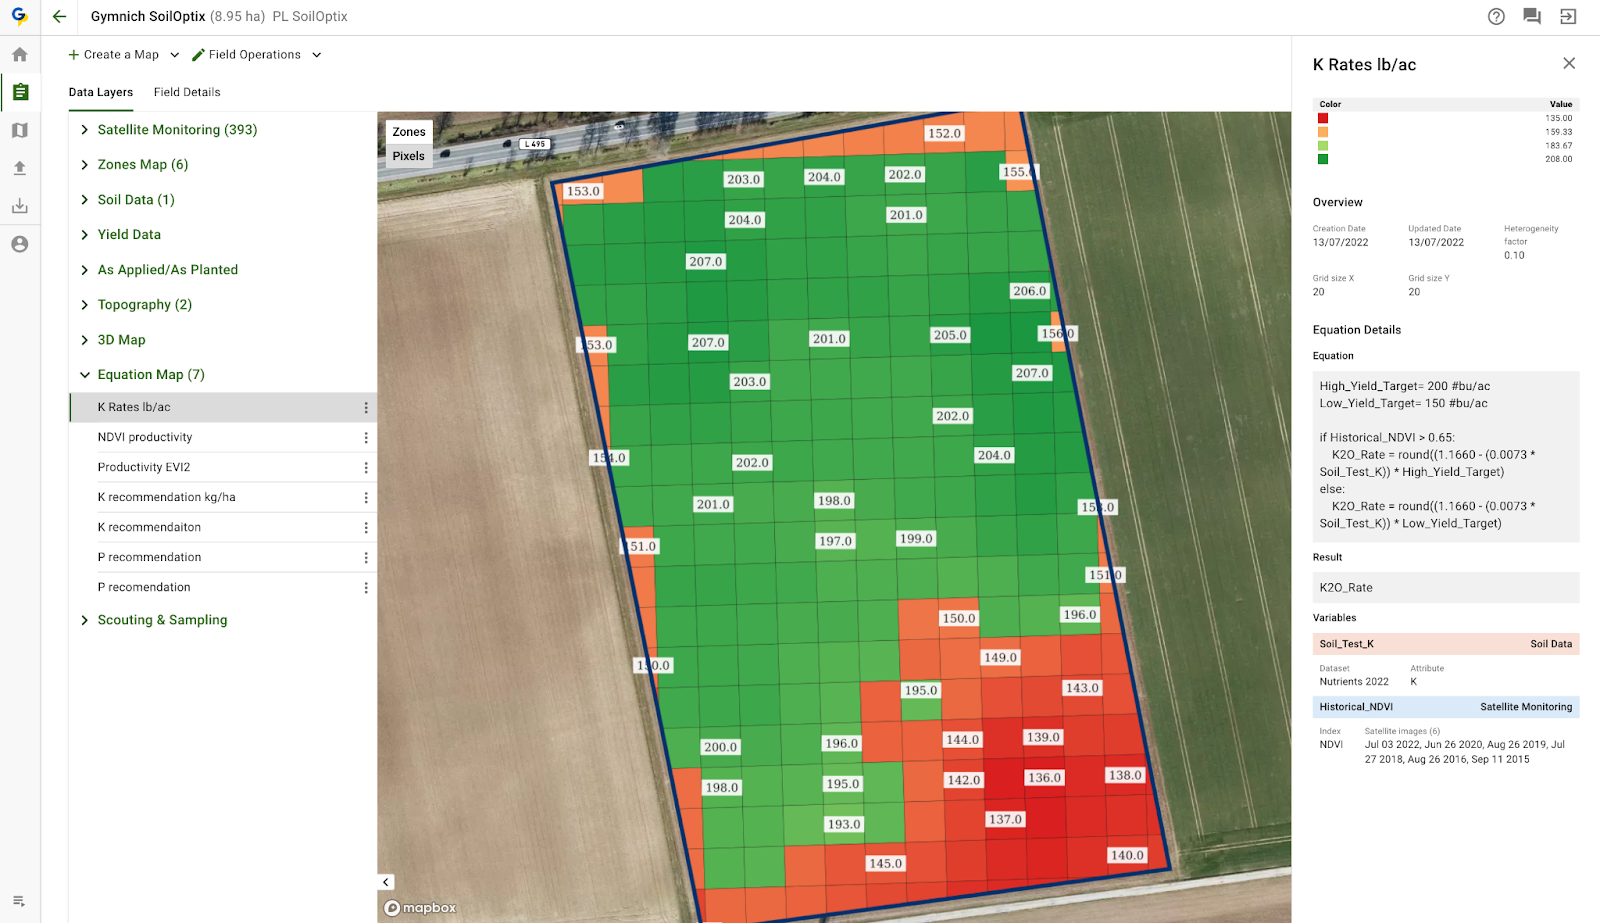
  • Nitrogen (N): 1.2 lbs per bushel
  • Phosphorus (P2O5): 0.44 lbs per bushel
  • Potassium (K2O): 0.29 lbs per bushel

guide to calculating fertilizer uptake for corn fields based on yield dry value

Step 4: Calculate Total Nutrient Uptake

Using the yield and the nutrient removal rates, calculate the total nutrient uptake for each nutrient.

  • Total Nitrogen Uptake (lb/acre) = Yield (bu/acre) × 1.2
  • Total Phosphorus Uptake (lb/acre) = Yield (bu/acre) × 0.44
  • Total Potassium Uptake (lb/acre) = Yield (bu/acre) × 0.29

Step 5: Determine Fertilizer Requirement

Depending on the efficiency of your fertilizer application and the nutrient availability in your soil, you might need to adjust these values. Soil tests can help determine the existing nutrient levels and the appropriate fertilizer amounts.

If you assume 100% efficiency (which is rarely the case), the fertilizer requirement would be equal to the nutrient uptake. However, due to losses and other factors, you typically apply more than the calculated uptake.

Example Calculation

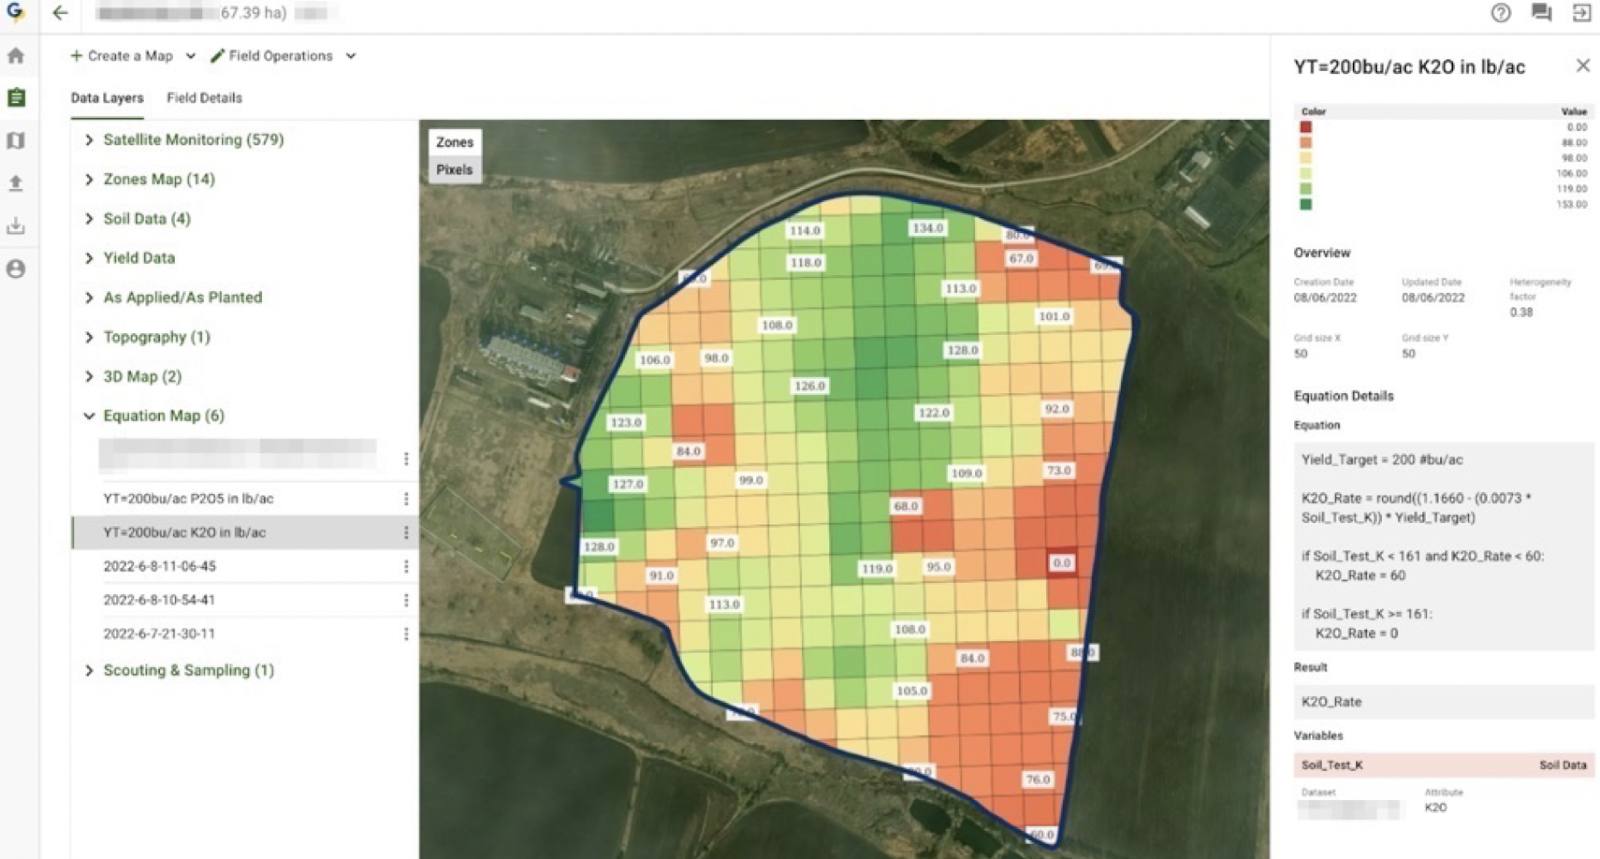
Let’s assume a corn yield of 200 bu/acre:

Convert Yield to Dry Matter (optional for nutrient calculations):

  • 200 bu/acre × 56 lb/bu × 0.85 = 9520 lb /acre of dry matter

Calculate Nutrient Uptake:

  • Азот: 200bu/acre × 1.2 = 240 lb N/acre
  • Фосфор: 200bu/acre × 0.44 = 88 lb P2O5/acre
  • Калий: 200bu/acre × 0.29 = 58 lb K2O/acre

How Adjusting Fertilizer Application Improve Yield?

Based on the calculated nutrient uptake and crop response, farmers can adjust their fertilizer application rates to meet the specific needs of their crops. However, several critical factors must be considered in this process:

1. Soil Nutrient Levels

Conducting regular soil tests is essential for determining existing nutrient levels and soil health. Soil tests provide a snapshot of nutrient availability, which can inform fertilizer application rates. For instance, if soil tests reveal high phosphorus levels, farmers can reduce or eliminate phosphorus fertilizers, focusing on other nutrients the soil lacks. Key steps include:

  • Baseline Testing: Establish a baseline by conducting soil tests before planting. This helps determine the initial nutrient levels and identifies any deficiencies that need to be addressed.
  • Seasonal Testing: Perform soil tests at various stages of the growing season to monitor changes in nutrient levels and adjust fertilizer applications accordingly.

Soil Nutrient Levels Conducting regular soil tests is essential

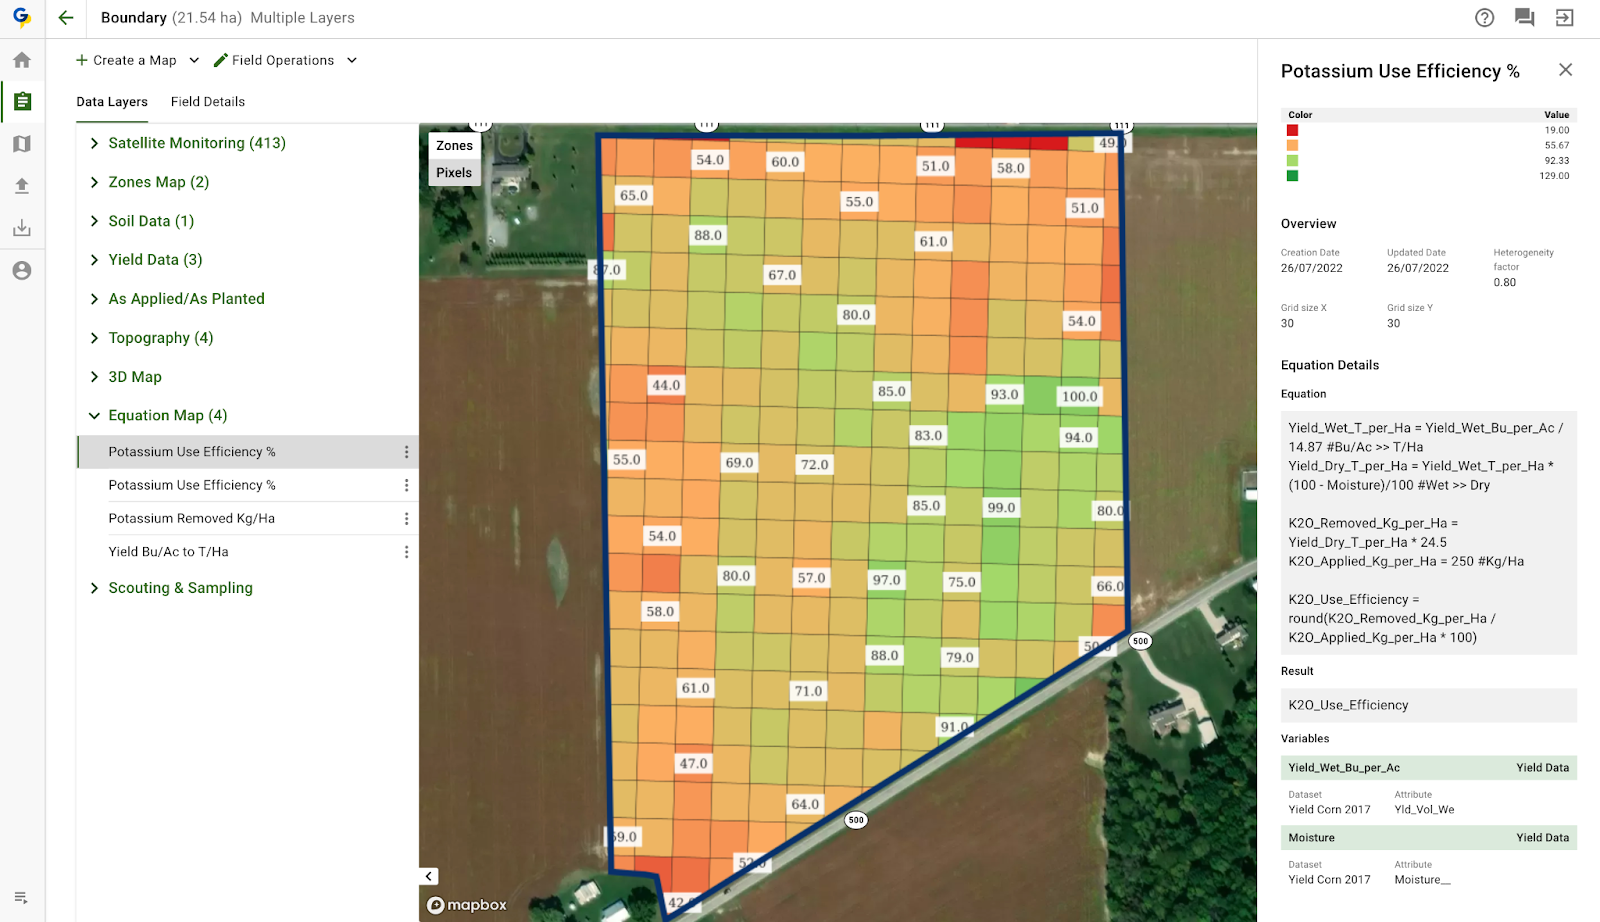
2. Fertilizer Efficiency

Not all applied fertilizer is utilized by crops; some may be lost to the environment through processes like leaching, runoff, or volatilization. To enhance fertilizer efficiency:

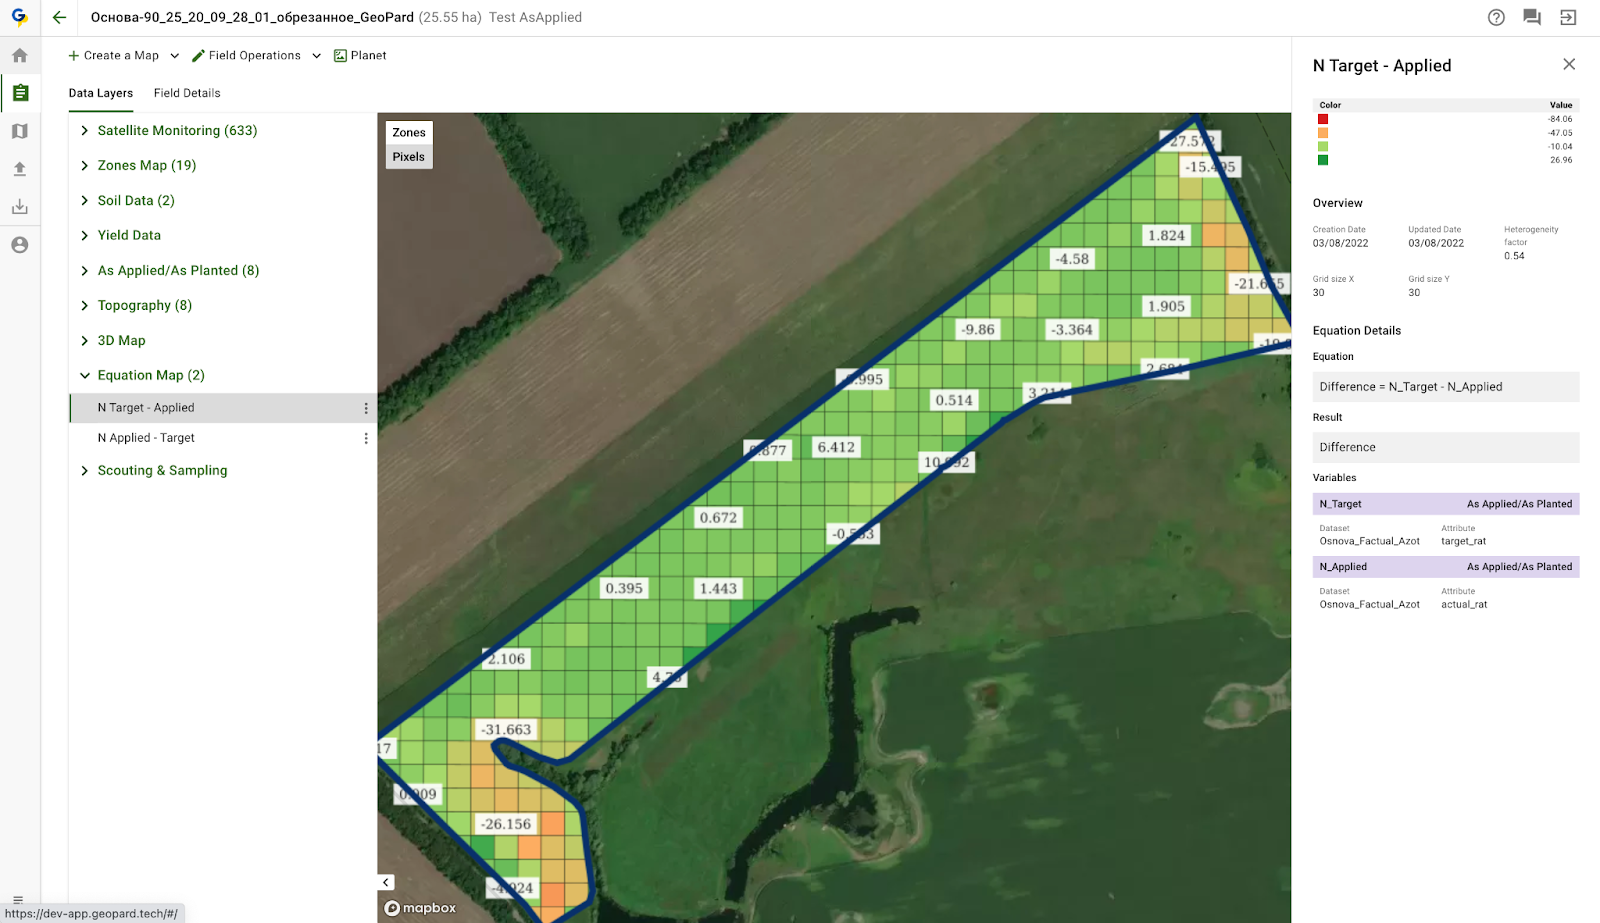
  • Precision Application: Utilize precision agriculture technologies, such as GPS-guided equipment and variable rate technology (VRT), to apply fertilizers more accurately and efficiently. This reduces waste and ensures nutrients are delivered where they are needed most.
  • Slow-Release Fertilizers: Consider using slow-release or controlled-release fertilizers that provide a steady supply of nutrients over time, improving nutrient uptake efficiency.

3. Environmental Impact

Sustainable fertilizer application practices are crucial for protecting the environment. Improper application can lead to nutrient runoff and leaching, which can contaminate water bodies and harm ecosystems. To minimize environmental impact:

  • Buffer Zones: Establish buffer zones around water bodies to reduce the risk of nutrient runoff. Vegetated buffers can help absorb excess nutrients before they reach water sources.
  • Timing and Weather Considerations: Apply fertilizers during periods of low rainfall and avoid application before heavy rains to reduce the risk of nutrient runoff. Soil moisture conditions should also be considered to optimize nutrient uptake.

4. Crop-Specific Nutrient Needs

Different crops have varying nutrient requirements. Understanding these needs is essential for formulating an appropriate fertilizer strategy.

Crop-Specific Nutrient Needs Different crops have varying nutrient requirements

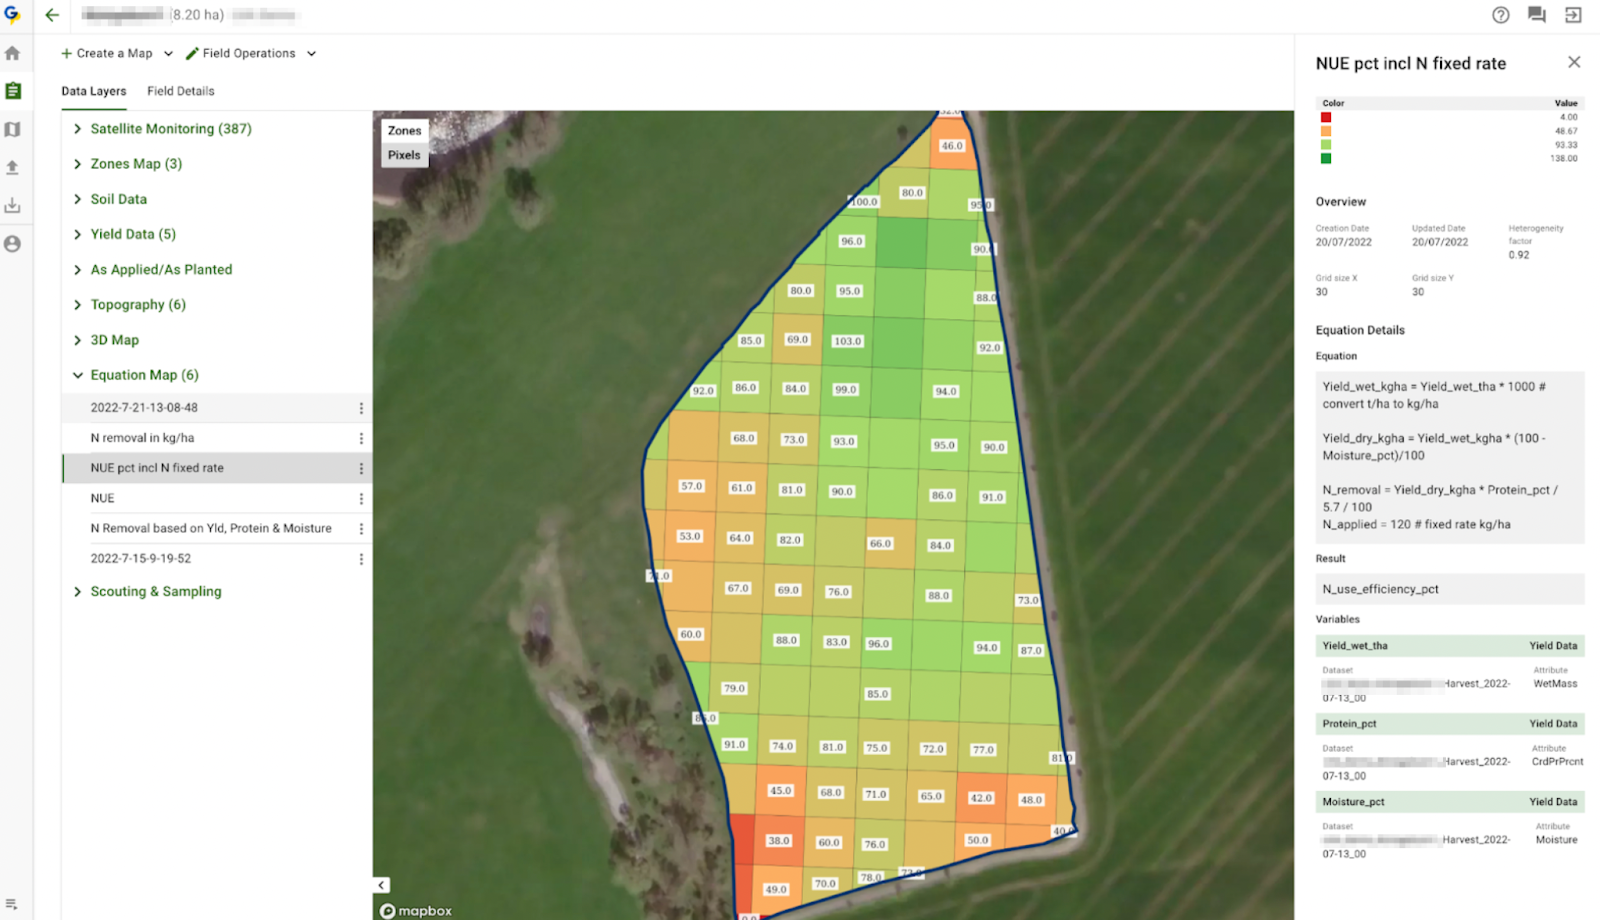
For example, corn typically requires high nitrogen inputs, while legumes like soybeans can fix atmospheric nitrogen and therefore need less nitrogen fertilizer. Tailoring fertilizer plans to the specific needs of each crop ensures optimal growth and productivity while preventing nutrient imbalances in the soil.

5. Monitoring Crop Response

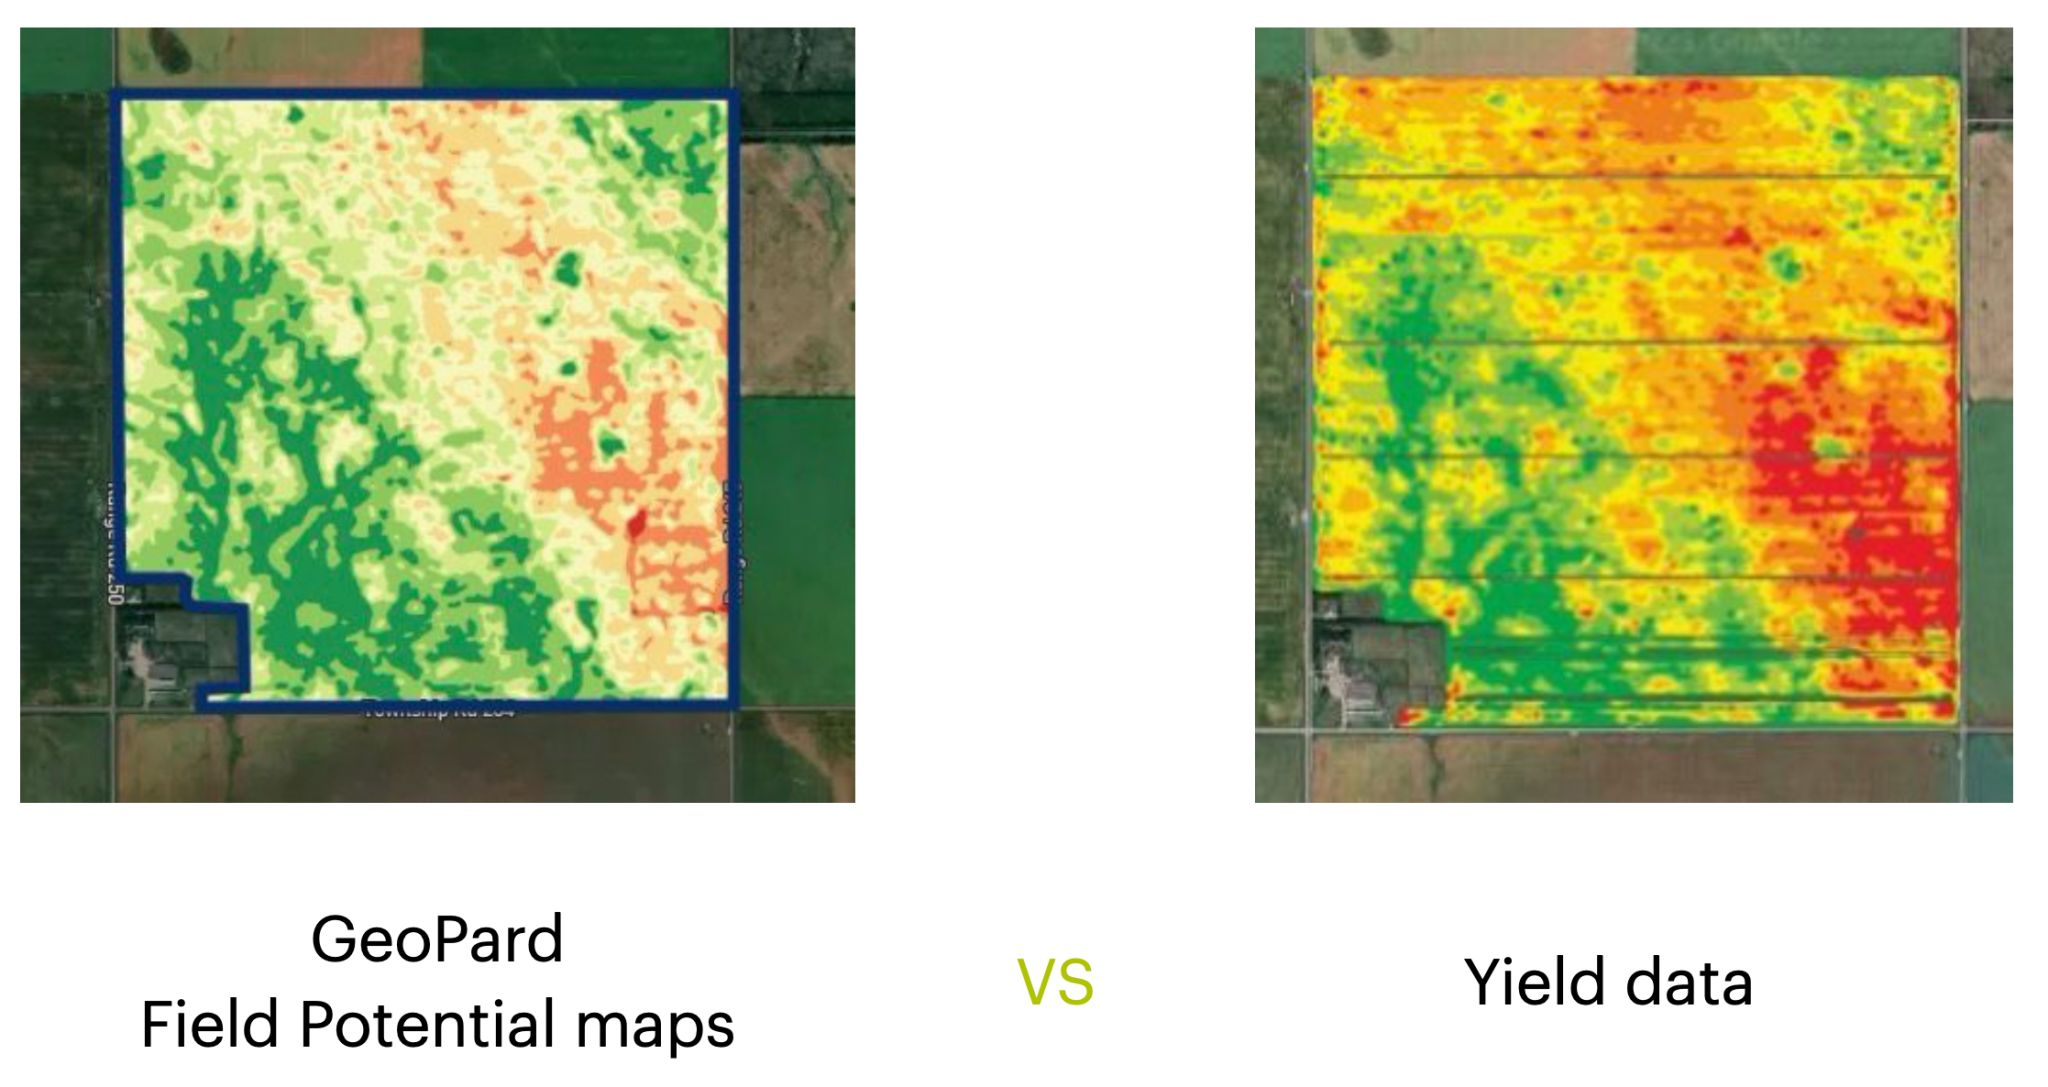
After applying fertilizers, it’s crucial to monitor the crop’s response through regular field observations and data collection. This can include visual assessments of plant health, growth measurements, and more sophisticated methods such as remote sensing and tissue testing.

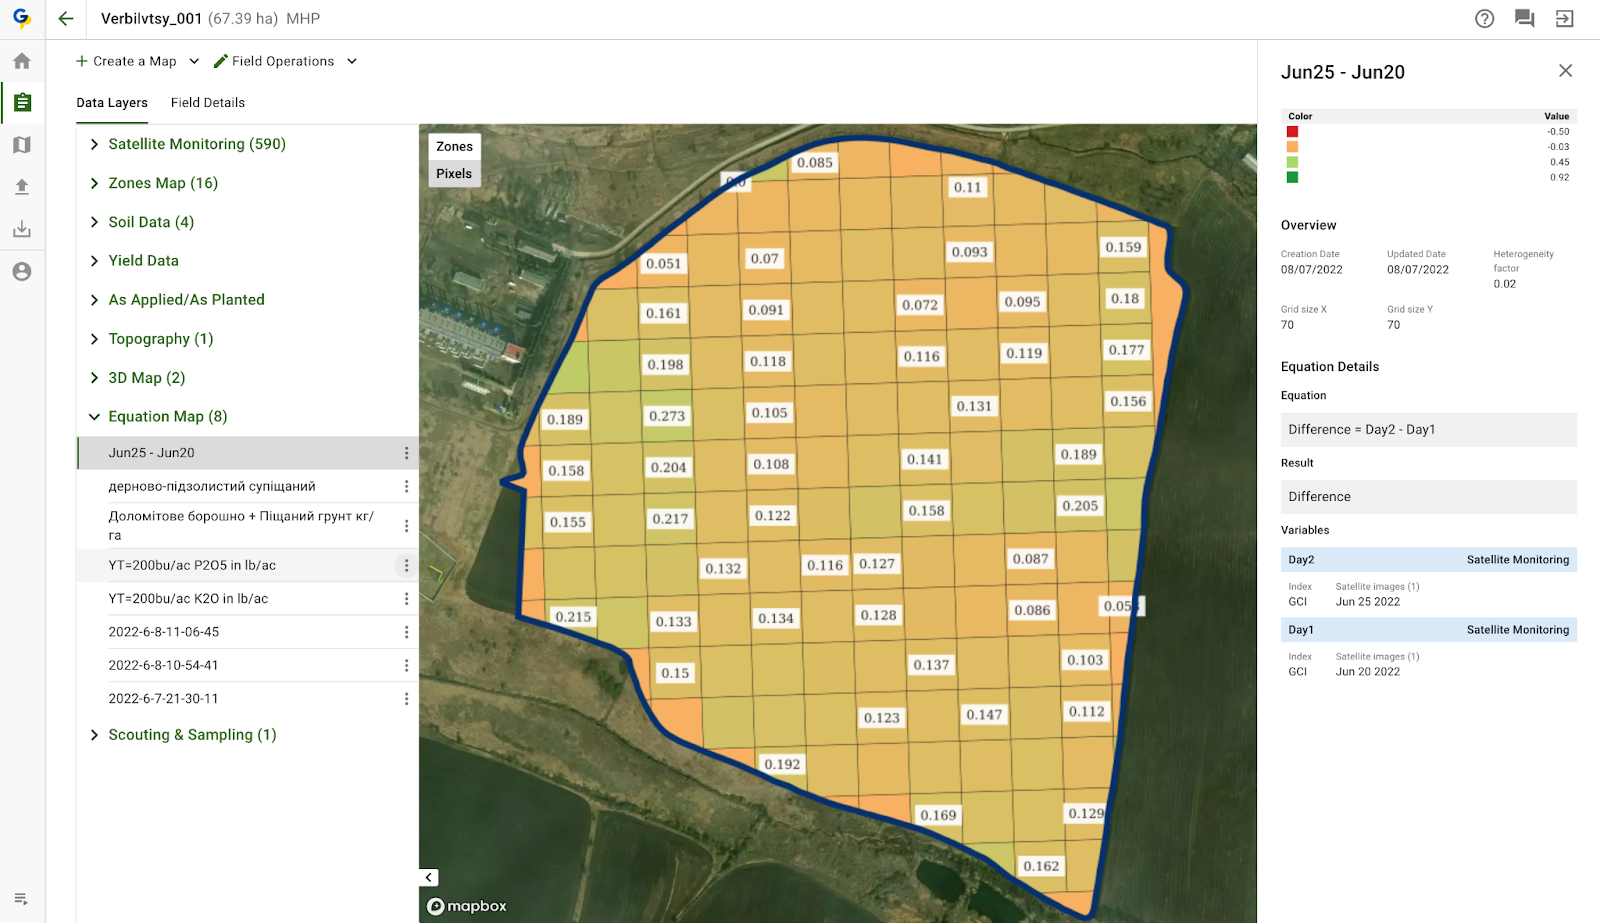
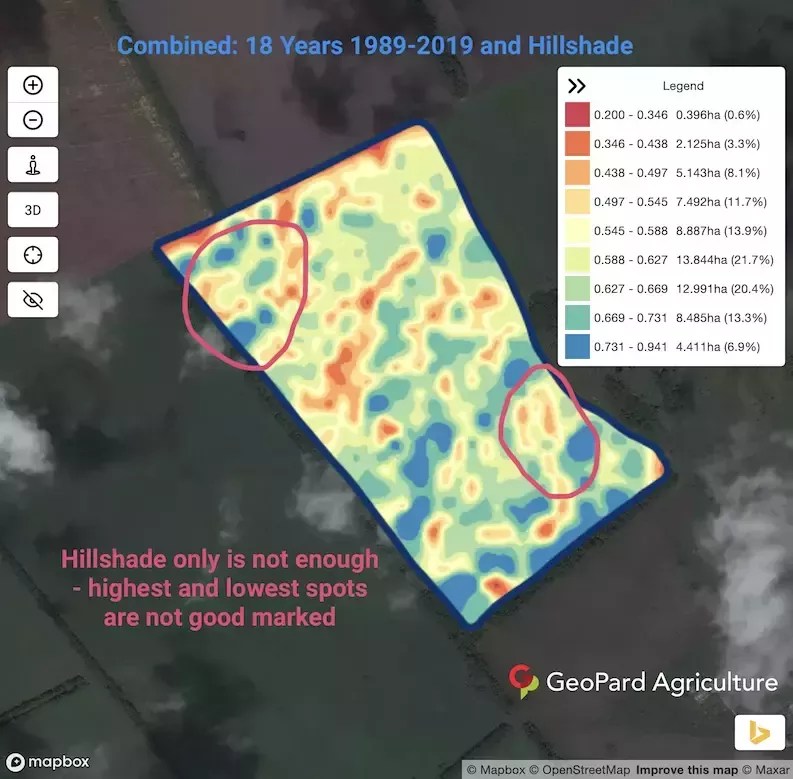
For instance, chlorophyll meters can measure the greenness of leaves, indicating nitrogen levels in the plants. Similarly, drone or satellite imagery can detect variations in crop health across a field, allowing for timely adjustments.

6. Adaptive Management

Agricultural conditions are dynamic, influenced by weather patterns, pest pressures, and evolving soil health. Therefore, fertilizer strategies must be adaptable. By continually assessing crop performance and environmental conditions, farmers can make informed adjustments to their fertilizer plans. This adaptive management approach ensures that crops receive the right amount of nutrients at the right time, enhancing yield potential and resource use efficiency.

Қорытынды

Accurately calculating fertilizer uptake based on yield dry value is fundamental for effective corn production. By understanding nutrient removal rates, conducting soil tests, and considering application efficiency, farmers can optimize fertilizer use, enhance crop yield, and promote environmental sustainability. Adopting best practices and staying informed about advances in precision agriculture and nutrient management can further improve outcomes in corn farming.

Жүгерідегі фантомды өнімділіктің төмендеуі дегеніміз не? Оны қалай азайтуға болады?

Ауыл шаруашылығы саласында оңтайлы дақыл өнімділігіне ұмтылу бүкіл әлемдегі фермерлер үшін үнемі қиындық тудырады. Дәстүрлі ілім көбінесе өнімнің жоғалуын оңай көрінетін факторлар мен қолайсыз ауа райы жағдайларына жатқызса да, «Елес өнімділігінің жоғалуы» деп аталатын одан да нәзік және түсініксіз құбылыс бар.

Бұл зиянкестер, аурулар немесе қолайсыз ауа райы жағдайлары сияқты дәстүрлі факторларға тікелей байланысты емес, дақыл өнімділігінің түсініксіз төмендеуін білдіреді. Көзге көрінетін ашық қауіптерден айырмашылығы, ол жер астында әрекет етеді, көбінесе егін жинау кезінде әсері айқын болғанға дейін байқалмайды.

Азық-түлік және ауыл шаруашылығы ұйымының (ФАО) есебіне сәйкес, жыл сайын жаһандық дақылдардың шамамен 301 ТП3 Т өнімі әртүрлі факторларға, соның ішінде онымен байланысты жоғалады.

Бұл құбылыс өнімділік шектеулерінің дәстүрлі түсінігіне күмән келтіреді және ауылшаруашылық экожүйесін неғұрлым егжей-тегжейлі зерттеуге итермелейді. Сондықтан оны түсіну фермерлер мен агрономдар үшін өте маңызды, себебі ол байқалмай қалуы мүмкін, бірақ дақылдардың өнімділігіне айтарлықтай әсер ететін факторларды анықтайды.

Осы жасырын элементтерді мойындау және шешу арқылы ауылшаруашылық тәжірибелерін жетілдіруге және жалпы өнімділікті жақсартуға болады.

Жүгерідегі фантомды өнімділіктің төмендеуі

Жүгері, әлемдегі ең маңызды дақылдардың бірі, жаһандық азық-түлік өндірісінде маңызды рөл атқарады. Дегенмен, фермерлер жүгері өнімділігін оңтайландыруда көптеген қиындықтарға тап болады, олардың бір маңызды факторы - фантомдық өнімділіктің төмендеуі.

Бұл жүгері егістікте белгілі бір уақыттан кейін табиғи түрде кептіріліп қалғанда болатын ықтимал өнімнің жоғалуы. Бұл жүгері дәндері кепкен сайын тыныс алып, салмағын жоғалта беретіндіктен болады, бұл олардың массасы мен сапасын төмендетеді. Ол көзге көрінбейді, бірақ сіздің пайдаңызға айтарлықтай әсер етуі мүмкін.

Жүгерідегі фантомды өнімділіктің төмендеуі

Индиана штатының Франкфорт қаласында орналасқан Channel Seedsman компаниясының маманы Эрик Франктың айтуынша, бұл “жүгері ертерек жиналмаса, өнімнің төмендеуі. Бұл егін жиналғанға дейін белгілі бір уақытқа дейін табиғи түрде кебуіне жол бергендіктен болады. Ол егістікте сонша ылғалды жоғалтқанда, өзін аздап жейді”.”

Ядроның тыныс алуы оған қалай ықпал етеді?

Бұл дәндер қара қабатқа жеткеннен кейін де тірі болғандықтан және олар тыныс алуды жалғастырып, сақталған қанттары мен крахмалдарын пайдаланатындықтан болады. Бұл метаболикалық белсенділік дәндердің массасын азайтып, олардың сынақ салмағы мен сапасын төмендетеді.

Ядро тыныс алуы - ядролардың оттегі мен глюкозаны пайдаланып энергия, көмірқышқыл газы және су өндіру процесі. Бұл ядроның дамуы мен жетілу кезеңдерінде жүретін қалыпты метаболикалық белсенділік.

Ядроның тыныс алуы фантом өнімділігінің жоғалуына қалай әсер етеді

Дегенмен, ядроның тыныс алуы физиологиялық жетілу кезінде, ядроның ұшында қара қабат пайда болған кезде тоқтамайды. Дән оны өлтіру үшін жеткілікті төмен ылғалдылық деңгейіне (шамамен 15%) дейін кепкенше тірі қалады. Бұл кезеңде ядро тыныс алуды жалғастырып, құрғақ затты жоғалтады.

Осыған байланысты қанша өнім жоғалтуыңыз мүмкін?

Бұл гибрид, ауа райы, топырақ түрі және егін жинау уақыты сияқты бірнеше факторларға байланысты. Дегенмен, кейбір зерттеулер оның бір акрға 5-тен 15 бушельге дейін немесе одан да көп болуы мүмкін екенін көрсетті.

Мысалы, 2020 жылы Farm Journal далалық агрономы Мисси Бауэр суармалы егістікте бір буданмен сынақ учаскесін жүргізді. Ол егістіктің бір бөлігін ылғалдылық деңгейі 27,9% болған 23 қыркүйекте, ал қалған бөлігін ылғалдылық деңгейі 18,4% болған 30 қазанда жинады. Ол ерте жиналған өнім кеш жиналған өнімге қарағанда гектарына 15,6 бушель артық екенін, яғни гектарына 198,6 бушельдің орнына 214,2 бушель екенін анықтады.

Осыған байланысты қанша өнім жоғалтуыңыз мүмкін?

Дегенмен, жалпы ереже бойынша, бұл жүгері ылғалдылығы 13%-ден 16%-ге дейін төмендеген кезде пайда бола бастайды. Кейбір зерттеулерге сәйкес, ол 15%-ден төмен ылғалдылық нүктесіне 0,5%-ден 1,6%-ге дейін өзгеруі мүмкін. Бұл жүгеріні 15% орнына 12% ылғалдылығында жинайтын фермер тек осының салдарынан 4,8%-ге дейін өнім жоғалтуы мүмкін дегенді білдіреді.

Кейбір қосымша зерттеулерде егін жинау күндері кешіктірілгенде егіннің бір акрға 5-тен 15 бушельге дейін төмендегені туралы хабарланған. Мысалы, Небраскадағы бес жылдық зерттеу дән ылғалдылығының өзгеруіне немесе жинау күндері арасындағы уақыт ұзақтығына қарамастан, егін жинау кешіктірілгенде егіннің бір акрға орта есеппен 9,1 бушельге төмендегенін көрсетті. Сол сияқты, Мичиганда жүргізілген зерттеу ертерек егін жинау кезінде егіннің бір акрға орташа 8,9 бушель артықшылығын көрсетті.

Оны қалай өлшеуге болады?

Оны өлшеудің ең жақсы жолы - бір егістікте әртүрлі ылғалдылық деңгейінде жиналған жүгерінің өнімділігін салыстыру. Мұны жүгері әлі ылғалды болған кезде (шамамен 25%-ден 30%-ге дейінгі ылғалдылық) егістіктің бір бөлігін ерте, ал жүгері құрғақ болған кезде (шамамен 15% немесе одан төмен) тағы бір бөлігін кейінірек жинау арқылы жасауға болады.

Екі бөліктің арасындағы өнімділік айырмашылығы егістікте болған шығын мөлшерін көрсетеді. Мысалы, егер ерте жиналған жүгері 200 бу/акр, ал кеш жиналған жүгері 190 бу/акр берсе, онда өнім шығыны 10 бу/акр немесе 5% болады.

Фантом өнімділігінің төмендеуіне ықпал ететін факторлар

Өнімнің төмендеуіне ықпал ететін кейбір жасырын немесе онша айқын емес факторлар:

1. Ядроның өлшемі мен пішіні: Қазіргі жүгері будандарының дәндері ескілеріне қарағанда үлкенірек және тереңірек, бұл олардың тыныс алу кезінде жоғалтатын массасы көбірек екенін білдіреді.

Farm Journal далалық агрономы Мисси Бауэрдің айтуынша, бүгінгі таңда дәндер бір бушельге орта есеппен 70 000-нан 76 000-ға дейін жетеді, ал бұрынғы кезде бұл көрсеткіш 90 000 болған. Бұл әрбір дәннің соңғы өнімділікке көбірек әсер ететінін және жаңа генетикамен оның маңыздылығы жоғары болуы мүмкін екенін білдіреді.

2. Дәннің ылғалдылығы: Дәндердің ылғалдылығы тыныс алу кезінде қанша су жоғалта алатынын анықтайды. Ылғалдылық неғұрлым жоғары болса, тыныс алу жылдамдығы соғұрлым жоғары болады және өнімнің төмендеуі мүмкін.

Арна тұқымын себуші Эрик Франктың айтуынша, бұл дән ылғалдылығы 16%-ден төмен түскенде пайда бола бастайды. Ол егістікте салмағы мен сапасын тым көп жоғалтпау үшін жүгеріні 20% және 25% ылғалдылығы аралығында жинауды ұсынады.

3. Ауа райы жағдайлары: Құрғақ кезеңдегі ауа райы жағдайлары тыныс алу жылдамдығына және өнімнің жоғалуына әсер етуі мүмкін. Жоғары температура, төмен ылғалдылық, жел және күн сәулесі дәндерден судың булануын арттырып, салмақ жоғалтуды жеделдетуі мүмкін.

Фантом өнімділігінің төмендеуіне ықпал ететін факторлар

Керісінше, төмен температура, жоғары ылғалдылық, жаңбыр және бұлттылық булану және тыныс алу процестерін баяулатып, өнімнің жоғалуын азайтуы мүмкін. Дегенмен, бұл жағдайлар зең, ауру және жәндіктердің зақымдану қаупін арттырып, жүгерінің өнімділігі мен сапасын төмендетуі мүмкін.

4. Егін жинау уақыты: Жүгері дақылында егін жинау уақыты оның қаншалықты көп болатынын анықтайтын маңызды фактор болып табылады. Тым ерте жинау кептіру шығындарының көп болуына және сынақ салмағының төмендеуіне әкелуі мүмкін, ал тым кеш жинау шамадан тыс шығынға және дән сапасының төмендеуіне әкелуі мүмкін.

Оңтайлы жинау уақыты гибридтердің пісіп-жетілуі, астық элеваторына жеңілдіктер, ауа райы болжамы, егістік жағдайлары және жабдықтардың қолжетімділігі сияқты бірнеше факторларға байланысты. Фрэнк фермерлерге егістіктерін мұқият бақылап, жинау жоспарларын тиісінше түзетуге кеңес береді.

Сонымен қатар, фермерлер егін жинау жоспарларын кешіктіретін немесе бұзатын қолайсыз жағдайларға, мысалы, жаңбыр, бұршақ, аяз немесе қарға тап болуы мүмкін. Бұл оқиғалар сабақтың тұтастығын бұзып, жабысып қалу, құлақтың түсуі немесе зең инфекциясы қаупін арттырады, бұл жүгерінің өнімділігі мен сапасын одан әрі төмендетуі мүмкін.

Оны қалай болдырмауға немесе азайтуға болады? Ерте егін жинау!

Жүгеріні жоғалтпаудың ең жақсы жолы - жүгеріні оңтайлы ылғалдылық деңгейінде жинау және бақыланатын кептіру әдістерін қолдану. Жүгеріні жоғары ылғалдылық деңгейінде (шамамен 20%-ден 25%-ге дейін) жинау дәннің салмағы мен сапасын сақтауға, сондай-ақ құлақтың түсуіне, сабақтың орналасуына, жәндіктердің зақымдануына, зеңнің өсуіне және микотоксинмен ластануына байланысты егістік шығындарын азайтуға көмектеседі.

Дегенмен, ылғалды жүгеріні жинау үшін оның бұзылуына және сапасының төмендеуіне жол бермеу үшін тиісті кептіру және сақтау орындары қажет. Табиғи ауада кептіру немесе төмен температурада кептіру сияқты бақыланатын кептіру әдістері кептіру процесінде дәннің зақымдалуын және кішіреюін азайтуға көмектеседі.

Фантомды өнімділіктің жоғалуын қалай болдырмауға немесе азайтуға болады Ерте егін жинау!

Сонымен қатар, фермерлер ылғалды жүгеріні жинауға немесе құрғақ жүгеріні жинауға қатысты экономикалық факторларды ескеруі керек. Оларға ылғалдылыққа, кептіру шығындарына немесе үнемдеуге, сақтау шығындарына немесе үнемдеуге, сондай-ақ өнімділік немесе сапаның ықтимал жоғалуына немесе артуына байланысты астық элеваторына жеңілдіктер немесе сыйлықақылар кіреді.

Осы факторларды таразылап, өз егістіктерінен немесе жергілікті дереккөздерден алынған сенімді деректерді пайдалана отырып, фермерлер жүгеріні қашан жинау керектігі және оны қалай тиімді және тиімді кептіру керектігі туралы хабардар шешім қабылдай алады.

Тағы бір тәсіл - сабақтың беріктігіне және құлақтың сақталуына әсер етуі мүмкін аурулар мен зиянкестерге төзімділігі жақсы будандарды таңдау. Сондай-ақ, өсімдіктердің сау өсуі мен дамуына ықпал ететін агротехникалық әдістерді, мысалы, дұрыс тыңайтқыштармен күресу, арамшөптермен күресу, суару және зиянкестермен күресуді қолдануға болады.

PYL басқа дақылдарға әсер ете ме?

Иә, бұл әртүрлі дақылдарға әсер етуі мүмкін, бірақ барлығына бірдей әсер ете бермейді. Ол ылғалдылығы жоғары дақылдарға толық өскен кезде зиян келтіруі мүмкін және егістікте кебуі үшін біраз уақыт кетеді. Дегенмен, кейбір дақылдар тұқымдарына және олардың қалай өсетініне байланысты басқаларына қарағанда қауіптірек. тыныс алу, және қоршаған орта.

Мысалы, соя бұршақтарын алайық. Жүгерімен салыстырғанда, олардың PYL проблемасы аз болуы ықтимал. Себебі, соя жинауға дайын болған кезде ылғал мөлшері аз болады (жүгерінің 70%-мен салыстырғанда шамамен 50%) және олар егістікте тезірек кебеді (жүгері үшін шамамен 10 күн, ал жүгері үшін 30 күн).

Дегенмен, егер соя бұршақтарының ылғалдылығы 13%-ден асқанша жиналмаса, олар тыныс алу, бөлшектену немесе саңырауқұлақтармен жұқтыру салдарынан салмағы мен сапасын жоғалтуы мүмкін.

Ал бидай, керісінше, сояға қарағанда қауіптірек. Себебі, бидайдың егін жинау уақыты келгенде ылғалдылығы жоғары болады (сояның 50%-мен салыстырғанда шамамен 60%) және егістікте кептіруге ұзағырақ уақыт кетеді (соя үшін шамамен 20 күн, ал соя үшін 10 күн).

Бидайдың ылғалдылығы 14%-ден асқанша жиналмаса, тыныс алу, бөлшектену, өскін шығару немесе аурулар салдарынан салмағының 10%-ға дейін жоғалуы мүмкін.

Арпа, сұлы, қара бидай, құмай, күнбағыс, рапс және жоңышқа сияқты басқа дақылдар да PYL-ден зардап шегуі мүмкін. Олардың қаншалықты әсер ететіні дақылдың құрамына, гендеріне, оларға қалай күтім жасалатынына және ауа райына байланысты. Сондықтан фермерлер үшін қажетсіз шығындарды болдырмау үшін дақылдарының ылғалдылық деңгейін бақылап, оларды ең жақсы уақытта жинау өте маңызды.

GeoPard компаниясының автоматты өнімділікті тазалау және калибрлеу жүйесі PYL-ге қалай көмектесе алады?

GeoPard шешімінің негізінде өнімділік деректерін тазалау және калибрлеуді автоматтандыруға арналған бірқатар мүмкіндіктер жатыр. Технология өнімділік деректер жинағындағы олқылықтарды немесе кемшіліктерді жүйелі түрде анықтайды, бұл нақты өнімділіктің сенімдірек көрсетілуін қамтамасыз етеді.

GeoPard компаниясының автоматты өнімділікті тазалау және калибрлеу жүйесі PYL-ге қалай көмектесе алады?

Жетілдірілген алгоритмдерді пайдалану арқылы ол бақылаудың дәлдігін арттырады, фермерлерге шешім қабылдау үшін сенімді негіз береді. GeoPard технологиясының ерекше ерекшеліктерінің бірі - жетіспейтін деректерді синтетикалық өнімділік карталарымен толтыру мүмкіндігі.

Деректердегі олқылықтар болған жағдайларда, ол бар деректер жиынтығымен үздіксіз интеграцияланатын синтетикалық өнімділік карталарын жасайды. Бұл инновациялық тәсіл өнімділіктің жан-жақты есебін қамтамасыз етіп қана қоймай, сонымен қатар дақылдардың өнімділігін дәлірек түсінуге ықпал етеді.

Қолданылуы GeoPard автоматтандырылған тазалау және калибрлеу технология фантомдық өнімділіктің жоғалуын азайтуға тікелей әсер етеді. Ауыл шаруашылығы дақылдарының өнімділігін дәлірек көрсету арқылы фермерлер дақылдарды басқару, ресурстарды бөлу және жинау мерзімдері бойынша жақсы хабардар шешімдер қабылдай алады. Бұл ауыл шаруашылығы мүдделі тараптарына дәл емес деректермен байланысты қиындықтарды жеңуге мүмкіндік береді, сайып келгенде жалпы өнімділіктің артуына әкеледі.

Қорытынды

Бұл ауыл шаруашылығындағы нәзік, бірақ маңызды мәселе, дақылдарды басқаруға кешенді тәсілді талап етеді. Өнімділікке әсер ететін онша айқын емес факторларды мойындау арқылы фермерлер алдын алу шараларын қолдана алады. Дәл егіншілік, топырақ денсаулығын басқару, микробтық өзара әрекеттесу, климатқа негізделген тәжірибелер және дақыл генетикасын жетілдіру оны шешудің жол картасын құрайды. Бұл кешенді көзқарасты қабылдау ауыл шаруашылығы қауымдастығына дамып келе жатқан қиындықтарға қарамастан тұрақты және төзімді азық-түлік өндірісі жүйелерін дамытуға мүмкіндік береді.

Өнімділік деректерін автоматтандырылған тазалау және калибрлеу

Automated Yield Data Cleaning and Calibration (AYDCC) is a process that uses algorithms and models to detect and correct errors in yield data, such as outliers, gaps, or biases. AYDCC can improve the quality and reliability of yield data, which can lead to better insights and recommendations for farmers.

Introduction to Yield Data

Yield data is one of the most important sources of information for farmers in the 21st century. It refers to the data collected from various farm machinery, such as combines, planters, and harvesters, that measure the quantity and quality of crops produced in a given field or area.

It holds immense importance for several reasons. Firstly, it aids farmers in making informed decisions. Armed with detailed yield data, farmers can fine-tune their practices to maximize productivity.

For instance, if a specific field consistently produces lower yields, farmers can investigate the underlying causes, such as soil health or irrigation issues, and take corrective measures.

Furthermore, it enables precision agriculture. By mapping variations in crop performance across their fields, farmers can tailor their input applications, such as fertilizers and pesticides, to specific areas. This targeted approach not only optimizes resource use but also reduces environmental impacts.

According to the Food and Agriculture Organization (FAO), global agricultural production needs to increase by 60% by 2050 to meet the growing demand for food. Yield data, through its role in enhancing crop productivity, is instrumental in achieving this target.

Furthermore, in Brazil, a soybean farmer used yield data along with soil sampling data to create variable-rate fertilizer maps for his fields. He applied different rates of fertilizer according to the soil fertility and yield potential of each zone.

He also used yield data to compare different soybean varieties and select the best ones for his conditions. As a result, he increased his average yield by 12% and reduced his fertilizer costs by 15%.

Similarly, in India, a rice farmer also used yield datasets along with weather data to adjust his irrigation schedule for his fields. He monitored the soil moisture levels and rainfall patterns using sensors and satellite imagery.

understanding and utilization of yield data

He also used it to compare different rice varieties and select the best ones for his conditions. As a result, he increased his average yield by 10% and reduced his water use by 20%.

Despite its benefits, yield data still faces some challenges in terms of its development and adoption. Some of these challenges are:

  • Data quality: Its accuracy and reliability depends on the quality of the sensors, the calibration of the machinery, the data collection methods, and the data processing and analysis techniques. Poor data quality can lead to errors, biases, or inconsistencies that can affect the validity and usefulness of the data.
  • Data access: The availability and affordability of yield data depend on the access to and ownership of the farm machinery, the sensors, the data storage devices, and the data platforms. Lack of access or ownership can limit the ability of farmers to collect, store, share, or use their own data.
  • Data privacy: Its security and confidentiality depends on the protection and regulation of the data by the farmers, the machinery manufacturers, the data providers, and the data users. Lack of protection or regulation can expose the data to unauthorized or unethical use, such as theft, manipulation, or exploitation.
  • Data literacy: The understanding and utilization of yield data depend on the skills and knowledge of the farmers, the extension agents, the advisors, and the researchers. Lack of skills or knowledge can hinder the ability of these actors to interpret, communicate, or apply the data effectively.
gathering datasets using farm machines like harvesters

Therefore, to overcome these challenges and realize the full potential of yield data, it is important to cleaning and calibrate the yield data.

Introduction to yield data cleaning and calibration

Yield data are valuable sources of information for farmers and researchers who want to analyze crop performance, identify management zones, and optimize decision-making. However, it often require cleaning and calibration to ensure their reliability and accuracy.

Calibrating the “YieldDataset” is a functionality that corrects the distribution of values in alignment with mathematical principles, enhancing the overall integrity of the data. It bolsters the quality of decision-making and renders the dataset valuable for further in-depth analysis.

GeoPard Yield Clean-Calibration Module

GeoPard made it possible to clean and correct yield datasets using its Yield Clean-Calibration module.

We’ve made it easier than ever to enhance the quality of your yield datasets, empowering farmers to make data-driven decisions that you can rely on.

GeoPard - Yield Cleaning & Calibration, similar to Field Potential zones

After calibration and cleaning, the resulting yield dataset becomes homogeneous, without outliers or abrupt changes between neighboring geometries.

With our new module, you can:

Select an option to proceed
  • Remove corrupted, overlapped, and subnormal data points
  • Calibrate yield values across multiple machines
  • Start calibration with just a few clicks (simplifying your user experience) or execute the associated GeoPad API endpoint

Some of the most common use cases of automated yield data cleaning and calibration include:

  • Synchronizing data when multiple harvesters have worked either simultaneously or over several days, ensuring consistency.
  • Making the dataset more homogeneous and accurate by smoothing out variations.
  • Removing data noise and extraneous information that can cloud insights.
  • Eliminating turnarounds or abnormal geometries, which may distort the actual patterns and trends in the field.

In the picture below, you can see a field where 15 harvesters worked at the same time. It shows how the original yield dataset and the improved dataset after calibration with GeoPard yield clean-calibration module look quite different and easy to understand.

difference between the original and improved yield datasets with GeoPard's Calibration Module

Why is it important to clean and calibrate?

Yield data are collected by yield monitors and sensors that are attached to harvesters. These devices measure the mass flow rate and moisture content of the harvested crop, and use GPS coordinates to georeference the data.

However, these measurements are not always accurate or consistent, due to various factors that can affect the performance of the equipment or the crop conditions. Some of these factors are:

1. Equipment variations: Farm machinery, such as combines and harvesters, often have inherent variations that can lead to discrepancies in data collection. These variations might include differences in sensor sensitivity or machinery calibration.

For example, some yield monitors may use a linear relationship between voltage and mass flow rate, while others may use a nonlinear one. Some sensors may be more sensitive to dust or dirt than others. These variations can cause discrepancies in yield data across different machines or fields.

Example 1 U-turns, Stops, Half Equipment Width Used
Example 2 U-turns, Stops, Half Equipment Width Used

2. Environmental factors: Weather conditions, soil types, and topography play significant roles in crop yields. If not accounted for, these environmental factors can introduce noise and inaccuracies into yield data.

For instance, sandy soils or steep slopes may cause lower yields than loamy soils or flat terrains. Likewise, areas with higher crop density may have higher yields than areas with lower density.

3. Sensor inaccuracies: Sensors, despite their precision, are not infallible. They may drift over time, providing inaccurate readings if not regularly calibrated.

For example, a faulty load cell or a loose wiring may cause inaccurate mass flow rate readings. A dirty or damaged moisture sensor may give erroneous moisture content values. A wrong field name or ID entered by the operator may assign yield data to the wrong field file.

These factors can result in yield datasets that are noisy, erroneous, or inconsistent. If these data are not cleaned and calibrated properly, they can lead to misleading conclusions or decisions.

For example, using uncleaned yield data to create yield maps may result in false identification of high- or low-yielding areas within a field.

Why is it important to clean and calibrate yield dataset

Using uncalibrated yield datasets to compare yields across fields or years may result in unfair or inaccurate comparisons. Using uncleaned or uncalibrated yield data to calculate nutrient balances or crop inputs may result in over- or under-application of fertilizers or pesticides.

Therefore, it is essential to perform yield data cleaning and calibration before using them for any analysis or decision-making purpose. Yield datasets cleaning is the process of removing or correcting any errors or noise in the raw yield data collected by the yield monitors and sensors.

Automated methods for cleaning and calibrating yield data

This is where automated data cleaning techniques come in handy. Automated data cleaning techniques are methods that can perform data cleaning tasks without or with minimal human intervention.

Configure the Calibrate step
Automated methods for cleaning and calibrating

Automated data cleaning techniques can save time and resources, reduce human errors, and enhance the scalability and efficiency of data cleaning. Some of the common automated data cleaning techniques for yield data are:

1. Outlier Detection: Outliers are data points that deviate significantly from the norm. Automated algorithms can identify these anomalies by comparing data points to statistical measures such as mean, median, and standard deviation.

For example, if a yield dataset shows an exceptionally high harvest yield for a particular field, an outlier detection algorithm can flag it for further investigation.

2. Noise Reduction: Noise in yield data can arise from various sources, including environmental factors and sensor inaccuracies.

Automated noise reduction techniques, such as smoothing algorithms, filter out erratic fluctuations, making the data more stable and reliable. This helps in identifying true trends and patterns in the data.

3. Data Imputation: Missing data is a common issue in yield data sets. Data imputation techniques automatically estimate and fill in missing values based on patterns and relationships within the data.

For instance, if a sensor fails to record data for a specific time period, imputation methods can estimate the missing values based on adjacent data points.

Hence, automated data cleaning techniques serve as the gatekeepers of data quality, ensuring that yield datasets remain a reliable and valuable asset for farmers worldwide.

Furthermore, there are lots of handy tools and computer programs that can automatically clean and adjust yield data, and GeoPard is one of them. The GeoPard Yield Clean-Calibration Module, along with similar solutions, is super important for making sure the data is accurate and reliable.

GeoPard - Yield Cleaning & Calibration - 3 harvesters

Қорытынды

Automated Yield Data Cleaning and Calibration (AYDCC) is essential in precision agriculture. It ensures the accuracy of crop data by removing errors and enhancing quality, enabling farmers to make informed decisions. AYDCC addresses data challenges and utilizes automated techniques for trustworthy results. Tools like GeoPard’s Yield Clean-Calibration Module simplify this process for farmers, contributing to efficient and productive farming practices.

GeoPard компаниясының дәл ауыл шаруашылығына арналған автоматтандырылған далалық шекараларды анықтау моделі

GeoPard have completed a successful development of an automated field boundaries detection model using mutli-year satellite imagery, accurate cloud and shadow detection, and advanced proprietary algorithms, including deep neural networks.

The GeoPard field detection model has achieved a state-of-the-art accuracy of 0.975 on the Intersection over Union (IoU) metric, validated across diverse regions and crop types globally.

Check out these images to see the results in Germany (average field size is 7 hectares):

1 - Raw Sentinel-2 image

1 – Raw Sentinel-2 image

3 - Segmented field boundaries

2 – Super-resolution Sentinel-2 image by GeoPard (1 meter resolution)

2 - Super-resolution Sentinel-2 image by GeoPard

3 – Segmented field boundaries, 0.975 Intersection over union (IoU) accuracy metric, across multiple international regions and crop types.


Integration into our API and GeoPard application is coming soon. This automated and cost-effective method helps predict yields, benefits governmental organizations, and assists large landowners who often need to update field boundaries between seasons.

GeoPard’s approach utilizes multi-year crop vegetation trends using multi-factor analysis and crop rotation.


The model is accessible via the GeoPard API on a pay-as-you-go basis, offering flexibility without the need for costly subscriptions.


What is Field Boundaries Delineation?

Field boundaries delineation refers to the process of identifying and mapping the boundary of agricultural fields or parcels of land. It involves using various techniques and data sources to demarcate the limits of individual fields or agricultural plots.

Traditionally, field boundaries were delineated manually by farmers or landowners based on their knowledge and observations.

However, with advancements in technology, particularly in remote sensing and geographic information systems (GIS), automated and semi-automated methods have become increasingly prevalent.

One common approach is the analysis of satellite or aerial imagery. High-resolution images captured by satellites or aircraft can provide detailed information about the landscape, including the boundaries between different land parcels.

Image processing algorithms can be applied to these images to detect distinct features such as changes in vegetation type, color, texture, or patterns that indicate the presence of field boundaries.

Another technique involves using LiDAR (Light Detection and Ranging) data, which uses laser beams to measure the distance between the sensor and the Earth’s surface.

LiDAR data can provide detailed elevation and topographic information, allowing for the identification of subtle variations in terrain that may correspond to field boundaries.

Additionally, geographic information systems (GIS) play a crucial role in delineation of field boundaries.

GIS software allows for the integration and analysis of various data layers, including satellite imagery, topographic maps, land ownership records, and other relevant information. By combining these data sources, GIS can aid in the interpretation and identification of field boundaries.

The accurate delineation of field is essential for several reasons. It facilitates better management of agricultural resources, enables precision farming techniques, and supports the planning and implementation of agricultural practices such as irrigation, fertilization, and pest control.

Accurate field boundary data also assists in land administration, land-use planning, and compliance with agricultural regulations.

How it is useful?

It plays a crucial role in agriculture and land management, providing several benefits and importance supported by evidence and global figures. Here are some key points:

1. Precision Agriculture: Accurate field boundaries help in implementing precision agriculture techniques, where resources such as water, fertilizers, and pesticides are precisely targeted to specific areas within fields.

According to a report by the World Bank, precision agriculture technologies have the potential to increase crop yields by 20% and reduce input costs by 10-20%.

2. Efficient Resource Management: It enables farmers to better manage resources by optimizing irrigation systems, adjusting fertilization practices, and monitoring crop health. This precision reduces resource wastage and environmental impact.

The Food and Agriculture Organization (FAO) estimates that precision agriculture practices can reduce water usage by 20-50%, decrease fertilizer consumption by 10-20%, and reduce pesticide usage by 20-30%.

3. Land Use Planning: Accurate field boundary data is essential for land use planning, ensuring efficient utilization of available agricultural land. It allows policymakers and land managers to make informed decisions regarding land allocation, crop rotation, and zoning.

This can lead to increased agricultural productivity and improved food security. A study published in the Journal of Soil and Water Conservation found that effective land use planning could increase global food production by 20-67%.

4. Farm Subsidies and Insurance: Many countries provide agricultural subsidies and insurance programs based on field boundaries. Accurate delineation helps in determining eligible land areas, ensuring fair distribution of subsidies, and calculating insurance premiums accurately.

For instance, the European Union’s Common Agricultural Policy (CAP) relies on accurate field boundaries for subsidy calculations and compliance monitoring.

5. Land Administration and Legal Boundaries: Field boundaries delineation in agriculture is crucial for land administration, property rights, and resolving land disputes. Accurate maps of field boundaries help establish legal ownership, support land registration systems, and facilitate transparent land transactions.

The World Bank estimates that only 30% of the world’s population has legally documented rights to their land, highlighting the importance of reliable field boundary data for secure land tenure.

6. Compliance and Environmental Sustainability: Accurate field boundaries aid in compliance monitoring, ensuring adherence to environmental regulations and sustainable farming practices.

It helps identify buffer zones, protected areas, and areas prone to erosion or water contamination, enabling farmers to take appropriate measures. Compliance with environmental standards enhances sustainability and reduces negative impacts on ecosystems.

According to the FAO, sustainable farming practices can mitigate up to 6 billion tons of greenhouse gas emissions annually.

These points illustrate its usefulness and importance in agriculture and land management. The evidence and global figures presented support the positive impacts it can have on resource efficiency, land use planning, legal frameworks, environmental sustainability, and overall agricultural productivity.

In summary, field boundaries delineation in agriculture is the process of identifying and mapping the boundary of agricultural fields or parcels of land. It relies on various techniques such as satellite imagery analysis, LiDAR data, and GIS to accurately define and demarcate these boundaries, enabling effective land management and agricultural practices.

Дәл ауыл шаруашылығында теңдеуге негізделген аналитика

Теңдеуге негізделген аналитика модулінің шығарылуымен GeoPard командасы фермерлерге, агрономдарға және кеңістіктік деректер аналитиктеріне әрбір шаршы метр үшін практикалық түсініктер беруде үлкен қадам жасады. Модуль ауыл шаруашылығына қатысты аналитиканың кең ауқымын қамтитын 50-ден астам алдын ала анықталған GeoPard дәлдік формулаларының каталогын қамтиды.

Дәлдік формулалары мыналарға негізделген көпжылдық тәуелсіз агрономиялық университет және салалық зерттеулер және олардың дәлдігі мен пайдалылығын қамтамасыз ету үшін мұқият тексерілген. Оларды оңай конфигурациялауға болады автоматты түрде орындалады кез келген сала үшін пайдаланушыларға егін өнімділігін оңтайландыруға және кіріс шығындарын азайтуға көмектесетін қуатты және сенімді түсініктер береді.

Теңдеуге негізделген аналитика модулі GeoPard платформасының негізгі ерекшелігі болып табылады, ол пайдаланушыларға өз операцияларын тереңірек түсінуге және егіншілік тәжірибелері туралы деректерге негізделген шешімдер қабылдауға мүмкіндік беретін қуатты құралды ұсынады. Формулалардың үнемі өсіп келе жатқан каталогымен және әртүрлі далалық сценарийлер үшін формулаларды теңшеу мүмкіндігімен. GeoPard кез келген егіншілік операциясының нақты қажеттіліктерін қанағаттандыра алады.


Өнімділік деректеріне негізделген калийді кетіру

Өнімділік деректеріне негізделген калийді кетіру


Қолдану жағдайлары (төмендегі мысалдарды қараңыз):

  • Азотты сіңіру Өнімділік және ақуыз деректерін пайдалана отырып, абсолютті сандармен
  • Азотты пайдалану тиімділігі (NUE) және Өнімділік және Ақуыз деректер қабаттарымен артық есептеулер
  • Топырақ сынамаларын алудан алынған рН деректеріне негізделген әк бойынша ұсыныстар немесе топырақ сканерлері
  • Ішкі өріс (аймақтар немесе пиксель деңгейі ROI карталары)
  • Топырақ сынамаларын алу, егістік әлеуеті, топография және өнімділік деректеріне негізделген микро және макро қоректік заттарды тыңайту бойынша ұсыныстар
  • Көміртекті модельдеу
  • Өзгерістерді анықтау және ескерту (Sentinel-2, Landsat8-9 немесе Planet кескіндері арасындағы айырмашылықты есептеңіз)
  • Топырақ және дән ылғалдылығын модельдеу
  • Ылғалды өнімділік деректер жиынтығынан құрғақ өнімділікті есептеу
  • Мақсатты рецепт және қолданылған карталар айырмашылығын есептеу


Екі өнімділік мақсатына негізделген калий ұсыныстары (өнімділік аймақтары)

Екі өнімділік мақсатына негізделген калий ұсыныстары (өнімділік аймақтары)


Тыңайтқыш: Ұсыныстар бойынша нұсқаулық. Калий / Жүгері.

Тыңайтқыш: Ұсыныстар бойынша нұсқаулық (Оңтүстік Дакота мемлекеттік университеті): Калий / Жүгері. Шолу және қайта қарау: Джейсон Кларк | Ассистент профессор және SDSU кеңейту топырақ құнарлылығы бойынша маман


Калийді пайдалану тиімділігі (кг/га)

Калийді пайдалану тиімділігі (кг/га)


Азотты пайдалану тиімділігі пайызбен. Есептеу өнімділік, ақуыз және дән ылғалдылығы туралы деректер қабаттарына негізделген.

Азотты пайдалану тиімділігі пайызбен. Есептеу өнімділік, ақуыз және дән ылғалдылығы туралы деректер қабаттарына негізделген.


Азот: Мақсатты рецепт бойынша және қолданылғандай

Азот: Мақсатты рецепт бойынша және қолданылғандай


Екі спутниктік суреттегі хлорофилл айырмашылығы

Екі спутниктік суреттегі хлорофилл айырмашылығы


GeoPard пайдаланушысы барларын реттеп, өздерін жасай алады жеке формулалар кескіндерге, топыраққа, өнімділікке, топографияға немесе GeoPard қолдайтын кез келген басқа деректер қабаттарына негізделген. 

GeoPard теңдеулері үлгісінің мысалдары

GeoPard теңдеулері үлгісінің мысалдары


Формулаға негізделген аналитика фермерлерге, агрономдарға және деректер ғалымдарына жұмыс процестерін автоматтандыруға және тұрақты және дәл ауыл шаруашылығын оңай енгізуге мүмкіндік беретін бірнеше деректер мен ғылыми зерттеулерге негізделген шешімдер қабылдауға көмектеседі.

Дәл ауыл шаруашылығында теңдеуге негізделген аналитика дегеніміз не? Дәлдік формуласын қолдану

Дәл ауыл шаруашылығындағы теңдеуге негізделген аналитика ауыл шаруашылығы деректерін талдау және фермерлерге дақылдарды басқару туралы жақсы шешім қабылдауға көмектесетін түсініктер алу үшін математикалық модельдерді, теңдеулерді, дәлдік формуласын және алгоритмдерді пайдалануды білдіреді.

Бұл талдау әдістері ауылшаруашылық тәжірибелерін оңтайландыру және дақылдардың өнімділігін арттыру, сонымен қатар ресурстардың қалдықтары мен қоршаған ортаға әсерін азайту үшін ауа райы жағдайлары, топырақ қасиеттері, дақылдардың өсуі және қоректік заттарға деген қажеттілік сияқты әртүрлі факторларды қамтиды.

Дәл ауыл шаруашылығындағы теңдеуге негізделген аналитиканың кейбір негізгі компоненттеріне мыналар жатады:

  • Өсімдіктердің өсу модельдері: Бұл модельдер дақылдардың өсуі мен өнімділігін болжау үшін ауа райы, топырақ қасиеттері және дақылдарды басқару тәжірибелері сияқты әртүрлі факторлар арасындағы байланысты сипаттайды. Мұндай модельдердің мысалдарына CERES (дақыл ортасының ресурстарын синтездеу) және APSIM (ауыл шаруашылығы өндіріс жүйелерінің sIMulator) модельдері жатады. Бұл модельдер фермерлерге отырғызу күндері, дақыл сорттары және суару кестесі туралы хабардар шешім қабылдауға көмектеседі.
  • Топырақ су модельдері: Бұл модельдер топырақ профиліндегі судың мөлшерін жауын-шашын, булану және дақылдардың суды пайдалануы сияқты факторларға негіздеп бағалайды. Олар фермерлерге суару әдістерін оңтайландыруға көмектесе алады, дақылдардың өнімділігін арттыру үшін судың тиімді және дұрыс уақытта пайдаланылуын қамтамасыз етеді.
  • Қоректік заттарды басқару модельдері: Бұл модельдер дақылдардың қоректік заттарға деген қажеттілігін болжайды және фермерлерге тыңайтқыштарды енгізудің оңтайлы мөлшері мен уақытын анықтауға көмектеседі. Бұл модельдерді пайдалану арқылы фермерлер дақылдардың қоректік заттардың дұрыс мөлшерін алуын қамтамасыз ете алады, сонымен бірге қоректік заттардың ағып кетуі мен қоршаған ортаның ластану қаупін азайтады.
  • Зиянкестер мен аурулардың үлгілері: Бұл модельдер ауа райы жағдайлары, дақылдардың өсу кезеңдері және басқару тәжірибелері сияқты факторларға негізделіп, зиянкестер мен аурулардың пайда болу ықтималдығын болжайды. Осы модельдерді пайдалану арқылы фермерлер зиянкестер мен ауруларды басқару туралы алдын ала шешімдер қабылдай алады, мысалы, отырғызу күндерін реттеу немесе пестицидтерді дұрыс уақытта қолдану.
  • Қашықтықтан зондтауға негізделген модельдер: Бұл модельдер дақылдардың денсаулығын бақылау, стресс факторларын анықтау және өнімділікті бағалау үшін спутниктік суреттерді және басқа да қашықтықтан зондтау деректерін пайдаланады. Бұл ақпаратты басқа деректер көздерімен біріктіру арқылы фермерлер дақылдарды басқару туралы жақсырақ шешім қабылдай алады және ресурстарды пайдалануды оңтайландыра алады.

Қорытындылай келе, дәл ауыл шаруашылығындағы теңдеуге негізделген аналитика дақылдардың өсуі мен басқаруына әсер ететін әртүрлі факторлар арасындағы күрделі өзара әрекеттесуді талдау үшін математикалық модельдер мен алгоритмдерді пайдаланады. Осы аналитиканы пайдалану арқылы фермерлер ауыл шаруашылығы тәжірибелерін оңтайландыру, дақылдардың өнімділігін арттыру және қоршаған ортаға әсерді азайту үшін деректерге негізделген шешімдер қабылдай алады.


Жиі қойылатын сұрақтар


1. Дәл ауыл шаруашылығы ауыл шаруашылығындағы ресурстарды пайдалану және ластану мәселелерін шешуге қалай көмектесе алады?

Бұл ауыл шаруашылығындағы ресурстарды мақсатты пайдалану, ресурстарды тиімді басқару, мониторингті күшейту және табиғатты қорғау тәжірибелерін енгізу арқылы ресурстарды пайдалану және ластану мәселелерін шешуге көмектесе алады. Тыңайтқыштар мен пестицидтер сияқты ресурстарды тек қажет болған жағдайда ғана қолдану арқылы фермерлер қалдықтарды азайтып, ластануды азайта алады.

Деректерге негізделген шешім қабылдау ресурстарды оңтайлы басқаруға мүмкіндік береді, ал нақты уақыт режиміндегі мониторинг ластану оқиғаларының алдын алу үшін уақтылы араласуларға мүмкіндік береді. Сонымен қатар, табиғатты қорғау тәжірибелерін енгізу тұрақты ауыл шаруашылығын ілгерілетеді және қоршаған ортаға әсерді азайтады.

GeoPard далалық потенциал карталары мен өнімділік деректері

GeoPard Field Potential карталары өте жиі ұқсайды дәл сондай, түсім сияқты деректер.

Біз оларды қолдана отырып жасаймыз Көпқабатты аналитика Тарихи ақпараттың, топографияның және жалаңаш топырақты талдаудың.

Осындай процестің Синтетикалық өнімділік карталары автоматтандырылған. (және патенттелген) және оны әлемдегі кез келген өріс шамамен 1 минут ішінде жасай алады.


GeoPard далалық потенциал карталары мен өнімділік деректері

Негіз ретінде қолдануға болады:

Алаңдық потенциал карталары дегеніміз не?

Алаңдық потенциал карталары, сондай-ақ өнім потенциалы карталары немесе өнімділік потенциалы карталары деп те аталады, дала ішіндегі өнімнің потенциалды түсімі немесе өнімділіктің кеңістіктік өзгергіштігін көрнекі түрде бейнелейді. Бұл карталар топырақтың қасиеттері, рельеф және тарихи өнім деректері сияқты дақылдардың өсуіне әсер ететін әртүрлі факторларды талдау арқылы жасалады.

Бұл карталарды дәл ауыл шаруашылығында басқару шешімдерін қабылдауға, мысалы, тыңайтқыштарды өзгермелі мөлшерде қолдану, суару және басқа да ресурстарды енгізуді бағыттауға, сондай-ақ арнайы назар аударуды немесе басқару тәсілдерін қажет ететін аймақтарды анықтауға пайдалануға болады.

Алаң потенциалы карталарын жасау кезінде әдетте ескерілетін кейбір негізгі факторларға мыналар жатады:

  1. Топырақтың қасиеттері: Топырақтың құрылымы, құрылыстылығы, органикалық заттардың мөлшері және қоректік заттардың қолжетімділігі сияқты қасиеттері дақылдардың өнім әлеуетін анықтауда маңызды рөл атқарады. Дала бойындағы топырақ қасиеттерін картаға түсіру арқылы фермерлер жоғары немесе төмен өнімділік әлеуеті бар аймақтарды анықтай алады.
  2. ТопографияБиіктік, беткейдің қисайы және бағыты сияқты факторлар дақылдардың өсуіне және өнім әлеуетіне әсер етуі мүмкін. Мысалы, төменгі аймақтар су басуға бейім немесе аяз қаупі жоғары болуы мүмкін, ал тік беткейлер эрозияға көбірек ұшырауы мүмкін. Осы топографиялық ерекшеліктерді картаға түсіру фермерлерге олардың өнімділік әлеуетіне қалай әсер ететінін түсінуге және басқару тәжірибелерін тиісінше түзетуге көмектеседі.
  3. Тарихи өнімділік деректері: Өткен жылдар немесе маусымдар бойынша тарихи өнімділік деректерін талдау арқылы фермерлер өз алқаптары бойынша өнімділіктің үрдістері мен үлгілерін анықтай алады. Бұл ақпаратты тұрақты түрде жоғары немесе төмен өнім әлеуеті бар аймақтарды көрсететін карталарды жасау үшін пайдалануға болады.
  4. Қашықтық зондтау деректері: Спутниктік суреттер, әуе фотосуреттері және басқа да қашықтықтан зондтау деректері дақылдардың денсаулығын, өміршеңдігін және өсу кезеңін бағалау үшін қолданылуы мүмкін. Бұл ақпарат дақылдардың өнімділік әлеуетіндегі кеңістіктік өзгергіштікті көрсететін карталарды жасау үшін пайдаланылуы мүмкін.
  5. Климаттық деректер: Температура, жауын-шашын және күн радиациясы сияқты климаттық өзгермелілер дақылдардың өсуіне және өнім әлеуетіне де әсер етуі мүмкін. Осы карталарға климаттық деректерді енгізу арқылы фермерлер қоршаған орта факторларының өз алқаптарының өнімділік әлеуетіне қалай әсер ететінін жақсырақ түсіне алады.

Олар дәл ауыл шаруашылығында құнды құрал болып табылады, себебі олар фермерлерге өз алқаптарының өнімділік әлеуетіндегі кеңістіктік өзгергіштікті көзбен көруге мүмкіндік береді. Осы карталарды басқару шешімдерін қабылдауда пайдалана отырып, фермерлер ресурстарды оңтайлы пайдаланып, жалпы егін өнімділігін арттырып, ауыл шаруашылық қызметінің экологиялық әсерін азайта алады.

Алаңдық потенциал карталары мен өнімділік деректерінің арасындағы айырмашылық

Алаңдық потенциал карталары мен өнім деректері дәл ауыл шаруашылығында фермерлерге өз алқаптарының кеңістіктік өзгергіштігін түсінуге және ақпаратқа негізделген басқару шешімдерін қабылдауға көмектеседі. Алайда, олардың арасында бірнеше негізгі айырмашылықтар бар:

Дереккөздер:

Бұл карталар топырақтың қасиеттері, топография, тарихи өнімділік деректері, қашықтықтан зондтау деректері және климаттық деректер сияқты әртүрлі дереккөздердің мәліметтерін біріктіру арқылы жасалады. Алайда бұл деректер жинау өнімділік мониторлары арқылы жүзеге асырылады, олар өнімді жинау кезінде дақылдың өнімділігін тіркейді.

Уақыттық аспект:

Бұл карталар даланың әлеуетті өнімділігін бағалауды көрсетеді, ол топырақтың қасиеттеріндегі немесе басқа да әсер ететін факторлардағы елеулі өзгерістер болмаса, әдетте статикалық немесе уақыт өте баяу өзгереді. Алайда өнім деректері нақты бір өсіру маусымына немесе бірнеше маусымға тән болып келеді және ауа райы жағдайы, зиянкестердің қысымы мен басқару тәсілдері сияқты факторларға байланысты жыл сайын айтарлықтай өзгеруі мүмкін.

Қорытындылай келе, дала потенциал карталары мен өнім деректері дәл ауыл шаруашылығында бір-бірін толықтыратын құралдар болып табылады. Бұл карталар даланың әлеуетті өнімділігін бағалауға мүмкіндік беріп, фермерлерге әртүрлі басқару тәсілдерін қажет етуі мүмкін аймақтарды анықтауға көмектеседі. Ал өнім деректері нақты өнім көлемін тіркеп, басқару тәсілдерінің тиімділігін бағалау және болашақ шешімдер қабылдау үшін пайдаланылуы мүмкін.

Деректер қабаттарының қиылысуымен автоматтандырылған дақылдарды бақылау

GeoPard-та бізде модуль бар Егін дақылдары бойынша барлау аймақтарын автоматты түрде жасау Бизнес және агрономиялық логиканың икемді конфигурациясын пайдалана отырып.

Бұл үлкен көлемдегі далаларды бақылауға және тек төтенше жағдай болған кезде ғана барлау жүргізуге мүмкіндік береді.

Бизнес/агрономиялық логика икемді болуы мүмкін. Бұл мысалда – соңғы спутниктік суреттерде тарихи жоғары дала әлеуеті аймақтары мен төмен өсімдік жамылғысы бар жерлерде тапсырмалар жасалады.

Тағы бір қолдану жағдайының мысалы: өнімділік файлынан алынған төмен өнімділік аймағын төмен pH аймақтарымен қиылыстыру – әктің құнарлылық деңгейін реттеу үшін.


Деректер қабаттарының қиылысуы арқылы автоматтандырылған дақылдар бойынша мәліметтерді скауттау аймақтары
Жоғары тарихи дала өнімділігі аймақтары соңғы Planet суретіндегі төмен өсімдіктілік аймақтарымен қиылысқанда -> GeoPard-та барлау тапсырмалары автоматты түрде жасалады

Егін саудасымен айналысатын компаниялар мен деректер модельдеушілер үшін тарихи тұрғыдан ең тұрақты және жоғары өнімді аймақтардың қиылысуы өнім болжамдарын экстраполяциялау үшін жақсы көрсеткіш болуы мүмкін.

Егер сіз фермер, агроном немесе дәл ауылшаруашылығы маманы болсаңыз, дақылдар деректерін бақылаудың маңыздылығын жақсы білесіз. Бұл дақылдарыңыздың денсаулығын қадағалауға және ықтимал мәселелерді ірі ақауларға айналмай тұрып анықтауға өте маңызды.

Дегенмен, дәстүрлі дақылдарды бақылау көп уақытты және еңбекті қажет етеді. Міне, дәл осы жерде автоматтандырылған бақылау тапсырмалары көмектеседі.

GeoPard – бұл озық алгоритмдер мен спутниктік суреттерді пайдалана отырып, дақылдарыңызды автоматты түрде бақылайтын революциялық автоматтандырылған дәл ауылшаруашылық бағдарламасы. GeoPard көмегімен зиянкестер, аурулар немесе қоректік заттардың тапшылығы сияқты кез келген ықтимал мәселелер туралы сізді ескертетін автоматтандырылған бақылау тапсырмаларын оңай орнатуға болады.

Автоматтандырылған барлау тапсырмаларын пайдаланудың негізгі артықшылықтарының бірі – дақылдарыңыздағы мәселелерді жылдам әрі дәл анықтау мүмкіндігі. GeoPard озық алгоритмдерді қолдана отырып, егістеріңіздің спутниктік суреттерін талдап, дақылдарыңыздағы ең ұсақ өзгерістерді де анықтайды.

Бұл сізге кез келген ықтимал мәселелерді тез анықтап, олар ауыр зардаптарға ұрынбай тұрып шешім қабылдауға мүмкіндік береді.

Автоматтандырылған барлау тапсырмаларының тағы бір артықшылығы – дақылдарыңызды үнемі бақылау мүмкіндігі. Дәстүрлі барлау кезінде алқаптарыңызға үнемі барып, ықтимал мәселелерді анықтау қиынға соғуы мүмкін.

Ал GeoPard көмегімен сіз дақылдарыңызды күнделікті немесе апта сайын бақылайтын автоматтандырылған тапсырмаларды орнатып, олардың денсаулығы туралы толық әрі жан-жақты көзқарас ала аласыз.

GeoPard-тың автоматтандырылған барлау тапсырмаларын да өз қажеттіліктеріңізге қарай баптауға болады. Сіз зиянкестер немесе аурулар сияқты нақты мәселелерді бақылауға арналған тапсырмаларды немесе егіс алқабыңыздың белгілі бір аймақтарын бақылауға арналған тапсырмаларды орната аласыз. Бұл сізге дақылдарыңызға қатысты ақпаратқа негізделген шешімдер қабылдауға қажетті мәліметтерді алуға мүмкіндік береді.

Автоматтандырылған барлау тапсырмаларынан басқа, GeoPard дәл ауылшаруашылық операцияларыңызды басқаруға көмектесетін басқа да бірқатар мүмкіндіктерді ұсынады. GeoPard-ты егіс егу мен тыңайтуды жоспарлау, топырақтың ылғалдылық деңгейін бақылау және өнімділікті қадағалау үшін пайдалануға болады.

Жалпы алғанда, GeoPard-тың автоматтандырылған барлау тапсырмалары фермерлерге, агрономдарға және дәл ауыл шаруашылығы мамандарына арналған қуатты құрал болып табылады. GeoPard арқылы өсіріліп жатқан дақылдарыңызды тез әрі оңай бақылап, ықтимал мәселелерді анықтай аласыз, бұл сізге операцияларыңызға қатысты жақсырақ шешім қабылдауға көмектеседі.

Егін бақылау деген не?

Егін бақылау – ауыл шаруашылығында дақылдардың денсаулығын, өсуін және ықтимал мәселелерін бағалау мақсатында жүйелі түрде тексеру мен бақылау жүргізу тәжірибесі. Әдетте бұл дала бойымен жаяу жүріп өтуді немесе ұшқышсыз ұшу аппараттары мен сенсорлар сияқты технологияларды пайдаланып деректер жинауды қамтиды.

Егін бақылаушылары зиянкестердің шабуылдары, аурулардың өршуі, қоректік заттардың тапшылығы және арамшөптердің қысымы сияқты факторларды бақылап, ақпарат жинайды.

Бұл деректер фермерлерге дақылдарды басқару бойынша ақпаратқа негізделген шешімдер қабылдауға көмектеседі, мысалы мақсатты өңдеулер жүргізу, тыңайтқыш қолдануды реттеу немесе зиянкестерге қарсы стратегияларды іске асыру. Ол дақылдардың өнімділігін барынша арттыруда және жалпы дақылдардың денсаулығын қамтамасыз етуде маңызды рөл атқарады.

Автоматтандырылған дақылдар деректері бойынша скаутинг дегеніміз не?

Автоматтандырылған дақылдарды бақылау – ауылшаруашылық ортада дақылдардың денсаулығы мен дамуын бақылау және бағалау үшін робототехника, ұшқышсыз ұшу аппараттары (UAV), әртүрлі сенсорлар және жасанды интеллект (AI) сияқты озық технологияларды қолдануды білдіреді.

Мақсат – адам егін барлаушылары дәстүрлі түрде атқаратын тапсырмаларды автоматтандыру арқылы тиімділікті арттыру, шығындарды азайту және дақылдарды басқаруды оңтайландыру.

Өсімдік дақылдарының деректерін автоматтандырылған бақылау процесі бірнеше кезеңнен тұрады, мысалы:

  • Деректерді жинау: Бейпілоттық ұшу аппараттары немесе жер үсті роботтары әртүрлі сенсорлармен (мысалы, камералар, көпспектрлі сенсорлар, LIDAR) жабдықталып, өсімдіктердің жағдайы туралы ақпарат жинайды: өсімдіктердің денсаулығы, зиянкестер мен аурулардың таралуы, топырақтың қасиеттері және қоректік заттардың концентрациясы.
  • Деректерді талдауЖиналған деректер кейіннен өсімдіктердің денсаулығы мен дамуына қатысты үлгілерді, бұзылуларды және тенденцияларды анықтау үшін жасанды интеллект пен машинамен оқыту алгоритмдері арқылы өңделіп, зерттеледі.
  • Шешім қабылдау: Деректерді талдау нәтижелерін дақылдарды басқару бойынша ақпаратқа негізделген шешімдер қабылдау үшін пайдалануға болады, соның ішінде суаруды, тыңайтуды, зиянкестермен күресті және басқа да шараларды оңтайландыру.
  • Іс-қимыл жасау: Ауыл шаруашылығындағы фермерлер автоматтандырылған дақылдарды бақылаудан алынған білімге сүйене отырып, даладағы нақты мәселелерді шешу үшін мақсатты шараларды жүзеге асыра алады, мысалы пестицидтерді немесе қоректік заттарды тек қажет жерлерге қолдану, қалдықтар мен экологиялық әсерді азайту.

Шаруаларға нақты уақыттағы дәл мәліметтерді ұсыну арқылы ауыл шаруашылығының өнімділігі мен тұрақтылығын айтарлықтай арттыруға, жақсы шешім қабылдауға және дәлірек басқару әдістерін қолдануға мүмкіндік береді.

Байқау аймағын қалай анықтауға болады?

Егін даласын барлау аймақтарына бөлу топырақ құрамы, рельеф, тарихи егін нәтижелері немесе басқа да маңызды факторларға негізделген шағын, басқаруға ыңғайлы бөлімдерге бөлуді қамтиды.

Мақсаты – ұқсас жағдайларды көрсететін біркелкі аймақтарды анықтап, дақылдарды бақылау, байқау және басқару әдістерін дәлірек жүргізуге мүмкіндік беру. Міне, дақылдарды бақылау аймағын дәл анықтауға арналған қадам-қадам әдіс:

  • Тарихи ақпаратты жинаңыз: Алдын ала дақылдардың өнімділігі, топырақ талдау нәтижелері, зиянкестер мен аурулардың кездесуі және алқапқа қатысты кез келген басқа маңызды ақпарат бойынша деректерді жинақтаңыз. Бұл деректер ұқсас жағдайлары немесе көрсеткіштері бар аймақтарды анықтауға көмектеседі.
  • Топырақтың құрамын және рельефін зерттеңіз: Табиғи ауытқуларды түсіну үшін егіс алқабыңыздағы топырақ түрлері мен рельефін зерттеңіз. Әртүрлі топырақ құрамы мен биіктік деңгейлері дақылдардың өсуіне, қоректік заттарды сіңіруіне және су қолжетімділігіне әсер етіп, бұл өз кезегінде дақылдардың денсаулығына ықпал етеді.
  • Қашықтықтан зондтау технологиясын пайдаланыңыз: Жер бедерін, өсімдік индекстерін, топырақтың ылғалдылық деңгейін және температуралық ауытқуларды анықтау үшін спутниктік немесе дрондар арқылы алынған суреттерді пайдаланыңыз. Бұл ақпарат даланың жан-жақты көрінісін қамтамасыз етіп, барлау аймақтарын дәлірек анықтауға көмектеседі.
  • Дәл ауылшаруашылық әдістерін енгізу: Жиналған деректерді өңдеу және талдау үшін дәл ауылшаруашылық бағдарламасын пайдаланыңыз. Бұл құралдар дақылдардың денсаулығы, топырақтың өзгергіштігі және рельеф сияқты факторларды ескере отырып, үлгілерді анықтауға және деректерге негізделген бақылау аймақтарын белгілеуге көмектеседі.
  • Байқау аймақтарын белгілеуДеректерді талдау негізінде өрісті ұқсас сипаттар көрсететін кішігірім, біркелкі аймақтарға бөліңіз. Бұл аймақтар көлемі бойынша басқаруға ыңғайлы және сіздің операцияларыңыздың нақты талаптарына сәйкес бейімделген болуы тиіс.
  • Үнемі жаңартып, түзетіп отырыңыз: Жағдайлар өзгеріп, жаңа деректер қолжетімді болған сайын барлау аймақтарын қайта бағалап, қажетіне қарай түзетіп отырыңыз, олардың өзектілігі мен дәлдігін сақтау үшін. Бұл жаңа өнімділік деректері, зиянкестер мен аурулардың кездесуі немесе дақыл өнімділігіне әсер ететін басқа да факторларға сүйене отырып аймақтарды жаңартуды қамтуы мүмкін.

Сондықтан дақылдарды бақылау аймағын анықтап, құру арқылы фермерлер бақылау шараларын тиімдірек шоғырландырып, мақсатты басқару тәсілдерін қолдана алады, бұл ресурстарды тиімді пайдалануға және дақылдардың денсаулығын жақсартуға мүмкіндік береді.

GeoPard жүйесінде деректер мен аналитиканы беріңіз

In this article:

  • Using yield analytics in precision agriculture
  • In-depth yield data analytics in GeoPard Agriculture 
  • Visualization of each attribute in Yield files
  • Correction of raw yield data 
  • 5 Practical examples of usage of yield maps
Raw and cleaned yield data in GeoPard

Өнім деректері allows you to make more informed decisions and improve growing efficiency.
Field management zones constructed from multiple years of yield data are suitable for an initial assessment of potential yield and soil nutrient variability to make future crop management decisions.

Analysis of yield data can be converted to a variable rate application map and used, for example, for fertilizer application. Its calibration is another topic you need to consider, we will cover it in a separate blog post.

The advanced analytics in GeoPard is that you can perform multi-layer analysis by combining multiple layers of data into one map and looking for relationships between the data layers. 

Combined productivity zones can be generated based on vegetation indices from satellite imagery, topography, data from machinery such as yield, electrical conductivity, soil moisture, and others, as well as agrochemical analysis results.

Visualization of yield files is done automatically after downloading the file, it’s automatic processing and cleaning. Two versions of maps are shown below – the original image with data from the equipment monitor as is, and the GeoPard visualization.

The raw data has been converted into a gradient continuous surface image, for an easier understanding of the field heterogeneity and for creating management zones.

Each of the attributes of the yield file is available for visualization, such as moisture, yield mass, yield volume wet and dry, downforce, fuel consumption, machine speed, and so on.

Raw data correction means that if a point in the field is unnatural, it will be smoothed (for example, working over not the full width of the combine header). When creating Zones-based yield data, you can correct individual zones and polygons. 

Let’s take a look at some practical examples of using yield maps and other GeoPard data layers.

1. Management zones based on yield data. Management zones can be constructed based on either one year’s yield data or multiple years. It is important to note that you cannot directly stack yields from different years, as you will get a bias in favor of one of the years.

To reduce this effect, GeoPard applies several algorithms to make the weight of each year even.  You can set the importance of a single year through the Weight tool when you create a Multi-layer map.

Such field management zones can be used to build application/prescription/Rx (VRA) maps, calculating the potential yield in each zone.

Multi-year and multi-layer yield potential map

2. Multi-layer zones with yield data and other data sources (topography, soil, sensor, satellite). It can be added to multilayer analytics and set the weight it will have on the final zones.

In this example, three layers of data are added to the map: Yield, Satellite imagery, and Topography. You can combine any data layers you consider relevant for analytics. The multi-layer map can be used for further yield analytics and for creating VRA maps. 

Yield, Topography and Satellite imagery
Multi-layer zones: Yield, Topography and Satellite imagery

3. Yield calculation on zone and field level. To analyze different treatments, seed varieties, and agronomic practices you probably want to compare the average and total yield in each zone, strip, or between fields.

GeoPard automatically calculates this for you to make it easier to compare yield in absolute numbers. 

GeoPard calculates yield in abs numbers based on Yield files. Total and average for field and each zone

4. Dependency zones based on yield data. Zones based on yield data can be overlaid on other data zones and you can search for dependencies between data layers. This example shows the overlay of high yield and average protein (1) and low yield and high protein (2) of different wheat varieties in a field.

Other examples include the relationship between the influence of topography on yield, the intersection between low yields, and the lack of macro-and micronutrients in the soil, soil moisture, and electrical conductivity (EC) layers.

Intersections of different yield and protein levels

5. Variable Rate application (VRA) maps based on yield data.  You can create prescription maps for different operations – fertilizing, seeding, spraying, irrigation, and planning of soil sampling. You can edit the number and shape of the zones.

You can also build a prescription map for a variable rate application by combining yield data with other data sources (soil, EC, satellite, topography). 

Variable rate Seeding rates per zone
Variable-rate Seeding rates per zone

Even if you do not have yield data, you can use GeoPard multi-year zones (up to 33 years) based on satellite imagery or combine it with other data layers like topography to start your precision agriculture journey. These analyses often correlate with yield analytics data, but this is another story.


Жиі қойылатын сұрақтар


1. How to do yield analysis?

Yield analysis is a process used to assess the productivity and performance of a crop or agricultural system. Here are the steps to conduct a basic yield analysis:

  • Measure the total harvested yield: Collect all the harvested produce from a specific area and weigh it.
  • Determine the area: Measure or calculate the total area of land from which the yield was obtained.
  • Calculate the yield per unit area: Divide the total harvested yield by the area to get the yield per unit area (e.g., yield per hectare).
  • Compare and analyze: Compare the obtained yield with previous years’ data or regional averages to assess the performance and identify any variations or trends.

Yield analysis helps farmers make informed decisions, monitor crop productivity, and identify areas for improvement in their farming practices.

2. What is yield data?

Yield data refers to the information collected and recorded about the amount of crop or agricultural produce obtained from a specific area of land. It includes measurements or estimates of the quantity of harvested yield, usually expressed in terms of weight or volume.

It provides valuable insights into the productivity and performance of crops, helping farmers make informed decisions about their farming practices, assess the effectiveness of different techniques or inputs, and monitor trends or variations in crop yields over time.

3. What is yield potential?

Yield potential refers to the maximum achievable yield or production level of a crop under ideal growing conditions. It represents the upper limit of what a specific crop variety or plant species can yield in terms of quantity and quality.

Yield potential is influenced by various factors such as genetics, environmental conditions, nutrient availability, and management practices. It serves as a benchmark or reference point for farmers and agronomists to evaluate the performance and productivity of different crop varieties and to identify areas where improvements can be made to optimize yield levels.

Дәл ауыл шаруашылығындағы көп қабатты (интеграцияланған) деректерді талдау

Precision agriculture is capable of generating vast amounts of data in the form of yield data, satellite imagery, and soil fertility, among others.

The lack of easy-to-use cloud precision software toolkits that assist crop producers in converting field data layers into useful knowledge and actionable recommendations limits the application of precision agricultural technologies.

In precision agriculture, management zones are areas within a field that have similar yield potential based on soil type, slope position, soil chemistry, microclimate, and/or other factors that influence crop production.

Оның producer’s knowledge of a field is a very important piece of the process. Management zones are thought of as a mechanism to optimize crop inputs and yield potential.

Maps generated with a single data layer and several data layers.

The big challenge is to build management zones that perfectly reflect field variability. A combination of different layers like satellite imagery, soil fertility, topography derivatives, and yield monitor data is the next logical step to generating more responsive management zones.

Multi layer analytics (also known as integrated analysis) is becoming a part of the GeoPard geospatial analytics engine.

Classic combinations of integrated analysis parameters include one or more yield data, NDVI map, elevation, and soil sensor physicochemical characteristics. 

GeoPard supports these parameters and in addition, allows the inclusion of other field data layers either already available in the system or uploaded directly by the user (soil sampling, yield datasets, etc.).

As a result, you are free to operate with the complete set of parameters doing integrated analytics:

Multi layer yield data analytics

Қашықтық зондтау деректері:

  • Potential productivity map (single-year and multi-year)
  • Stability/variation map
  • Vegetation indices NDVI, EVI2, WDRVI, LAI, SAVI, OSAVI, GCI, GNDVI

Topography:

  • Digital elevation
  • Еңіс
  • Curvature
  • Wetness index
  • Hillshades

Soil data:

  • рН
  • CEC (cation exchange capacity)
  • SOM (soil organic matter)
  • K (potassium)
  • Thin topsoil depth, lower available water holding capacity (drought-prone soil)
  • EC (electrical conductivity)
  • and other chemical attributes available in the uploaded dataset

It’s important to emphasize that custom factors are configured on top of every data layer to assign the desired layer weight. You are very welcome to share your integrated analytics use cases, and build management zone maps based on your knowledge of the field while selecting data sources and their weights in GeoPard.

Pictures in this blog contain a sample field with data layers (like a productivity map covering 18 years, digital elevation model, slope, hillshade, 2019 yield data) and various combinations of integration analytics maps. 

You can follow the steps of the evolution of management zones while extending integration analytics with an additional data layer.


Жиі қойылатын сұрақтар


1. What is data layers?

Data layers refer to the individual components or elements of data that are organized and stacked together to create a comprehensive representation of a specific area or subject.

Each layer represents a specific aspect of the data, such as geographical features, land use, population density, or environmental factors. These layers can be combined and analyzed collectively to gain insights, visualize patterns, and make informed decisions.

Data layers are commonly used in geographic information systems (GIS) and spatial analysis to better understand and represent complex data in a visual and interpretable manner.

2. What is integrated analysis?

Integrated analysis refers to the process of combining and analyzing data from multiple sources or disciplines to gain a more comprehensive and holistic understanding of a particular problem or phenomenon.

It involves merging data sets, applying statistical techniques, and exploring relationships across different variables or domains.

Integrated analysis allows for a more nuanced and interconnected view of complex systems, facilitating the identification of patterns, trends, and causal relationships that may not be evident when analyzing data in isolation.

This approach enables researchers and decision-makers to make more informed and effective decisions based on a broader range of information.

wpChatIcon
wpChatIcon

    Тегін GeoPard демосын/кеңес беруді сұраңыз


    Батырманы басу арқылы сіз біздің келісесіз Жеке деректерді қорғау саясаты. Сіздің өтінішіңізге жауап беру үшін ол қажет.

      Жазылу


      Батырманы басу арқылы сіз біздің келісесіз Жеке деректерді қорғау саясаты

        Бізге ақпарат жіберіңіз


        Батырманы басу арқылы сіз біздің келісесіз Жеке деректерді қорғау саясаты