Soil sampling is used in many fields, including construction. For example, before building foundations engineers use heavy drill rigs to bore soil cores and test ground stability (as shown above). Collecting soil cores on a construction site or environmental cleanup project helps engineers and regulators detect contamination (like heavy metals or hydrocarbons) and assess ground conditions.
What Is Soil Sampling?
Soil sampling means taking small samples of soil from a field or site and sending them to a lab for analysis. This process reveals the soil’s health and fertility by measuring nutrients (like nitrogen, phosphorus, potassium), pH, organic matter, and other properties.
Well-conducted sampling helps farmers and land managers make better decisions: they can match fertilizer to actual needs, avoid wasting inputs, and protect the environment. For example, a survey of U.S. corn and soybean farmers found that most used grid soil sampling as part of their nutrient management.
Notably, 67% of those farmers reported higher yields and a $24/acre reduction in corn production costs after adopting soil-sampling-driven management. In short, soil sampling provides a “snapshot” of field fertility and soil health, guiding sustainable land management and increased productivity.
In agriculture, similar soil samples ensure crops get the right nutrients. Overall, the key goals of soil sampling are clear: fertility assessment (to guide fertilization), contamination detection (to ensure safety), research, and planning construction or land use. By defining clear objectives and carefully sampling, we get reliable data that underpins good decisions and sustainable soil use.

Pre-Sampling Planning
As of 2025, over 80% of precision agriculture operations globally use pre-sampling planning with GIS, satellite imagery, and historical crop data. Pre-sampling planning ensures that the collected soil samples represent the field accurately, saving money and improving decisions.
Fields that undergo proper zoning and planning before sampling show up to 25% higher fertilizer efficiency. This stage is critical for tailoring the sampling method to the objective, whether for farming, environmental studies, or construction.
Before heading to the field, thorough planning is essential. Start by defining the goal: are you sampling for farm nutrient management, environmental cleanup, or construction? For example, an agricultural soil survey might focus on fertility and organic matter, while an environmental assessment might target lead or pesticide residues. Review site history to catch clues: soils “have a long memory.”
An Iowa State extension article notes that old manure storage or feedlots can leave “hot spots” of phosphorus or potassium near barns. Satellite imagery and historical aerial photos are useful: free resources like Google Earth or the USDA’s aerial imagery archives let you see past field layouts. In fact, Iowa’s extension suggests using historic imagery (back to the 1930s) to spot past field uses that explain soil test results.
Map the area first. Use topographic or soil-survey maps to note major soil changes or slopes. Modern tools like GIS and GPS are invaluable. For instance, zone sampling (a precision-agriculture method) uses layers of data – soil type, past yields, management history – to split a field into zones of similar fertility.

Satellite or drone images of vegetation can also hint at variations. The upshot: identify distinct zones or uniform areas so each soil sample represents a meaningful portion of the land. Planning pays off by ensuring samples truly reflect field variability, not random guesswork.
Key tools for planning include field maps or GPS units to mark sample spots, plus any records of previous soil tests or land use. Knowing exactly where each sample comes from (with GPS coordinates or detailed sketch maps) is critical later for labeling and analysis. By delineating zones or grids ahead of time, you can decide how many samples to take and where. Remember: sampling is only useful if it matches your management goals and covers known field differences.
Essential Tools & Equipments
In 2024, over 90% of professional agronomists and large-scale farmers in North America used stainless-steel soil probes and GPS-tagged sampling kits to ensure data quality. Precision tools reduce contamination risks and provide high repeatability. Digital soil testing devices are growing in popularity, but traditional augers, clean buckets, and composite sample bags remain the global standard.
1. Soil probes and augers are the core tools for sampling. These hand-held or machine-driven devices bore into the ground to extract a cylindrical soil core. Common types include hand augers, push probes, or power augers. In general, use stainless steel or clean-plastic tools to avoid contamination.
2. Buckets and bags: Carry a clean plastic bucket to mix cores, and plastic sample bags to hold the final sample. (Plastic is preferred especially if you’re testing for elements like zinc, which metal can contaminate.) Each new sample zone needs its own bucket – do not mix buckets between fields or locations.
3. Sample containers: Use thick plastic or polyethylene bags that seal well. Label each bag with waterproof ink or stickers. GPS or map: Bring a GPS device or printed field map to mark where each sample was taken. Field notebook/labels: Carry waterproof labels or a notebook to write down each sample ID, date, location, depth, and any notes.
4. Clear labeling (site, date, sampler initials) is vital for later analysis and for any regulatory records. Coolers/ice packs: If you can’t ship samples immediately, keep them cool. Chilling samples to about 4°C slows biological changes. (For volatile contaminants, experts recommend sealing cores in a bag with no air and keeping them on ice until sent to the lab.)
5. Finally, contamination-prevention supplies: bring extra zip bags or buckets so tools can be cleaned between sites. Good practice is to decontaminate tools (rinse with water and detergent) between fields, and avoid touching sample soil with bare hands. Keeping tools and containers clean prevents one-sample contamination from skewing results.
Soil Sampling Techniques
According to 2025 global agriculture reports, zone sampling is now used on over 60% of large farms, while grid sampling is preferred for high-resolution soil fertility maps. Consistent sampling depths and good patterns can improve soil test reliability by over 40%. Advances in satellite mapping and variable-rate fertilization rely heavily on precision sampling strategies.
To get meaningful data, choose a sampling pattern and depth that fit your objectives. There are three basic pattern strategies: random, grid, or zone sampling.
1. Random (composite) sampling: For a uniform field or when detailed data is not needed, you can take random cores from across the area and mix them. This gives one average sample for the whole field. However, it may miss variability, so it’s less precise.
2. Grid sampling: Overlay a regular grid (for example, 2.5-acre or 1.0-hectare cells) on the field. At each grid point, take a composite of several cores (often 5–10 cores within an 8–10 ft radius). This creates many smaller-area samples that reveal how fertility varies across the field. Proper grid sampling makes it possible to identify variation within a field and is a foundation of precision agriculture.
3. Zone sampling: If you already know parts of the field behave differently (due to soil type, past management, terrain, or yield history), divide the field into a few “management zones.” Sample each zone separately by taking a composite from it. Zone sampling uses existing knowledge – like soil maps or yield data – to draw boundaries.
This can cut down sampling (fewer samples than a fine grid) while still capturing key differences. In practice, each zone might be sampled with 10–15 cores in a zig-zag (M- or W-shaped) pattern. Georeferencing (recording GPS points of sample spots) lets you revisit or adjust zones in future sampling seasons.

Sampling depth: The soil depth you sample depends on the test. For general fertility tests (nutrients and pH for crops), the typical depth is about 6 inches (15 cm) in tillage systems. This is because plant roots mostly exploit the topsoil, and calibration data (fertilizer recommendations) assume that depth.
Subsoil tests (for leaching or deep nutrients) may sample deeper, often 6–24 inches (15–60 cm). And if you’re checking for buried contaminants, you may need layers of soil at multiple depths. The key rule: be consistent and target the zone of interest. Shallow sampling (less than intended) can falsely show high nutrient levels, since nutrients concentrate near the surface.
Composite sampling: In each sampling area (grid cell or zone), collect multiple subsamples and combine them. A standard practice is 10–15 cores per composite sample. Take cores from a representative pattern – for instance, scattered evenly or in an “M” or “W” shape across the area.
Put all the cores in the bucket and thoroughly mix them. This composite better represents the whole area than any single point. While mixing, watch out for outliers: if one core looks very different (darker color, very wet/dry, or contaminated by recent spill), discard it. Removing such anomalies keeps the sample representative.
Step-by-Step Soil Sampling Procedure
Recent field surveys in 2024 found that 42% of sampling errors occurred due to skipped or misapplied steps in the sampling procedure. Proper step-by-step procedures can improve soil data accuracy by over 35%. Experts recommend using field checklists to maintain consistency and reduce oversight during collection.
i. Clear the surface. Remove debris, vegetation, or large rocks where you plan to take cores. For example, clear plant litter or manure piles so the sample is true soil.
ii. Extract cores at a consistent depth. Using your auger or probe, drill into the soil to the target depth. Push or twist the probe straight down and remove the core. Repeat this at 10–15 locations within the area you’re sampling. For fertilizer tests, all cores should reach the same depth (e.g. 6 inches). If you’re sampling deeper for nitrates or contaminants, use a deeper probe or power auger.

iii. Place cores in a clean bucket and mix. Dump each core into your bucket as you go. After collecting all subsamples for that area, stir the bucket contents thoroughly until uniform. This mixing ensures an even composite.
iv. Take the composite subsample for the lab. From the well-mixed bucket, scoop out the recommended amount of soil (often 1–2 pounds or about 0.5–1 kg) into a labeled sample bag. This is the sample you’ll send to the lab. It represents the average conditions of that field area.
v. Label each sample immediately. Every bag should be clearly marked with an ID number or code, GPS location or field name, depth of sampling, and date. Lab instructions stress labeling with site name, date/time, and sampler initials.
vi. Store or ship properly. If samples can’t go to the lab right away, keep them cool (refrigerate or place in a cooler with ice packs). Chilling to about 4°C slows microbial and chemical changes in the soil. Try to get them to the lab within 24–48 hours.
Soil Sample Handling & Documentation
A 2024 audit of lab soil submissions found that 1 in 5 samples arrived with incorrect or missing labels, leading to delays or rejection. Proper handling and documentation not only maintain sample integrity but also ensure legal and scientific accuracy, especially in regulated industries.
After collecting samples, handle them carefully to avoid mix-ups or contamination. Always use clean gloves when handling soil after extraction – this prevents oils or chemicals from contaminating the sample. Between sampling locations, clean your tools and bucket (soap and water rinse) to prevent carryover of soil.
Document everything. In your field notes (or digital logs), record the GPS coordinates of each sample location, field or site descriptions, cropping history, and any observations (odors, visible contamination, color changes). Note what crop is currently grown or intended, since nutrient needs depend on the crop.
For environmental sampling, note any nearby potential sources of pollution (like an old factory or pesticide storage). All this metadata should accompany the sample to the lab. A good record might read: “Sample 5: Cornfield Zone A, sandy loam with manure history, sampled 0–6″ depth, Aug 3, 2025, composite of 12 cores.”
If the samples are for regulatory or compliance testing (such as EPA soil tests), use a chain-of-custody form. Include the project name, sample IDs, collection dates and times, and analytes required.
This ensures the lab can trace who collected the sample, how it was handled, and meet any quality requirements. Proper documentation – labels, notebooks, and COC forms – ensures the lab can match results to the right field, making your soil data reliable and defensible.
Laboratory Analysis & Interpretation
As of 2025, over 75% of U.S. farmers rely on laboratory soil analysis at least once every three years, with a growing trend toward annual sampling in precision agriculture. The most common tests include pH, NPK, organic matter, and CEC.
Proper interpretation of these results has led to a 20–30% reduction in fertilizer waste in many regions. Once in the lab, the soil samples are analyzed for the requested tests.
Standard fertility tests usually measure:
- Soil pH and acidity – key for liming decisions.
- Major nutrients: phosphorus (P), potassium (K), and often nitrogen (N).
- Secondary nutrients: calcium, magnesium, sulfur.
- Micronutrients: iron, manganese, zinc, boron, copper, etc.
- Organic matter content – indicates long-term fertility and soil health.
- Cation Exchange Capacity (CEC) – soil’s capacity to hold and exchange nutrient ions.
Specialty analyses might be ordered if needed:
- Heavy metals like lead, arsenic, cadmium, and chromium.
- Pesticides or organics if there’s potential contamination.
- Microbial tests to assess biomass or pathogens.
- Texture and CEC analysis for sand/silt/clay ratios.
When lab reports come back, interpreting them is the next step. Each lab report will list the test values along with either reference guidelines or a rating. For agronomic tests, compare nutrient levels to regional recommendations. For contaminants, use health-based guidelines. Knowing whether a result is above or below an acceptable threshold is crucial. In all cases, ensure you or the agronomist know which test method the lab used, as units and interpretations can vary by method.
Common Errors to Avoid During Soil Sampling
According to field research in 2024, incorrect sampling depth and tool contamination are the two most common errors in soil sampling, together accounting for nearly 60% of test inaccuracies.
Avoiding these simple mistakes can greatly improve the reliability of lab results and prevent costly misinterpretation. Accurate sampling requires consistency and care. Be aware of these common mistakes:
- Inconsistent depth: Taking some cores too shallow or too deep skews results. Always use your depth marker and train anyone helping you.
- Dirty tools or containers: Contaminated tools can spoil the sample. Always clean them between sites.
- Poor mixing: Failing to mix subsamples thoroughly means the sample isn’t representative.
- Labeling mistakes: Unlabeled or mislabeled bags are useless. Label them immediately during collection.
- Delays and storage: Letting samples sit in the sun or a hot car can alter pH or nitrogen levels.
- Combining dissimilar areas: Don’t mix soil from different zones into one sample; keep zones separate for accurate data.
Avoiding these errors is mostly a matter of following protocol carefully. Training samplers and having a checklist ensures reliable data.
Role Of GeoPard In Soil Sampling Planning
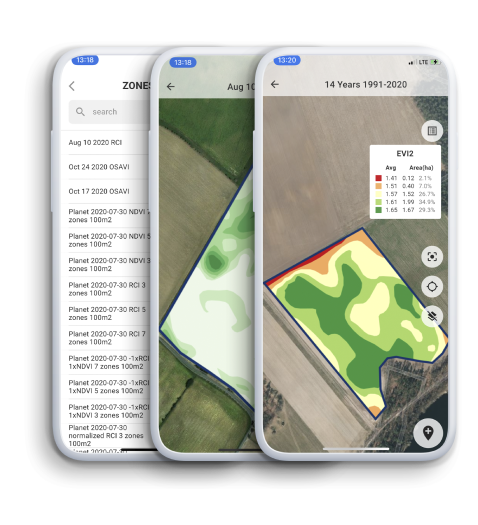
GeoPard Agriculture provides advanced tools for precise soil sampling and analysis. It helps users plan sampling locations based on multi-year satellite imagery and historical crop performance, allowing sampling to target real in-field variability. GeoPard supports both zone-based sampling (using management zones defined by soil type, yield, or vegetation data) and grid-based sampling (typically 1 to 2.5-acre grids for uniform coverage).
After sampling, users can upload lab results directly into the platform. GeoPard visualizes each soil attribute—such as pH, nitrogen (N), phosphorus (P), potassium (K), organic matter, and cation exchange capacity (CEC)—as high-resolution heatmaps. This makes it easy to spot nutrient imbalances.
Users can overlay soil maps with other data layers (NDVI, topography, historic yield) to refine management zones. GeoPard also creates Variable Rate Application (VRA) prescription maps, allowing optimized fertilizer use by zone. These tools support better soil fertility decisions, reduce input costs, and improve yield potential.
Advanced Applications For Soil Sampling
By 2025, over 45% of large farms and agri-businesses are integrating soil test data with GPS and drone imagery for variable-rate applications. Time-series sampling, in combination with AI tools, is also being used to model fertility trends and climate impacts on soil health.
A. Precision Agriculture Integration
Soil sampling today is more high-tech than ever. In precision agriculture, GPS-guided samplers collect location-stamped cores. These georeferenced soil data feed variable-rate fertilizer equipment. For instance, software can use soil test maps to prescribe more fertilizer in low-nutrient zones and less where fertility is high. Modern tractors can apply lime or fertilizer at variable rates based on these soil test maps.

Technologies such as variable rate fertilizer applications and yield monitoring, though available since the 1990s, are seeing increasing adoption. In 2023, 27% of U.S. farms or ranches utilized precision agriculture practices, with adoption rates increasing sharply with farm size; for instance, 70% of large-scale crop-producing farms used guidance autosteering systems.
The benefits are substantial: farmers can reduce water and fertilizer use by at least 20-40% with no adverse impact on yields, and in some cases, even achieve increased yields. This translates to increased profits for farmers and significant environmental benefits, including reduced nutrient runoff and improved water quality, which are major factors contributing to water pollution and coastal dead zones.
Advanced soil mapping technologies like EarthOptics, for example, have mapped over five million acres of farmland and rangeland, providing high-resolution insights into soil compaction, moisture levels, and organic matter distribution. Their technologies aim to reduce customer costs by minimizing required sampling and unlocking new value from the soil, such as improved yields or verified carbon sequestration.
This integration of soil sampling with precision agriculture exemplifies how detailed, localized soil knowledge enables optimized interventions, moving beyond broad-brush approaches to achieve both productivity and environmental stewardship.
B. Time-Series And Regulatory Compliance
Some advanced operations repeat soil sampling annually or seasonally to build a time-series dataset. Tracking soil test trends over time reveals whether fertility is improving or declining. Most guidelines recommend baseline sampling every 3–4 years, but some intensive systems sample yearly to monitor changes.
Digital tools even allow farmers to overlay successive soil maps to see how fields evolve. For instance, if soil pH consistently falls to 5.5, nitrogen and potassium availability can drop to 77%, potentially reducing wheat yields by as much as 25%. Regular monitoring allows for timely corrective measures.
For regulatory compliance and research, soil sampling follows strict standards. Agencies like the EPA and ISO have detailed procedures that specify equipment, preservation, and quality control. In contaminated-site work, sampling plans often require duplicates, blanks, and chain-of-custody documentation. Being aware of relevant regulations and laboratory accreditation ensures the samples will be accepted in legal or certification contexts.
Finally, emerging science is expanding soil sampling’s role. Scientists sample soil more deeply to study carbon storage and greenhouse gas flux. Some sample microbial communities or enzyme activities as new “soil health” indicators. Others are exploring drone-mounted sensors that “sample” via spectral measurements. While these advanced topics go beyond basic sampling, the core principle remains: sound sampling yields reliable, actionable data.
Conclusion
Soil sampling is a powerful tool for sustainable land management. By carefully planning where and how to sample, using the right tools (soil augers, buckets, GPS), and following a consistent procedure, you obtain soil data you can trust. Key steps – collecting uniform-depth cores, compositing and mixing them, labeling properly, and keeping samples clean – ensure accuracy.
Equally important is matching the sampling strategy to your goal, whether that’s fertility mapping, pollution check, or building design. A goal-driven approach, with proper documentation (location, depth, date, chain-of-custody), makes the resulting soil analyses meaningful.
In turn, reliable soil data leads to better decisions: optimized fertilizer use, safer construction, and healthier ecosystems. By avoiding common pitfalls and embracing best practices, soil sampling becomes the foundation of effective soil management and productive land use.
Remote Sensing