Composite soil sampling means taking many small soil cores from across a field and mixing them into one sample. This single composite sample provides average soil test values (nutrients, pH, etc.) for that entire area. Traditionally, farmers have used composite sampling to determine uniform fertilizer or lime rates for a whole field.
Recent advances in precision agriculture (PA) and remote sensing (RS) are changing how we do soil sampling. Today’s tools (GPS-guided equipment, satellite/drone imagery, yield maps, and soil sensors) allow farmers to “see” differences within a field and create more tailored sampling zones.
Instead of “one field – one sample,” PA encourages “many zones – many samples,” each averaged separately. In short, composite sampling remains a key part of soil testing, but PA/RS data help define where those composites should be taken and how their results are used. For example, 68% of large U.S. crop farms now use yield monitors or soil-mapping tools, reflecting how common precision data have become.
What Is Composite Soil Sampling?
Composite sampling combines sub-samples from many spots into one mixed sample. For instance, to sample a 10-acre zone, you might take 15–20 small cores (each a few inches deep) at various points, mix them, and send the mixture to the lab. The lab analyzes this one composite soil to give an average test value for the whole zone.

This contrasts with discrete (individual) samples, where each core is tested separately. Composite sampling is often done when an area seems fairly uniform and a general fertility level is needed. In the U.S., over 70% of commercial farms report using some form of soil testing, and composite sampling remains the most common and cost-effective method.
A soil extension bulletin explains: “Soil sampling begins with a representative composite soil sample”. That composite result guides management (fertilizer, lime, etc.) for the entire area. If conditions really are uniform, one composite per 10–15 acres can suffice. However, that assumes all parts of the zone are similar. However, precision tools help identify where that assumption holds, and where it does not.
When composite samples are taken within well-defined management zones, they lead to better decisions. For example, instead of applying one fertilizer rate to an entire 100-acre field (based on one composite), a farmer might apply one rate to the field’s top third, a different rate to the middle third, and another rate to the bottom third – each guided by that zone’s soil test. This targeted approach can increase yields or save fertilizer (and reduce runoff).
Advantages of Composite Sampling
Globally, fertilizer prices have increased by nearly 80% since 2020, pushing farmers to adopt more cost-efficient soil testing methods. Composite sampling helps reduce testing expenses while still providing valuable insights. A recent U.S. survey shows that more than 60% of mid-sized farms rely on composite soil testing as their primary fertility assessment tool.
1. Cost-effective: Fewer lab tests are needed compared to testing every location. A single composite replaces many individual tests, saving money on analysis.
2. Time-efficient: It is faster to collect and process one mixed sample than dozens of separate samples. This means soil testing can be done more quickly and frequently.
3. Simplicity: Composite sampling requires less planning and data management. For example, large lawns, pastures, or fields with uniform cropping often use simple “one area – one sample” protocols.
4. Suitable for uniform areas: When a zone truly has uniform soil and management, the composite gives a reliable average fertility. Many extension guides note that a “reasonably uniform area” up to 10–15 acres can be well-characterized by one composite.
These benefits have made composite sampling a common practice. One crop consultant notes that GPS grid sampling (using many points) is more detailed and costly, while composite sampling “involves mixing soil from various locations… to create a single sample,” which is simpler. In uniform fields (or lawns, gardens, and research plots), composite tests are a practical way to track nutrients and pH with moderate cost.
Limitations of Composite Sampling
As of 2025, studies show that nearly 45% of sampled agricultural fields exhibit enough spatial variability that composite sampling obscures critical nutrient differences—making precision zone sampling essential. Recent data also reveals a 12% increase in undetected contamination events when using composite methods in variable soils. Despite its convenience, composite sampling has important drawbacks:
a. Masks variability: By averaging many points, composites hide “hot spots” and “cold spots.” For example, a patch with very high phosphorus or a corner with low pH will be diluted into the average. A precision-farming blog warns that composite mixing of different locations “can mask variations in soil nutrients”. In other words, you lose information about where the soil is better or worse than average.

b. Not for small problems: Composite samples are a poor choice if you suspect a localized issue. For example, if a specific spot had a pesticide spill or extreme plant stunting, one composite over the whole field might not detect it. That problem area would be mixed with many normal spots. Extension educators explicitly caution that whole-field (blanket) samples are not recommended for fields with variability.
c. Dilution risk: If a small sub-area is contaminated or highly enriched, its signal can be diluted below detection. This is known as the “nondetectable average” problem: a few cores from a contaminated patch might vanish into the overall sample. That is why composite sampling is often avoided in environmental hazard investigations unless combined with retesting of individual cores.
d. Uniform treatment despite variation: A composite test leads to one recommendation for the entire zone. This can mean over-applying fertilizer on already-rich spots and under-applying where soil was poorer. Over time, this inefficiency can waste inputs and money. As one precision-ag blog notes, composite sampling “may lead to inefficiencies and higher costs over time” because it lacks the detailed information needed for precise management.
Composite sampling is best for areas known to be fairly uniform. However, in highly variable fields, its averaging nature can cause uneven crop response, lower efficiency, and environmental concerns (nutrient runoff).
Planning the Sampling: Zones and Tools
As of mid-2025, modern approaches to soil sampling recommend collecting 15–20 subsamples per sampling area, each composite ideally representing ≤ 2.5 acres in fields with high variability.
Some precision agriculture grids now recommend 1 sample per acre for long-term mapping accuracy, with mobile robotic systems capable of obtaining 50 g soil samples at 200 mm depth, analyzed in ~10 minutes each for real-time nutrient and pH data. Before going into the field, carefully plan where and how you will sample. Key steps include:
1. Define sampling zones: Break the field into sections where soil and history are similar. Use information on soil type, past crop rotations, topography, and management. For example, if part of a field was heavily limed or manured in the past, that area should be sampled separately.
Many guidelines advise sketching a map of uniform areas before sampling. Within each zone, one composite will be taken. If a field is truly uniform, up to 10–15 acres may be covered by one composite; if not, split it. Modern tools can help define zones, too: GIS soil surveys, yield maps, and aerial images often reveal natural divisions in the field.
2. When to split areas: Consider separate composites if you see clear differences in soil color, slope, or management. Typical examples: a low spot vs. a hilltop; a field corner with different irrigation; or former barnyard vs. the rest of the field. Also split by crop zones – e.g. if you planted corn on part and soy on another. Essentially, only mix soil cores that belong to the same general environment.

3. Sampling unit size: Extension sources give guidelines for composite zone size. MSU recommends that each composite sample represent no more than ~10–15 acres in uniform fields. Iowa State says a uniform zone sample should cover about 10 acres max. If you suspect the soil is variable, plan smaller zones (e.g. each 2–5 acres) so that fewer differences are averaged together.
4. Tools and equipment: Gather clean, ready tools. A soil probe or auger is preferred for consistent depth cores. (In very stony fields, a screw-type auger can work better than a push probe.) Also have a clean bucket (plastic is best, especially if testing micronutrients), a sharp clean shovel or trowel, and plenty of sample bags or boxes with labels.
Bring labels, a waterproof marker or pen, and (optionally) a GPS or field map to mark sampling points. Cleanliness is important: scrub or rinse tools if moving between fields to avoid cross-contamination.
Having a plan ahead of time (a map of zones and number of samples) makes the job efficient. For example, you might decide to take one composite per 10-acre zone in each field corner.
Many farmers use GPS units or smartphones to mark sample locations as they go, which aids in future sampling. Modern precision tools (like smartphone apps) can even guide pattern or grid sampling. But even without tech, a simple zigzag or W-pattern walk through each zone works well.
Composite Sampling Procedure (Step by Step)
Soil testing through composite sampling remains the backbone of precision agriculture. Global studies show that using standardized composite sampling can reduce nutrient mismanagement by 20–30%, improve fertilizer efficiency, and increase yield by 5–15% on average.
As farming operations adopt digital tools, composite sampling remains a critical first step in generating reliable lab data for nutrient recommendations. Once zones are defined and tools are ready, follow a consistent procedure. The basic steps are: pattern, depth, collect, mix, subsample, label. Each step ensures the composite is truly representative:
Step 1: Choose a Sampling Pattern
Soil variability within a single field can be significant — recent surveys show nutrient levels may vary up to 40% within the same 10-acre zone. Choosing an effective sampling pattern is therefore essential for accuracy.
To avoid bias, collect subsamples either randomly or systematically within the zone. One simple method is a zigzag or W-pattern: walk across the area in a zigzag, stopping at roughly equal intervals to take a core. This tends to capture the variability evenly.
For large fields, you might overlay a grid (e.g. 2–3 acre squares) and sample at each grid point; this is the classic grid-sampling approach. Alternatively, use a yield map or NDVI map to identify high/medium/low productivity areas (management zones) and sample each separately. In practice, the goal is full coverage without overlap or clustering, so that every part of the zone has a chance to contribute.
Step 2: Determine Sampling Depth
Soil depth affects nutrient availability — studies show that over 70% of plant-available phosphorus and potassium is concentrated in the top 6 inches of soil. Deeper layers hold mobile nutrients like nitrate-N, which leaches more easily.
Take all sub-samples to the same depth, as this affects test results. For most row crops (corn, soybeans, wheat), the standard depth is about 6 inches (0–6″ or 0–15 cm), which aligns with where most roots and nutrients are. For perennial pastures, lawns, or shallow-rooted crops, the 6″ depth is also typical.
In no-till fields, some experts suggest 8 inches because residue slows penetration. If testing for mobile nutrients (especially nitrate-N or salt), take an additional deeper sample from 6–24 inches (as two layers: 0–6″ and 6–24″). Always avoid holes or ravines – sample the plow layer or topsoil.
Step 3: Collect Subsamples (Cores)
On average, 15–20 cores per composite sample reduce sampling error by 90% compared to only 5 cores, according to recent agronomy research. This makes the number of subsamples critical to accuracy.
Using the soil probe (or auger), take one core or slice at each sampling point. Insert the probe vertically and extract the soil core to your chosen depth. Put each core into a clean bucket. Most guidelines recommend 15–25 cores per composite to get a good average. Iowa State suggests 10–15 cores, Michigan State found 20 cores give consistent results.

In practice, 15–20 cores is common. Space the cores evenly (e.g. 1 per 0.5–1 acre in a 10-acre zone) or follow the chosen pattern. Collect all cores from throughout the zone – for example, mid-row and between rows if crops are planted, and from different areas of the zone.
If one core looks very different (e.g. much darker or gravelly), you may discard it and take another, so that the composite isn’t skewed. Wear disposable gloves or rinse the probe if you move between zones to avoid cross-contamination.
Step 4: Create the Composite
Mixing is crucial: studies show that improper mixing can introduce up to 25% variation in lab results, even when sampling was done correctly.
Dump all the subsamples from the bucket onto a clean tarp or inside the bucket and break them up. Mix them thoroughly until the soil is homogeneous. Remove any rocks, roots, or debris during mixing. This step is important: it ensures the final composite sample is truly representative.
You may need to partially air-dry the soil first if it is very wet or clayey (wet clumps don’t mix well), but do so gently. Continue mixing until you have one blended pile or bucket of soil.
Step 5: Prepare the Final Sample
Most soil labs require about 1 pint (0.5–1 kg) of soil — sending more does not improve results but increases handling errors.
From the well-mixed soil, take a subsample to send to the lab. Typically this is about 1 pint (roughly 0.5–1 kg) of soil. Do not send the entire bucket. Instead, spread the mixed soil on a clean surface and use a measuring cup or scoop to collect the lab sample.
Fill the lab’s container or bag about ½ to 1 liter (or as instructed by the lab). This “aliquot” is your composite sample. The lab needs only the small, uniform portion, not all the cores. Seal the bag securely.
Step 6: Label and Record
According to FAO reports, over 30% of soil test errors occur due to mislabeling or poor record keeping — making this step critical for reliable data.
Label the sample container clearly before or immediately after filling it. Include at least: Field or Zone ID (a unique code), date, depth of sample (e.g. 0–6″), previous crop (if relevant), and your name or sampler name. Some people also note the target crop and GPS coordinates.
Writing this information on the bag or box is critical for the lab and for future reference. Keep a record (logbook or digital file) of each sample ID, what zone/field it came from, and any notes (such as “east end of field” or “south of irrigation pipe”). This metadata ensures you can interpret the results correctly and compare future samples.
Each composite sample (with its label) then goes to the lab. Before shipping, make sure it’s dry or lightly dried. (Some labs prefer samples air-dried at room temperature to avoid mold or nutrient loss.) Keep the samples cool and out of direct sun if there is any delay in shipping. If the lab tests for volatile chemicals (rare in agriculture), do not dry the sample. But for standard fertility tests (pH, P, K, micronutrients, organic matter), air drying in open sacks for a day or two is normal practice.
Applications of Composite Sampling
In 2025, over 60 % of large-scale farms worldwide utilize zone-based composite sampling to tailor fertilizer application rates, and grid sampling continues to play a key role in precision agriculture, enabling detailed fertility mapping across fields.
Composite sampling accelerates soil fertility assessment, aligning with the growing adoption of GPS-tagged field tools—over 90 % of agronomists now use such devices during sampling. Composite soil sampling is widely used in several areas:
1. Agriculture (Crop Fields): Routine fertility testing before planting is perhaps the most common use. Farmers composite-sample fields every few years (often in rotations) to guide fertilizer and lime. Since many fields are fairly uniform or large, one composite per several acres is standard practice.
2. Lawns and Gardens: Homeowners and landscapers often composite-sample lawns, turf, or garden plots to check nutrients and pH. The composite might cover the whole yard or a portion of it. Guidance usually calls for mixing 5–10 cores to represent an entire lawn area.
3. Environmental Screening: To quickly screen a large site for contaminants (e.g. old industrial land), regulators sometimes use composite samples. This tells if any overall contamination exists. If a composite shows high levels of a pollutant, then discrete point samples can be taken to find the specific hot spots. Without that initial composite, testing every corner would be too costly. (However, composites are not used when clean site levels are needed, because they could dilute a real hot spot.)
4. Research and Trials: In experimental plots, researchers often use composite sampling to characterize baseline soil fertility. For example, a university study may composite-sample each experimental block to ensure uniform starting conditions.
In all these cases, composite sampling provides a quick “big picture” of the soil over a broad area. It tells the manager where the average fertility stands and whether general amendments are needed.
How GeoPard Enables Smarter Composite Soil Sampling?
Composite sampling, when combined with advanced data-driven tools, provides growers with accurate nutrient insights at a fraction of the cost of intensive sampling. GeoPard Agriculture takes this process further by integrating remote sensing, smart algorithms, and optimal path generation — making composite soil sampling smarter, faster, and more efficient. GeoPard supports both grid-based and zone-based analysis, giving agronomists flexibility depending on the field’s history and variability.
- 1. Grid-based sampling divides the field into uniform grid cells and places points at regular intervals, making it an excellent approach for initial field assessments or when no prior data exists.
- 2. Zone-based sampling, on the other hand, leverages data such as yield maps, soil maps, and satellite imagery to create management zones that reflect the true variability of the field.
By strategically placing samples within each zone, farmers capture the unique characteristics of their fields more efficiently, particularly in areas where variability is already known. Furthermore, when it comes to the type of sampling, GeoPard accommodates both core and composite methods.
- Core sampling involves analyzing each individual soil sample separately, offering the highest resolution of variability but with higher lab costs.
- Composite sampling, by mixing multiple cores into a single representative sample for each grid or zone, balances cost-effectiveness with actionable insights — making it especially practical for large fields without losing the advantages of zone-specific data.
To keep workflows organized, GeoPard provides customizable label templates that automatically tag sampling points by zone ID or sequence number. This ensures that samples are well-documented from field collection through to lab analysis and reporting, reducing the risk of errors and making results easier to interpret.
Efficiency in the field is further improved through GeoPard’s path generation logic. The Smart Optimal Path feature automatically calculates the shortest and most efficient walking or driving route across all zones, minimizing time and distance traveled. Alternatively, agronomists can choose a zone-by-zone collection method, which simplifies operations by focusing on one zone at a time regardless of overall path length.
For first-time users, GeoPard’s Smart Sampling Recommendation is the best starting point, as the system adapts to the unique characteristics of each field to balance statistical accuracy with operational efficiency. By combining composite soil sampling with the power of precision agriculture and remote sensing, GeoPard ensures that farmers and agronomists receive the most representative, cost-effective, and actionable soil data possible.
From Uniform to Zoned: Precision Agriculture Concepts
While composite sampling is about averages, precision agriculture (PA) is about recognizing and managing variability. Precision ag uses tools (GPS, sensors, software) to ensure each part of the field gets the right treatment. The USDA defines precision agriculture as “farming tools based on observing, measuring, and responding to within-field variability.” In practice, this means dividing a field into smaller management zones (each relatively uniform) and managing each zone on its own terms.
1. Zone-Based Management
Global adoption of precision agriculture is growing rapidly. According to MarketsandMarkets, the precision farming market is projected to reach $21.9 billion by 2030, growing at a CAGR of nearly 12% from 2025 onward. Around 70–80% of new farm equipment sold in North America now comes with GPS or precision technology capabilities. This reflects a strong shift from traditional uniform approaches to more data-driven, zone-specific management.
The core idea is zone-based management: rather than treating a whole field the same, PA aims to apply inputs (fertilizer, seed, water) variably, matching the differing needs of each zone. Zones might be created using soil type maps, yield history, or sensor data. For example, a low-lying wet area of the field might be one zone, and a higher well-drained area another.
2. Precision Technologies
The global use of precision farming technologies such as drones, soil sensors, and variable-rate applicators is accelerating. Reports indicate that over 80% of large-scale farms in developed countries use GPS-guided equipment, and drone-based crop monitoring is expected to cover more than 60% of arable land in the U.S. by 2027.
These tools are estimated to reduce fertilizer and chemical use by up to 20% while increasing yields by 10–15% on average. Precision technologies help this in two key ways:
- Data collection: GPS-enabled planters, yield monitors, and soil sensors record information at very fine resolution.
- Variable application equipment: Tractors and sprayers can automatically vary rates as they move.
For example, variable-rate applicators (VRT) use prescription maps to put more fertilizer where needed and less where not. Yield monitors on combines record yield in real time and later create yield maps. The result is site-specific management instead of “one-size-fits-all.”
3. Remote Sensing
As of 2025, the global precision agriculture market is valued at over $12 billion, with remote sensing playing a central role in data-driven decision-making. The adoption of drones for agricultural monitoring is growing at a rate of over 30% annually, while satellites like Sentinel-2 now provide imagery with resolutions as fine as 10 meters every 5 days.
In the United States alone, more than 60% of large-scale farms now use some form of satellite or drone-based sensing for crop monitoring, water management, or soil mapping. This rapid growth highlights the critical role of remote sensing in optimizing yields and resource efficiency.
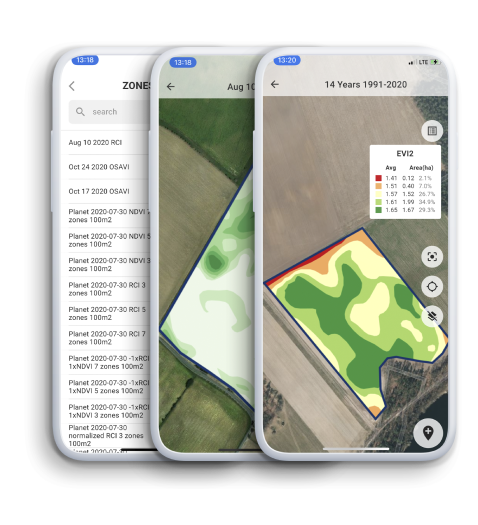
RS can reveal patterns invisible at ground level. For example, satellite images processed for NDVI (Normalized Difference Vegetation Index) show plant “greenness” and vigor across an entire field. Healthy, dense crops reflect more infrared light; NDVI captures that mathematically.
Remote sensing provides data layers that help define sampling zones. Imagine an NDVI map colored from blue (poor growth) to green (vigorous growth). Those color patterns often align with underlying soil fertility or moisture. Similarly, multispectral drone images can show where crops are stunted, waterlogged, or nutrient-deficient. By overlaying NDVI imagery, yield maps, or soil electrical conductivity maps in a GIS program, agronomists identify stable management zones – areas that tend to act similarly over time.
For example, Iowa researchers have demonstrated that “yield maps from many years and aerial images of both bare soil and crop canopy can be used to identify management zones” because these products tend to reflect underlying soil conditions. In practice, a farmer might use two years of GPS yield data plus a soil survey to split a field into 3–5 zones (high-, medium-, low-yield zones).
Each zone is presumed to have roughly uniform soil conditions, and then each zone is composite-sampled. This data-driven composite sampling yields more precise recommendations than sampling the whole field as one.
Remote sensing is also moving to higher resolution and frequency. New satellites (PlanetScope, Sentinel) deliver NDVI at ~3–10 m resolution every few days. Drones can fly fields weekly, capturing detailed crop color images. These trends mean managers can spot small patches of stress and adjust zones as needed. Already, large farms commonly subscribe to satellite services or have field drones to “scout” crops. These layers feed into modern GIS or farm-management software to help draw the new sampling boundaries.
Integrating Composite Sampling with Precision Ag
Precision agriculture technologies have enabled input application efficiencies of up to 15–20%, with average yield improvement ranging between 8–12 bushels per acre through variable-rate nutrient management—underscoring the importance of integrating composite sampling into data-driven workflows. In a precision-ag workflow, composite sampling still plays a role, but it is guided by the data:
1. Pre-sampling analysis: Gather all available data – past yield maps, satellite NDVI or drone imagery, soil type and topography maps. Use this information to divide the field into 3–6 management zones of roughly uniform soil potential. Each zone might be contiguous, or some zones might include separate areas that look similar (for example, two low spots in different parts of the field could be one “low fertility” zone).

2. Zone-based composite sampling: For each management zone, collect and composite soil cores as before. In practice, that means taking ~15–20 cores within zone A and mixing them, then a separate composite for zone B, etc. Each zone yields one sample bag. You might end up with several soil tests for one field (one per zone) rather than just one for the whole field.
This approach is sometimes called “directed composite sampling” or “zone sampling.” It retains the cost advantages of compositing (one analysis per zone) but avoids averaging across dissimilar areas.
3. Analysis and prescription: Send each zone sample to the lab. When results come back, you will have different values for each zone. For example, Zone A might need more phosphorus than Zone B. You then create a variable-rate prescription map for fertilizer or lime: treat each zone according to its own needs. Many precision-planter or sprayer controllers can use these zone maps to apply inputs.
4. Validation and refinement: In subsequent seasons, monitor crop performance. Use your combine’s yield monitor (or continued satellite NDVI) to see if the zones you defined were indeed distinct in yield. Adjust your zone boundaries or the number of zones as needed. Over time, this feedback loop should improve the accuracy of zones and the efficiency of input use.
In effect, PA/RS have transformed “composite sampling” from a one-sample-per-field process into a multiple-samples-per-field process, each sample representing a precise, data-defined area. This yields better information. As one industry blog puts it, GPS grid (or zone) sampling “allows for the creation of variable rate prescriptions, ensuring that each area of the field receives the appropriate amount of nutrients.
This level of precision is not possible with composite sampling, which provides only an average nutrient level”. In other words, composites remain used, but within smaller, smarter zones. The integration of composite sampling with technology is still evolving. Some trends on the horizon include:
- High-resolution sensors: For example, hyperspectral cameras or red-edge bands can detect nitrogen deficiencies, water stress, or disease before the crop shows symptoms.
- On-the-go soil sensing: Equipment like electromagnetic (EM38) sensors, gamma-ray, or near-infrared probes can “scan” the field in real time. Modern tractors can tow soil sensors or even have sub-surface electromagnetic sensors on the go, producing high-density soil maps on the fly.
- Artificial intelligence and data fusion: Machine learning models can combine historical soil tests, weather, yield, and remote sensing data to predict nutrient levels or identify zones automatically. For example, an AI system could analyze years of NDVI and yield to suggest new zone boundaries.
Conclusion
Composite soil sampling is a time-tested, cost-effective method to gauge the average soil fertility of large areas. It simplifies soil testing by giving one result per zone, guiding uniform management for that zone. However, its inherent averaging can mask important differences. The rise of precision agriculture and remote sensing is not eliminating composite sampling; rather, it’s redefining where and how we composite. By using GPS-guided samplers, yield maps, and satellite/drone imagery, farmers now often sample in zones of similar productivity, making each composite sample more meaningful.
Remote Sensing