Automated soil sampling planning is a modern precision agriculture technique that uses software and algorithms to design optimized sampling schemes for farm fields. Instead of manually choosing sample locations (for example, by walking the field in a grid or drawing subjective zones), automated systems ingest various data layers (maps, historical yields, satellite images, etc.) and compute where to collect soil cores.
In short, it replaces much of the guesswork and manual effort with data-driven science. Modern tools can “build soil sampling plans in minutes across one or many fields” by choosing grid or zone sampling options and using “smart algorithms [to] place points and route the path”. The goal is to capture soil variability accurately while minimizing time, cost, and labor in the field.
How It Is Different Than Traditional Sampling?
Traditional sampling methods often involved dividing a field into equal cells (grid sampling) or heuristic zones and then collecting a fixed number of cores in each. For example, grid sampling breaks a field into a regular grid (often 1–5 acre cells) and takes soil cores in every cell. While widely used, this can mean hundreds of samples and very high labor costs: a uniformly spaced grid can yield a large number of probes, raising the time and cost needed for both collection and laboratory work.
Similarly, zone sampling relied on an agronomist’s judgment to draw maps of “management zones” (areas assumed to be similar), but this was subjective and could miss hidden patterns. By contrast, automated planning uses data (like yield maps, soil surveys, satellite NDVI images, or electrical conductivity scans) to identify true patterns of variability. In effect, it lets computers determine where small soil cores should be taken so that the final lab tests will best represent the field.
The core objective of automated soil sampling planning is straightforward: maximize data quality and insight while minimizing effort and cost. Good sampling captures the real variability of the field, enabling precise fertilization or liming later. At the same time, taking thousands of unnecessary samples is wasteful. Automated planning seeks the statistical “sweet spot” – enough points to accurately map fertility, but no more than needed.
In practical terms, that means high data accuracy and actionable results with the least time and expense. For example, one recent study showed that clustering a field into homogeneous management zones allowed farmers to cut their required soil samples by 50–75% without sacrificing information.
Such efficiency gains directly support higher profits and lower environmental impact. Indeed, agricultural researchers emphasize that precision soil management (including careful sampling) can boost productivity and shrink waste – a critical need as global population approaches 10 billion by 2050.
Core Components of Automated Soil Planning System
In recent surveys of precision agriculture adoption, more than 40% of large farms globally report using advanced data layers such as satellite imagery or soil electrical conductivity maps as part of their routine operations (2024 data). In 2023, the global precision agriculture market exceeded USD 10 billion, with soil and data-driven services growing at nearly 12% annually.
These facts underline how the core components described below are not theoretical, but increasingly common tools on modern farms. An automated soil sampling planner typically consists of three parts:
- data inputs,
- analysis algorithms, and
- outputs/deliverables.
Each part combines to turn raw field data into a ready-to-use sampling plan.
A. Data Inputs & Integration
Automated planning software consumes a variety of field data. Common inputs include:
1. Geospatial maps: These tell the computer where and how the field varies physically. Examples are digital field boundaries (often as shapefiles or KML files) and topography/elevation models (DEM data). Elevation influences soil moisture and nutrient distribution, so planners often weight high and low areas differently. If available, farm GIS layers such as existing management zones can also be inputs.

2. Historical soil test data: Past soil analysis results (like maps of pH, nitrogen, phosphorus, potassium, organic matter) are extremely valuable. They directly show where the soil has low or high fertility. Planners may import previous lab results as maps or spreadsheets. If the farm has been testing for years, that history helps tailor the plan to known problem spots.
3. Yield maps: Many farms have combine yield monitors from prior seasons. Layers that show which parts of the field consistently produce high or low yields can indicate underlying soil differences. For example, parts of the field that were always low-yielding might be nutrient-poor; sampling planners use yield frequency maps to find such areas. Combining multiple years of yield data is recommended so that unusual weather one year (flood, drought) doesn’t skew the plan.
4. Remote sensing data: Satellite or drone images of the crop are invaluable for spotting patterns invisible to the naked eye. Vegetation indices like NDVI (Normalized Difference Vegetation Index) or NDRE capture plant vigor, often reflecting soil fertility or moisture. A cloud-free summer NDVI map can highlight zones of consistently better or worse crop growth. Many planners also use aerial or drone multispectral images. Additionally, proximal sensor maps such as electromagnetic conductivity (ECa) give information on soil texture and salt content, which often correlate with fertility.
In practice, good planners allow users to import or link any of these layers. For instance, a cloud-based tool might let a farmer upload a field boundary shapefile and then overlay an NDVI image and yield maps for the same field. The software then analyzes them together.
As one extension guide notes, soil properties such as organic carbon, electrical conductivity (ECa), soil texture (sand/silt/clay), topography, aerial photos, and indices like NDVI have all proven useful in delineating management zones. By bringing these data layers into one system, the planner can “see” the big picture of field variability before picking sample points.
B. The Planning Algorithm & Logic
Algorithms lie at the heart of automated soil sampling. As of 2025, many commercial platforms now integrate machine learning clustering techniques, hybrid statistical models, or PCA-based zone generation. Their performance is often benchmarked by cross validation using withheld soil data, with users reporting up to 15–20% improvement in variance capture compared to old methods. Below is how typical methods function:
1. Zone-Based (clustered) sampling: This is the most common method. The system uses clustering logic on the input maps to carve the field into distinct zones that are internally similar. For example, it might run a k-means clustering on the combined data layers (e.g. yield+NDVI+soil data) to form 3–6 “management zones.” Because each zone is assumed fairly uniform, only a few samples per zone are needed.
The software then distributes sampling points within each zone (often as a small grid or random points) to capture any remaining variability. Modern tools often allow the user to weight different data layers or adjust the number of zones. Some even use PCA (Principal Component Analysis) first to reduce data and then cluster the results.

2. Grid sampling: In this mode, the software simply overlays a regular grid over the field and generates a point at each cell center. Users can set the cell size (e.g. 1.5 acres) or a total number of points. The planner can also adapt grid density in variable terrain: for example, smaller cells on hills where variability is higher, and larger cells on flat ground. The advantage is uniform coverage without bias.
The downside is that a very fine grid means many samples, but a coarse grid may miss details. Automated systems can help pick a reasonable spacing – for instance, studies suggest that a 1-acre grid captures about 80% of field variability, whereas a 2.5-acre grid falls to ~76% accuracy. Some software gives feedback on expected accuracy or coverage based on the chosen grid.
3. Directed (targeted) sampling: Some fields have specific known issues (e.g. saline patches, low-yielding “dead zones,” or areas with compaction). An automated planner can incorporate these by placing extra points there. For example, if satellite imagery or an EC map shows a hot spot of salinity, the user might instruct the tool to add samples in that region. This ensures problem areas get sampled more intensively.
4. Statistical checks: Underlying all methods is a statistical foundation. Planners often ensure that the number and location of samples meet basic statistical requirements for representativeness. For example, they may check that each zone has a minimum area or that samples are spread to avoid clustering.
Some use Monte Carlo simulations or spatial statistics to validate that the plan’s design will likely capture the field’s variability. The goal is to avoid biased sampling; by automatically generating points, the system removes the common problem of “convenience sampling” (taking samples only where easy to walk) and instead follows systematic or random patterns dictated by data.
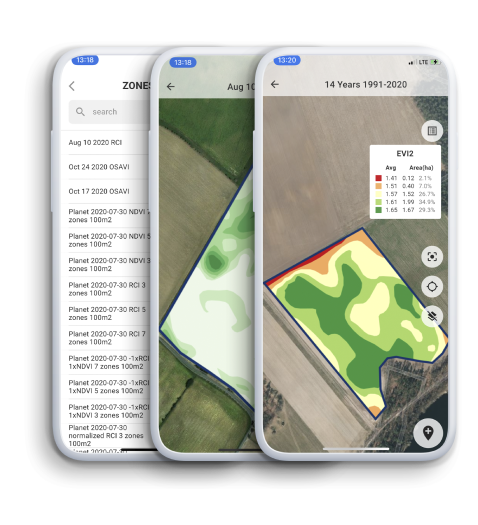
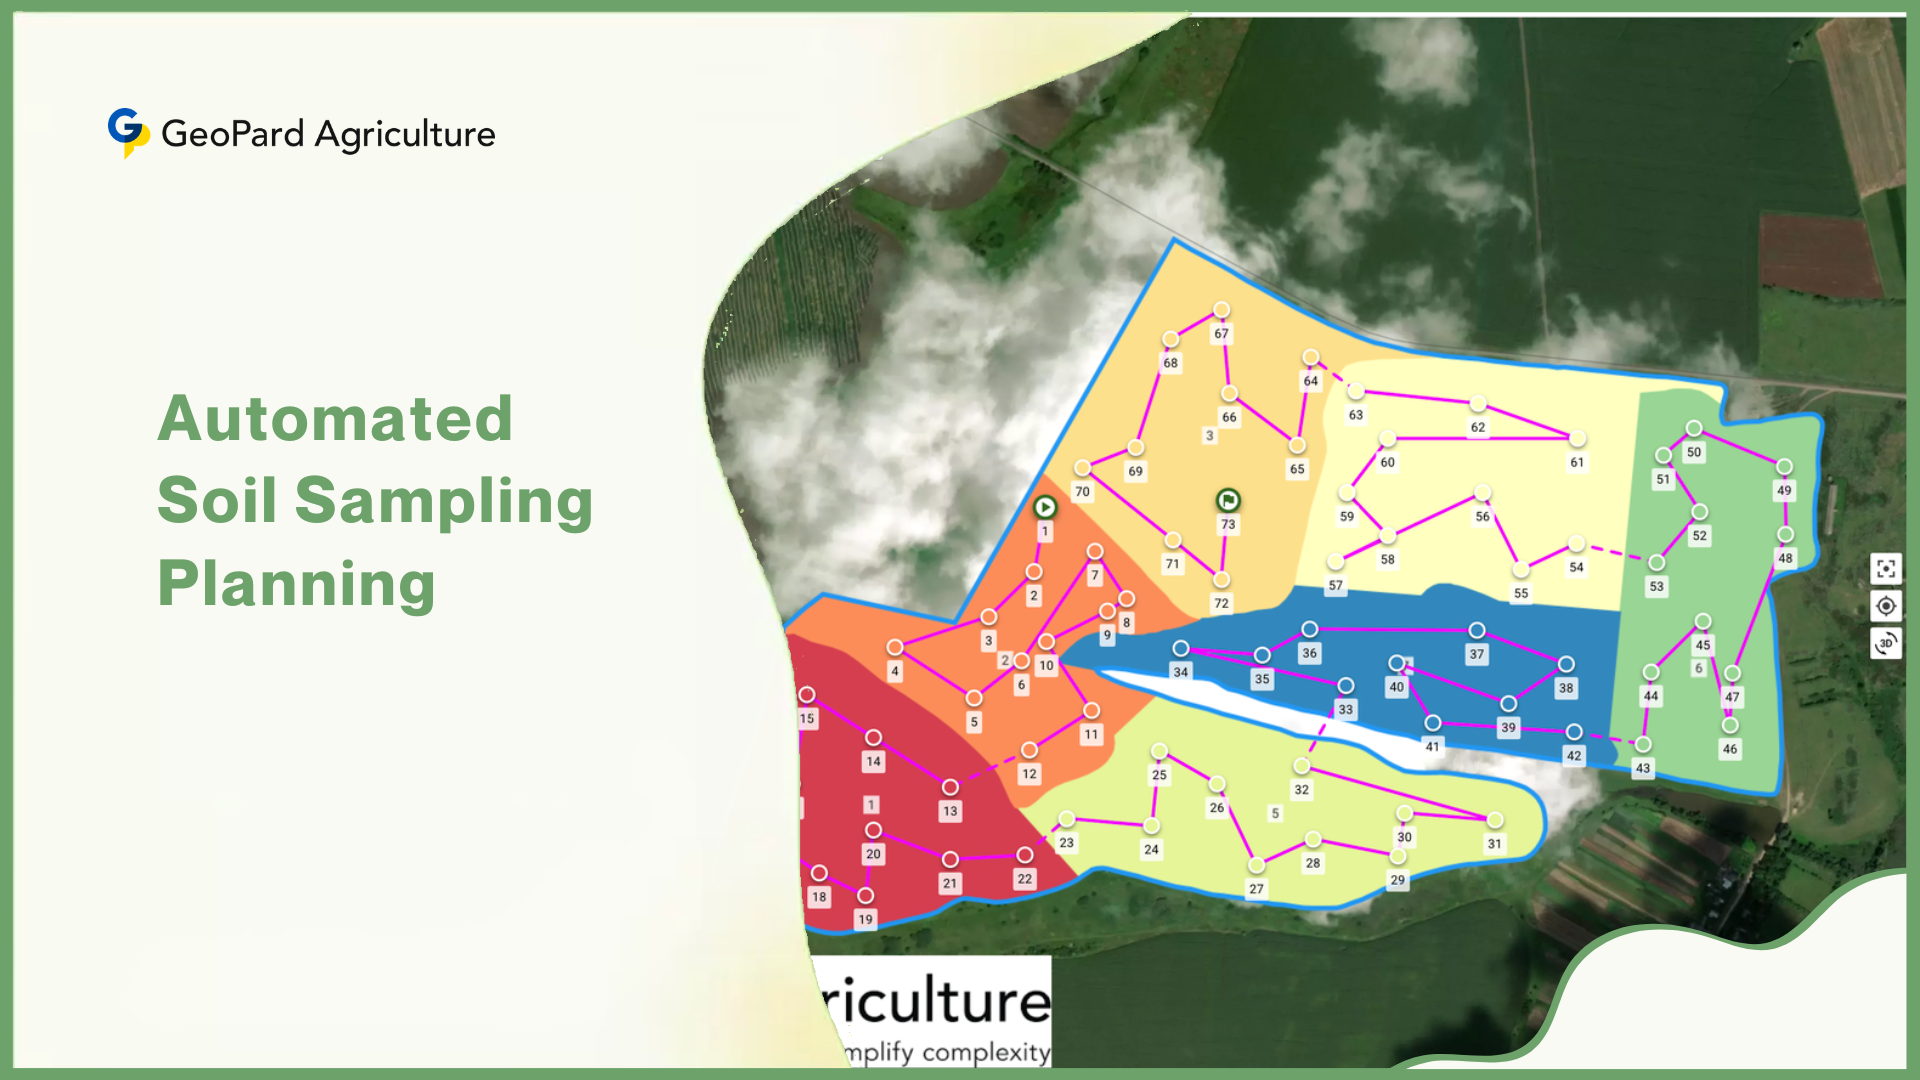
In many systems, the algorithm runs once after all layers and parameters are set. For instance, a cloud-based app might run in seconds and output a map of red and yellow points in each zone (see figure below). These points represent where the soil cores should be taken.
Internally, the program might use common clustering tools (e.g. K-means, fuzzy c-means) or custom heuristics to balance point placement. Once zones are defined, many tools use simple geometric patterns (e.g. core lines or zig-zags) within each zone to space out the actual sampling points.
C. Outputs & Deliverables
In 2024 surveys, more than 70% of precision farming services reported that automated exports (GPS routes, lab label sheets) were among the most valued features. The seamless handoff from plan to field is becoming a differentiator in farming software. The final output of an automated sampling planner is typically a set of concrete instructions for the field crew, including:
1. Georeferenced Sampling Point Map: This is usually a map (PDF, GIS layer, or mobile app route) showing each soil core location by GPS coordinates. It might display colored zones and numbered points. Field technicians use this map on a tablet or printout to navigate the field. Some systems even export to popular GPS-NAV apps or in formats (like ISOXML) that automatically load into precision ag headsets.
2. Sampling Protocol/Work Order: This is a written guide describing how to execute the plan. It typically includes instructions on sample density (e.g. “take 5 cores per zone”), depths (e.g. 0–6 inches, 6–24 inches), sampling tools needed, and labeling conventions. It may indicate which points are “core” samples (each taken individually) or “composite” (multiple sub-cores mixed). The software can generate lab labels or bag tags with unique IDs corresponding to each point.
3. Data Import Templates: After samples are collected and lab-tested, the results must be re-integrated with the planner. Many systems provide an Excel or CSV template where lab results can be entered row by row (one row per point). When the template is uploaded back, the software automatically re-connects the soil data to the map coordinates. This closes the loop, allowing instant generation of soil property maps. Automated planners often handle this seamlessly so that the new data feed directly into the farm’s GIS or VRA (variable-rate application) system.
These outputs ensure that the plan can be executed with minimal confusion and that the data come back ready for decision-making. Some advanced tools even print GPS-guidance files and lab labels automatically. The key is an integrated workflow: once data are in the system, the planner does the heavy lifting of analysis and simply hands off clear instructions to the crew.
The Automated Soil Sampling Planning Workflow (Step-by-Step)
By 2025, major precision-farm software providers report that more than 60% of their users generate soil sampling plans as part of routine operations. Many farmers now treat sampling planning as a standard annual step rather than a special project. This increasing adoption highlights the importance of understanding the workflow below. A typical automated soil sampling project follows a clear sequence of steps. These are often built into the planning app as a guided process:
i. Define Objectives: Before planning, the user specifies why they are sampling. Is it to build a detailed nutrient map for variable-rate fertilizing? To establish a soil health baseline? To investigate a disease outbreak area? Clear objectives (e.g. “Optimize N fertilizer zones” or “Verify lime rate needs”) help guide later settings.

ii. Data Upload & Layer Selection: Next, the user uploads or selects the spatial data layers to use. For example: field boundary map (required), plus any of yield maps, soil surveys, NDVI images, elevation models, etc. Often the software is pre-connected to cloud data (satellite imagery catalogs, or the farm’s past data), so the user just clicks which years or layers to include.
iii. Set Parameters: The user then configures the sampling intensity. This might be the target points per acre (e.g. 1 point per 2 acres), the number of zones desired (say 3 zones), or the grid cell size. The user can also choose sampling type (grid vs zonal, core vs composite). Some systems let the user weight layers (e.g. give extra weight to soil pH map when defining zones). This step calibrates how the algorithm will behave.
iv. Run Algorithm (Plan Generation): With data and parameters set, the planner executes the analysis. In seconds or minutes, it processes the input layers, delineates zones or grids, and places sampling points. The result is a draft plan. Modern systems may show a 2D map or 3D view of the plan.
v. Review & Adjust (Optional): The user then inspects the plan. Most software allows clicking on zones or points to ensure they look sensible. The user can manually add or remove points if needed (for instance, avoid an inaccessible wet area or add a point to a newly identified cold spot). Some planners allow shifting points or merging zones on the fly. However, the goal is minimal manual tweaking – ideally, the system’s first draft is sound.
vi. Export Plan & Prepare Field Work: Finally, the completed plan is exported in the needed formats. The map is sent to the field device or GPS unit. Lab labels and the work order are printed. At this point, field crews can go out and collect exactly the indicated samples. The entire planning stage, which used to take hours or even days of agronomist time, is now compressed into a few minutes of software operation.
For large farms or cooperatives, the same workflow can be repeated in batch mode. Many platforms support multi-field planning, meaning the user selects multiple fields at once and generates all their sampling plans together. This makes it easy to scale up from one trial field to hundreds of acres of planning.
Key Benefits of Automated Soil Sampling Planning
Recent industry reports show that farms using automated planning have shortened their soil sampling planning time by 80% or more, and many report a 20–30% reduction in sampling-related costs in their first season. These real-world outcomes reflect the benefits described below. Automated soil sampling planning offers several major benefits compared to traditional methods:
1. Much Higher Efficiency: By automating the design process, what used to take hours or days can be done in minutes. When all the data layers are fed in, the software runs the algorithm almost instantly. For example, one platform advertises that sampling plans for many fields can be created “in minutes.” This drastically reduces technician and agronomist time. In practice, a single planner click generates dozens of sample points with exact GPS, replacing laborious manual mapping.

2. Improved Accuracy & Objectivity: Data-driven plans remove human bias. Traditional zone maps drawn by eye can miss hidden variability; automated zones are based on actual measured data patterns. Algorithms ensure that sample points cover the field’s diversity systematically. As an MSU Extension specialist notes, establishing management zones based on data is “critical to ensure that results are valid and accurate,” because it accounts for real spatial variations. Algorithms ensure that sample points cover the field’s diversity systematically.
3. Cost-Effectiveness: By focusing samples where they count, fewer cores may be needed overall. Studies have found that good zone sampling plans can reduce lab costs by requiring 50–75% fewer samples. Each soil lab test costs money, so cutting duplicate or unnecessary tests saves dollars. Also, reducing field time (fewer walking loops) saves labor or machinery fuel. Automated planning thus improves the return on investment for soil testing.
4. Better Decision Support: High-quality sampling leads to higher-quality fertilizer prescriptions and management decisions. For instance, by using spatial sampling, farmers can adjust lime and nutrient applications variably across the field. Visualizing deficiency maps (derived from dense sampling) helps “address problem areas effectively” and “achieve spatially varying nutrient applications.” In short, better soil data enables more precise rates of P, K, lime, etc., boosting yields or saving input costs.
5. Scalability: Automated planners are easily scaled up. They can handle a single small field or tens of fields without extra effort. Multi-field features mean a consultant can upload 100 fields and generate 100 plans automatically. This fits well for large farms or agriculture services offering soil testing at scale. As farm operations grow, the same workflow works without adding manual burden.
Automated planning turns soil sampling from a cumbersome chore into a streamlined data workflow. It empowers farmers and agronomists to get better soil maps faster and cheaper, which in turn improves the efficiency of crop fertilization and land management.
How GeoPard Software Helps in Automated Soil Sampling Planning?
GeoPard software brings automation, intelligence, and simplicity to the soil sampling process. Designed for farmers, agronomists, soil labs, retailers, and dealers, GeoPard helps you create optimized soil sampling plans using software in just minutes — for one field or an entire farm. With GeoPard soil sampling software tutorial, you can choose between grid or zone-based sampling, select core or composite methods, and let AI-powered algorithms automatically place sampling points, calculate routes, print lab labels, and export ready-to-use maps.
1. Smarter Planning, Faster Results
GeoPard’s software workflow makes soil sampling planning easy and efficient:
- Start a New Plan – Select one or multiple fields, or copy settings from past plans for consistency.
- Pick Sampling Type – Choose grid-based sampling for uniform coverage, or zone-based sampling to focus on field variability.
- Set Sample Style – Go composite for cost efficiency or core sampling for detailed soil analysis.
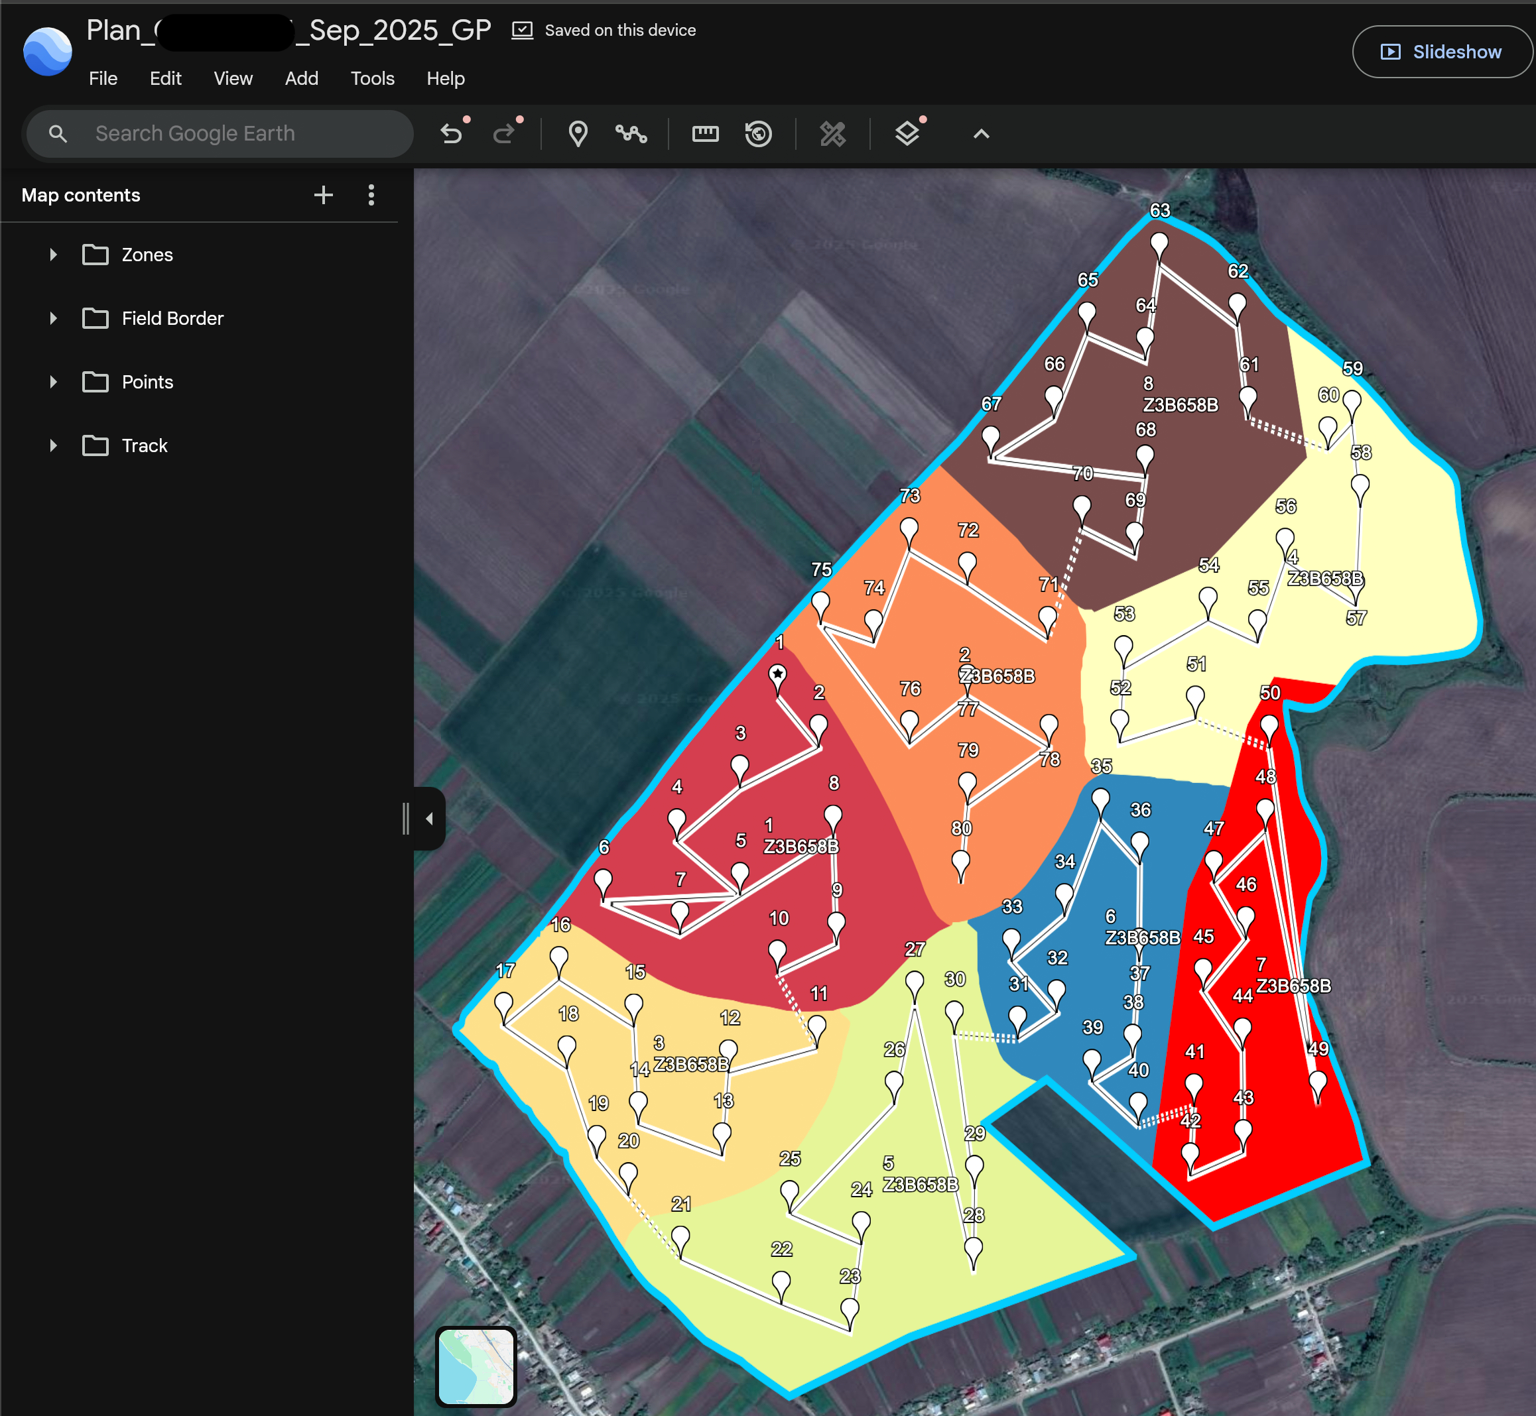
- Configure Points and Path – GeoPard’s smart logic places points using adaptive algorithms like Smart Recommendation, Core Line, N/Z, or W patterns.
- Optimize Routing – Select Smart Optimal Path for automated samplers or Zone-by-Zone routing for manual teams.
- Print and Export – Print custom lab labels and export plans as KML or Shapefile for GPS navigation.

2. Intelligent Features that Save Time
GeoPard’s AI-driven software automatically adapts to each field’s shape, variability, and data. You can control grid size, number of points per zone, sample depth, and rotation angles — ensuring precise yet efficient sampling coverage.
Multi-field planning allows consultants or large farms to generate multiple soil sampling plans in one go, maintaining consistency across seasons and regions.
3. Execute Plans in the Field with GeoPard Mobile
The GeoPard Mobile App lets field teams carry out sampling seamlessly. You can view maps, navigate to each point, and mark samples as completed — even offline. The app also supports real-time tracking, note-taking, and label printing directly from mobile devices.
4. Simple Labeling and Exporting
GeoPard simplifies labeling with automatic zone or point-based templates. Users can download and print ready-made PDF labels for soil bags or lab samples, keeping every core traceable. Plans and routes can also be exported to navigation apps, ensuring smooth execution from planning to lab delivery.
5. Why Professionals Choose GeoPard Soil Sampling Software
- Speed: Build soil sampling plans in minutes.
- Accuracy: Smart algorithms optimize every sampling point.
- Flexibility: Supports both grid and zone sampling, core and composite methods.
- Scalability: Plan for one field or hundreds.
- Field Efficiency: Offline navigation and live progress tracking.
GeoPard turns soil sampling into a streamlined, data-driven workflow. With AI planning, smart routing, and integrated mobile tools, it helps users collect more reliable soil data — faster and more consistently. It makes automated soil sampling planning smarter, faster, and ready for the future of precision agriculture.
Practical Considerations for Implementation
A 2025 study found that over 30% of failed precision-ag projects were due to low data integrity or mismatches between software and hardware. That underscores how essential the following practical points are when deploying automated sampling planning. While the benefits are clear, successful use of automated sampling planning depends on a few key practical factors:
1. Data Quality Is Crucial: Garbage in, garbage out. The automated plan can only be as good as the data fed into it. If yield maps have GPS errors, or if a soil survey layer is outdated, the resulting zones might be misleading. Precision ag experts stress careful data management: always collect and calibrate your source data.

For example, poor yield-monitor calibration or mislabeled fields can lead to bad prescriptions later. One extension article bluntly reminds growers: “We all have heard the phrase ‘garbage in, garbage out.’ Inaccurate or bad data can have ramifications for many years.” In other words, invest time in cleaning and validating your inputs before running automated plans.
2. Software and Platforms: These tools come in various forms. Some are standalone desktop GIS programs; others are cloud or mobile apps. Many precision-ag cloud platforms (e.g., Trimble Ag Software, Climate FieldView, FarmLogs, or specialized tools like GeoPard or AgLeader SMS) now include automated sampling modules.
Farmers or consultants should choose a platform that integrates well with their existing systems. It should import common data formats (shapefiles, yield .csv, imagery), and export to GPS units or mapping apps. Also consider cost/subscription: some services charge per plan or per acre.
3. Hardware and Export Compatibility: A plan is only useful if the sampler can follow it. Make sure the output format (maps, GPS file, or app data) works with your field devices. Many systems export directly to mobile tablets or RTK-GPS tools. Others might provide KML or shapefiles that can be loaded into generic navigation apps. Check that lab labels and data sheets match what your soil lab expects. Essentially, the entire chain – from planning to sample gathering to lab analysis – should be connected.
4. Integration in the Precision Ag Workflow: Soil sampling is one step in the larger cycle of precision farming. After planning (Plan) comes Sample (execute the field work) → Analyze (send cores to lab, get results) → Prescribe (use data to make application maps) → Apply (variable-rate application in field). Automated planning should fit smoothly into this cycle.
For example, once results come back, the data should plug into nutrient management software or VR fertilizer tools. Good planning software will often integrate with these systems. MSU Extension notes that after sampling, visualizing results allows effective application: for instance, farmers can vary lime or fertilizer rates across zones based on the lab maps.
5. User Training and Buy-In: Finally, adopting automated planning means trust in the technology. Farm managers and agronomists may need training to understand how zones are generated. It’s wise to start with pilot trials: run the automated plan in parallel with a tried-and-true manual plan for one field, and compare the results.
Over time, as users see the time saved and (ideally) the improved consistency, confidence will grow. In many case studies, growers find that the objectively derived zones often align with their intuition after the fact – but take much less effort to produce.
Future Trends in Automated Sampling
By 2025, market forecasts estimate that the combined market for autonomous field robots and precision-soil planning tools will exceed USD 1.2 billion, with double-digit growth per year. In parallel, early trials show robot samplers can hit GPS points with <10 cm error, outperforming manual crews under dense vegetation. These signals point to where the industry is heading. The field of soil sampling continues to evolve rapidly. Even beyond automated planning algorithms, we see several exciting trends on the horizon:
1. AI and Machine Learning: Beyond simple clustering, advanced AI methods are being applied. For example, researchers are developing tools that use deep learning on historical satellite imagery to predict soil conditions and suggest sample points. Mississippi State University is part of an 11-institution project funded by USDA-NIFA to develop the “Satellite-based Soil Sampling Design” (S3DTool).
This system will use a deep-learning algorithm on multi-year satellite images to automatically recommend sampling locations, essentially learning from past satellite data which areas need sampling. If successful, such AI-driven tools could make planning even more autonomous and predictive, taking into account subtle patterns in weather and crops over time.
2. Real-Time & Proximal Sensors: Researchers and companies are exploring on-the-go sensors that could reduce the need for physical cores. For instance, optical sensors mounted on equipment can measure crop or soil reflectance continuously. Electrical conductivity sensors towed across the field can create soil texture maps on the fly.
In the future, it is conceivable that a planter or sprayer will carry soil probes that sample automatically as it moves. These data could feed directly into the planning system (or even replace discrete cores) for near-continuous soil mapping. As one precision ag blog notes, we already have sensors like Greenseeker or Veris EC that create very fine-scale maps – the trend is toward coupling them with real-time analytics.
3. Autonomous Robotic Sampling: Beyond planning, fully autonomous samplers are emerging. Instead of a technician with a probe, some farms will deploy robotic vehicles to collect cores precisely at the planned GPS points. Companies like RogoAg already market self-driving soil samplers with RTK-GPS guidance to hit exact locations each time (in field trials, robotic samplers achieved higher accuracy and consistency than human operators).
As these robots become common, the sampling workflow could become truly hands-off: automated plan → deploy robot → automated core collection → label samples. This will greatly increase throughput of soil testing. While still new, expert surveys suggest robotics (in weeding, scouting, etc.) is growing – and soil sampling is a natural fit for automation, since each core location is a GPS point.
4. Integrated Decision Platforms: Finally, we expect sampling planning to be one part of ever-larger integrated farm management systems. Future platforms may not only design sample points but immediately analyze returned data, link with fertilizer markets, weather forecasts, and agronomic models.
For instance, one vision is a system that monitors soil health trends year to year, adjusting sampling intensity automatically based on past trends or yield risk. This will require data pipelines – AI-driven analytics, cloud computing, and IoT connectivity. In short, the “Smart Farm” of tomorrow will treat soil sampling as a continuous, automated process, integrated with everything from GPS tractors to weather data feeds.
Conclusion
Automated soil sampling planning represents a powerful convergence of agriculture and data science. By leveraging GIS, sensors, and smart algorithms, it transforms soil sampling from a tedious chore into a fast, precise, and scalable process. Farmers and agronomists using these tools can get more accurate pictures of their soil fertility while saving labor and cost. In practice, this means richer soil maps, better-targeted fertilization, and ultimately healthier crops and soils.
As precision farming continues to advance, we expect even tighter integration of soil sampling with real-time analytics and robotics. For now, even basic automated planning gives a significant edge: plans that used to take hours can be done in minutes, with the assurance that every pocket of the field is considered. For any grower interested in smarter nutrient management, understanding and adopting automated soil sampling planning is a key step toward higher efficiency and sustainability.
Soil Data