Obrada tla pod promjenjivom brzinom na temelju podataka o sabijenosti tla

For many years, tillage has been one of the most common field operations in agriculture. Farmers traditionally prepare their land by plowing, ripping, or cultivating the entire field at the same depth and intensity. This approach, known as uniform or whole-field tillage, is simple to manage and easy to plan. The basic assumption behind this method is that the soil condition is the same across the entire field.

Introduction: The Problem of Uniform Tillage

However, modern soil science and field data clearly show that this assumption is incorrect. Soil conditions are rarely uniform, even within small fields. Differences in soil texture, moisture, organic matter, slope, drainage, and machinery traffic create large variations in soil structure. One of the most important and damaging results of this variability is soil compaction.

Soil compaction does not occur evenly. Some areas become heavily compacted due to repeated machinery traffic, especially headlands and tramlines. Other areas may remain loose and well-structured. When a farmer applies the same tillage depth everywhere, some areas receive too much tillage, while others receive too little.

The cost of applying uniform tillage to this inherently variable problem is substantial, measured in both economic and ecological terms. In areas with naturally good structure or minimal compaction, deep tillage represents pure waste—it burns diesel fuel that could be saved, consumes labor hours that could be allocated elsewhere, accelerates the breakdown of valuable soil organic matter through excessive oxidation, destroys the intricate architecture of soil aggregates that took years to form, and leaves the soil surface bare and vulnerable to erosive forces of wind and water. Studies have shown that deep tillage can use 30–50% more fuel than shallow tillage, making unnecessary deep tillage a major economic burden.

Recent studies from the USDA’s Agricultural Research Service indicate that unnecessary tillage can accelerate soil organic matter loss by 2-4% annually in vulnerable soils. Conversely, in areas with severe subsurface compaction—the hard pans that form 8-16 inches below the surface—uniform shallow tillage fails completely. It skims the surface while leaving the root-restricting layer intact, creating what farmers call “false tilth” that looks good superficially but does nothing to address the underlying constraint on root growth and water movement.

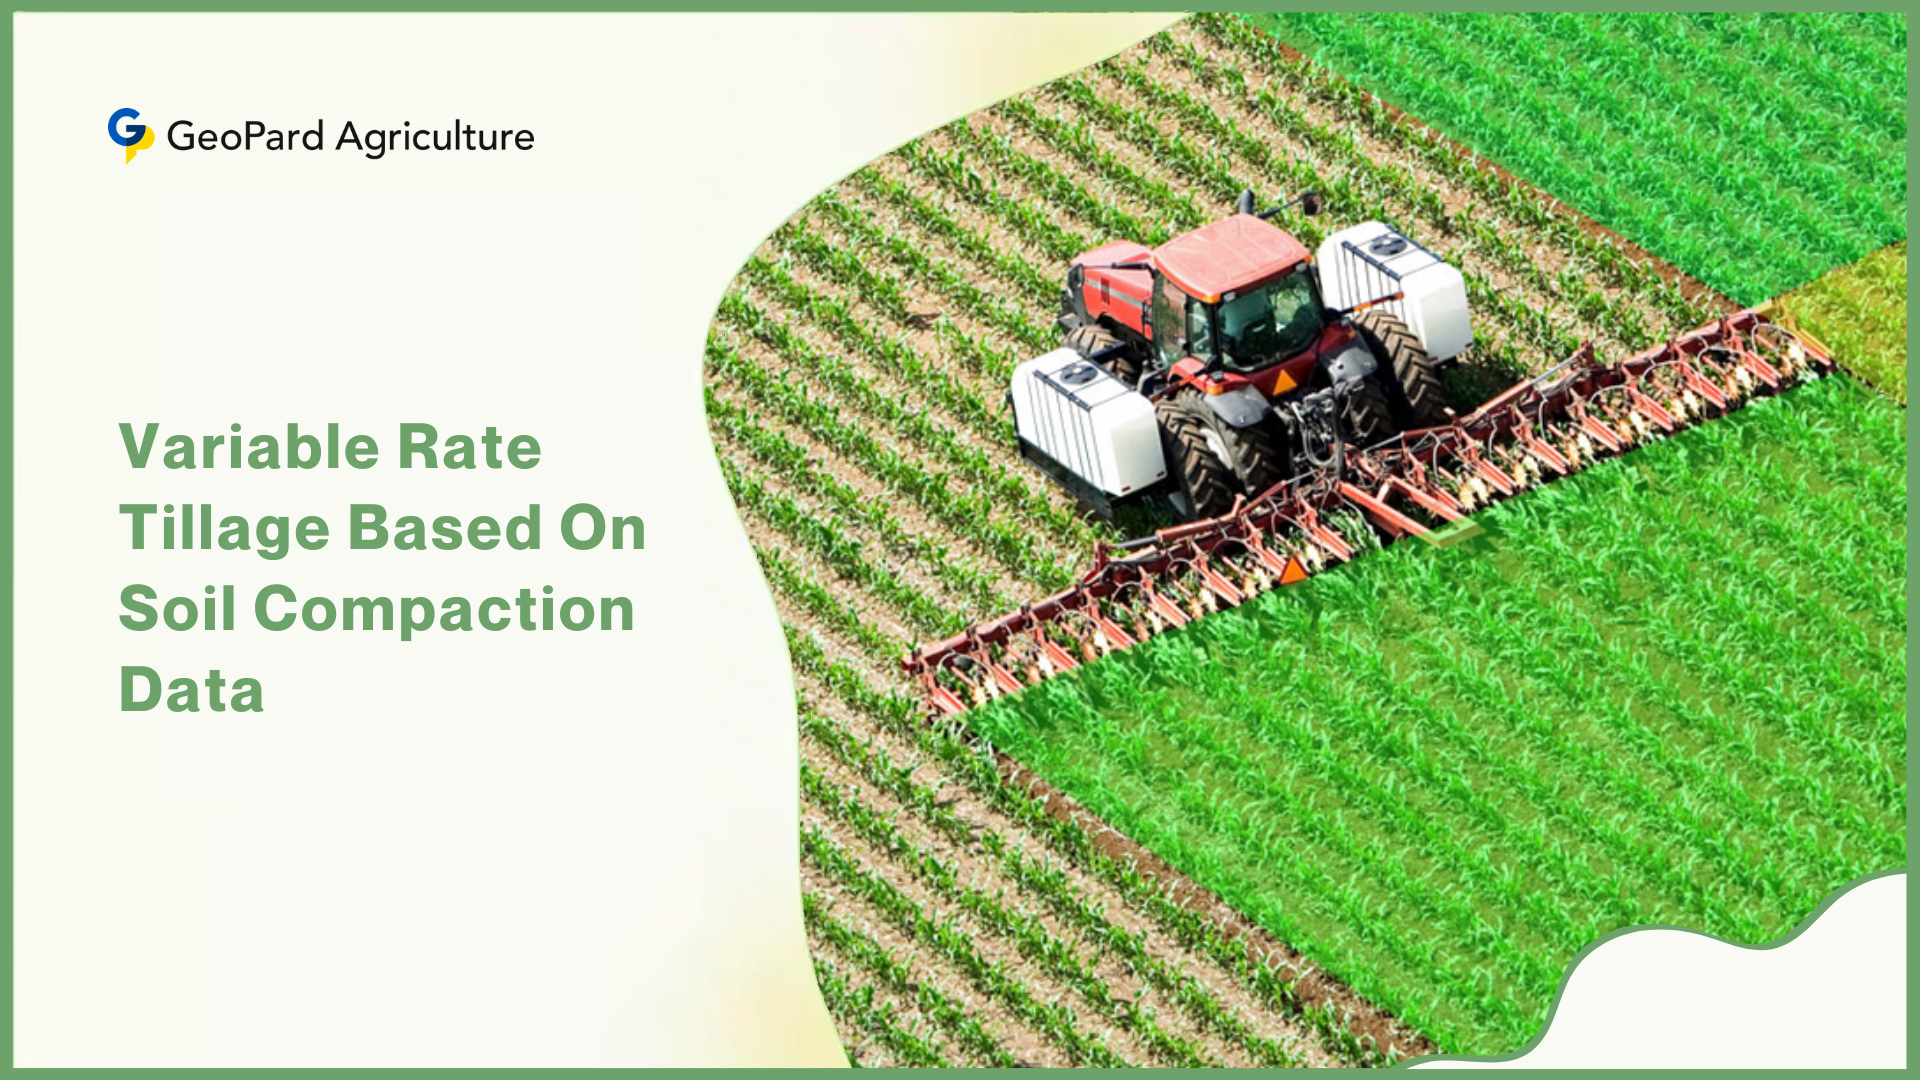
This brings us to the precision agriculture solution that is reshaping modern tillage philosophy: Variable Rate Tillage (VRT). VRT represents a fundamental shift from blanket applications to targeted interventions. It applies the precise type, depth, and intensity of soil disturbance only where it is diagnostically justified by soil condition data. At the heart of this approach lies soil compaction mapping—the systematic measurement and spatial analysis of soil strength across fields.

What Is Soil Compaction?

Soil compaction occurs when soil particles are pressed closer together, reducing pore space. This makes the soil denser and harder for roots, air, and water to move through. Compacted soil has fewer large pores, which are essential for oxygen movement and water infiltration.

What Is Soil Compaction?

Compaction often happens below the surface, forming a hardpan layer that is invisible but highly restrictive to crops. Soil compaction is mainly caused by:

  1. Heavy machinery traffic, especially repeated passes
  2. Tillage and harvest operations on wet soil
  3. High axle loads from modern equipment
  4. Livestock trampling in some systems
  5. Low organic matter, which weakens soil structure

Fields with fine-textured soils (clay and silt) are more prone to compaction than sandy soils, especially when wet. Some of the common types of soil Compaction are:

  1. Surface Compaction: Occurs in the top 5–10 cm of soil. It affects seed emergence and early root growth.
  2. Subsoil Compaction: Occurs deeper (20–40 cm) and is more serious. It restricts deep root growth and water movement and can persist for many years if not corrected.

The Foundation: Mapping Soil Compaction

The foundational principle of precision agriculture is that you cannot effectively manage variability you have not measured. Before any intelligent tillage decisions can be made, a farmer must develop a detailed, accurate understanding of how soil compaction varies across their land. This requires moving beyond occasional probe checks and subjective assessments to systematic, data-rich mapping of soil strength at relevant depths throughout the entire production area.

A. Data Collection Methods & Technologies

Today, farmers have multiple tools to “see” into their soil profile without digging endless holes.

1. Direct Sensing: On-the-go penetrometers are the gold standard for measuring compaction. Mounted on a tractor, UTV, or dedicated sled, these instruments push a standardized cone into the soil and measure the resistance (called cone index) at various depths. Modern systems, like those from Veris Technologies or Topcon, record thousands of data points per acre along with GPS coordinates, creating a dense, high-resolution map of soil strength.

Recent 2024 data from the Precision Agriculture Association indicates that penetrometer-based mapping, when done at proper soil moisture (near field capacity), achieves over 92% accuracy in identifying compacted zones that limit root growth.

2. Indirect/Proximal Sensing: Electromagnetic Induction (EMI) sensors, which map soil electrical conductivity (EC), are powerful proxy tools. While EC is influenced by clay content, moisture, and salinity, it often correlates strongly with compaction zones. Wet, compacted clay areas typically show high EC. Companies like Geonics, Dualem, and Veris offer implements that generate EC maps quickly, providing a foundational layer of soil variability data.

According to 2023 research from the University of Nebraska-Lincoln, when EMI data is calibrated with strategic penetrometer measurements and combined with soil texture maps, it can predict compaction zones with 85-90% reliability, making it an excellent reconnaissance tool.

Mapping Soil Compaction Data Collection Methods & Technologies

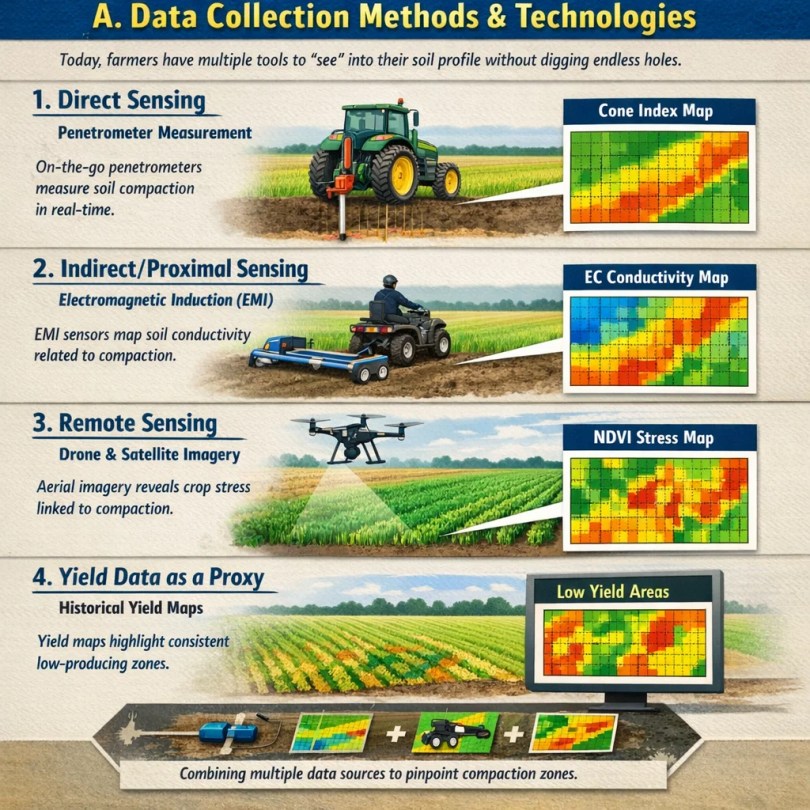
3. Remote Sensing: Satellite and drone imagery can reveal the symptoms of compaction. Areas of stunted crop growth, premature senescence, or elevated canopy temperature (indicating plant stress) often trace back to restricted roots in compacted soil. Analyzing time-series imagery, especially early in the season, can help identify chronic problem zones.

Modern analytical platforms like Solvi, Sentera, or John Deere’s See & Spray Premium can process time-series imagery to identify persistent problem zones that correlate strongly with soil compaction. A 2024 study published in the “Journal of Precision Agriculture” demonstrated that combining three years of drone-collected NDVI data correctly identified 87% of moderate-to-severe compaction zones verified by ground truthing.

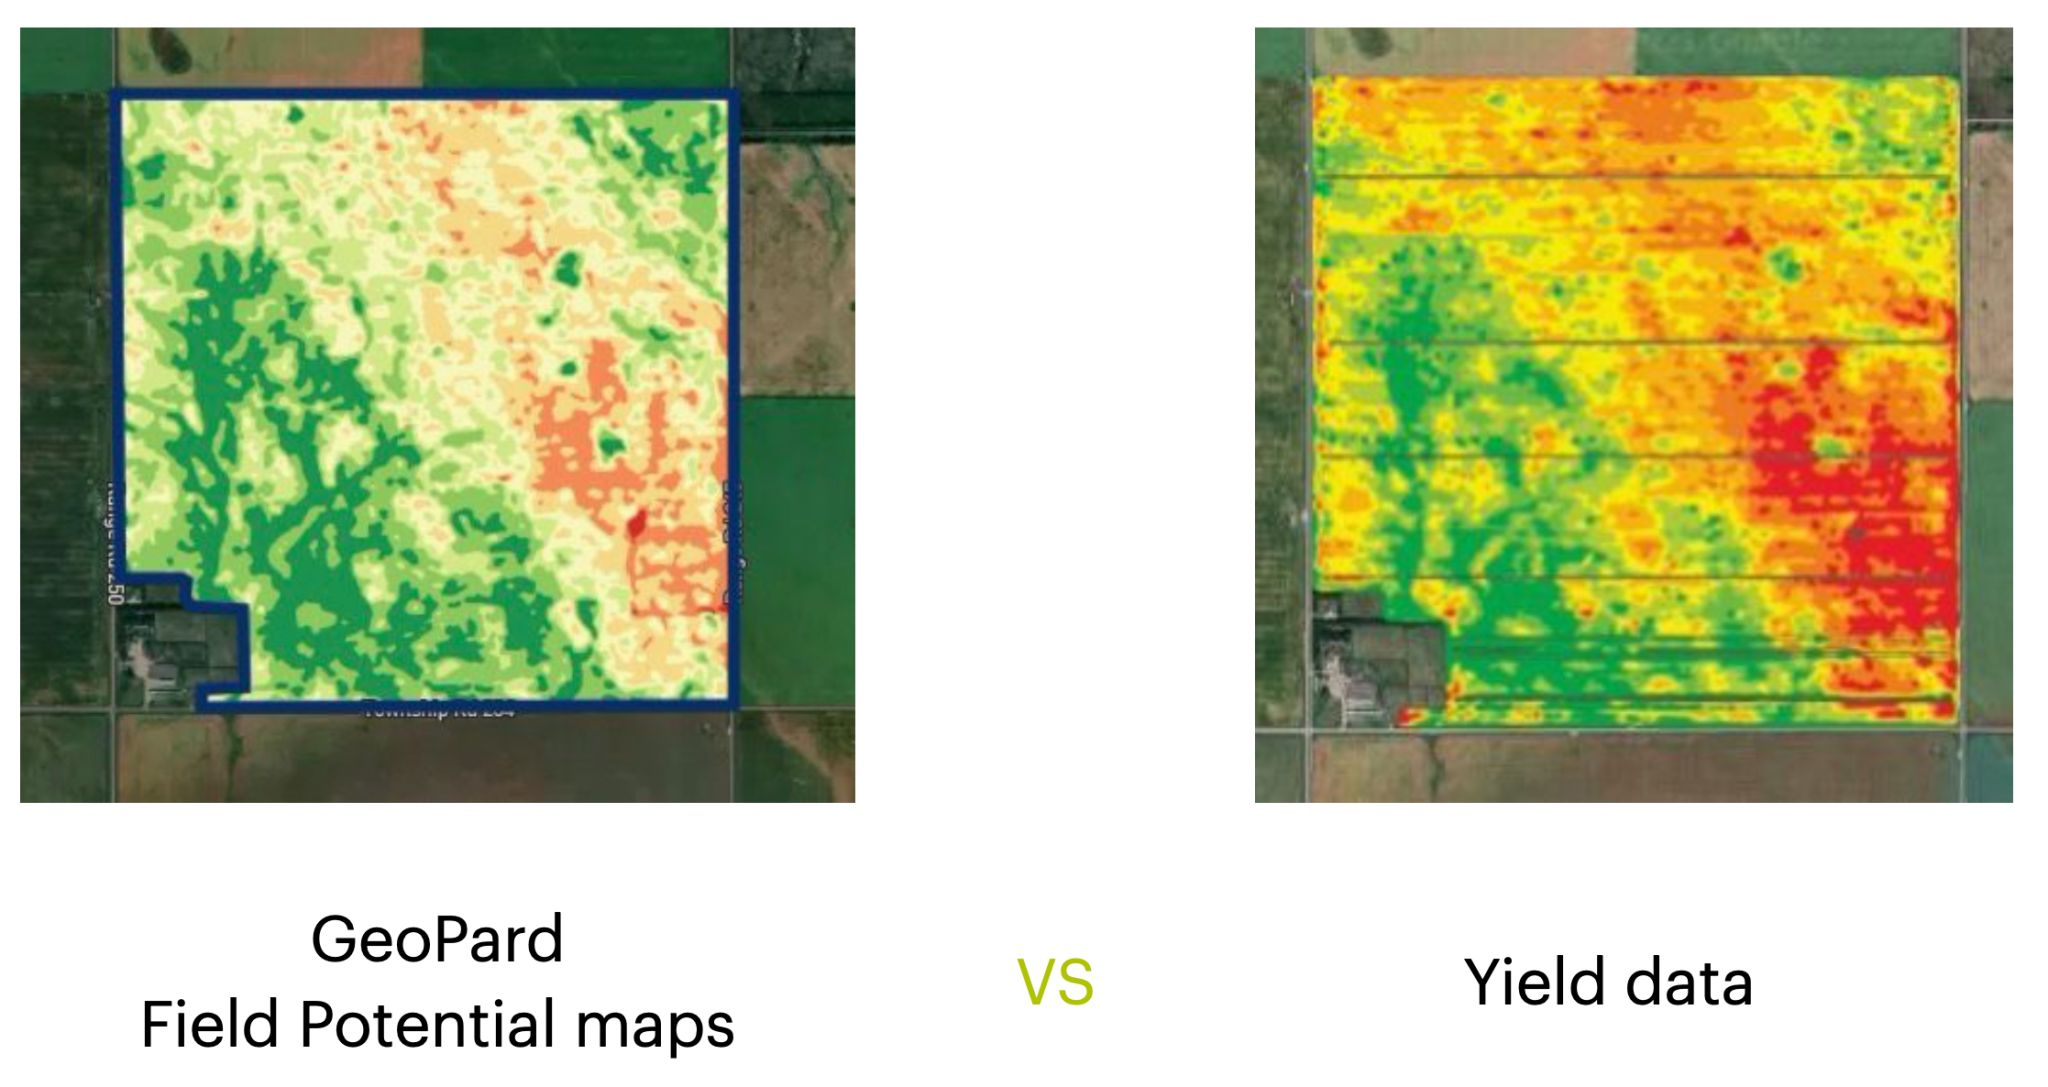
4. Yield Data as a Proxy: Historical yield maps are a valuable, readily available source of clues. Persistent low-yielding spots, particularly in years with adequate rainfall, are frequently caused by undiagnosed subsoil compaction. These “chronic underperformers” on yield maps serve as excellent starting points for targeted compaction investigation. When layered with other data, yield history helps distinguish compaction effects from nutrient deficiencies or disease issues.

B. Creating the Soil Compaction Prescription Map

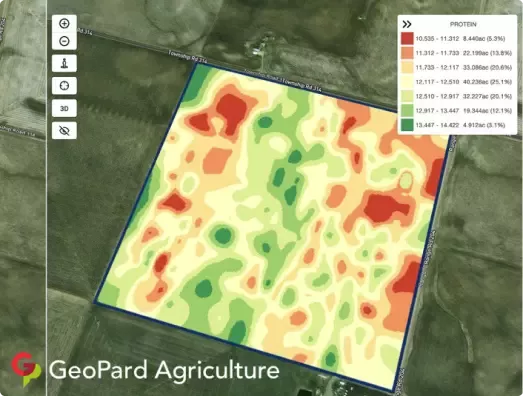
The transition from raw data to an actionable tillage prescription requires sophisticated data fusion and agronomic interpretation. This process typically occurs in agricultural GIS software platforms like Geopard, ArcGIS Agribot, or cloud-based systems such as Climate FieldView or Granular. The most robust prescription maps emerge from integrating multiple complementary data layers:

  • A primary layer from an EMI or penetrometer survey.
  • Historical yield map data for context.
  • A soil type map to differentiate texture-based EC changes from compaction-based changes.
  • Topography data, as lower landscape positions are more prone to compaction.

Using this integrated data, the field is divided into distinct management zones. A simple three-zone system might be:

  • Zone 1: No-Till Preservation Areas (30-50% of many fields): Characterized by low penetration resistance (<300 psi at all depths), good drainage, and stable structure. These areas receive zero tillage to protect soil health and organic matter.
  • Zone 2: Shallow Tillage Zones (30-40% of fields): Exhibiting moderate surface compaction (300-600 psi in top 6 inches) but reasonable subsoil conditions. Targeted for vertical tillage, discing, or shallow cultivation (3-6 inches) to alleviate surface crusting while preserving subsoil structure.
  • Zone 3: Deep Intervention Zones (10-30% of fields): Showing severe subsoil compaction (>600 psi at 8-16 inch depth), often with visible plow pans or traffic layers. Designated for deep ripping, subsoiling, or paraplowing (8-18 inches) to fracture compacted layers and restore vertical porosity.

Creating the Soil Compaction Prescription Map

A critical consideration is soil moisture. All compaction readings must be taken when the soil is near field capacity (moist but not saturated) to ensure accuracy. Data should always be validated with manual penetrometer checks in each suspected zone. For accurate, comparable data, sensing should occur when the soil is near field capacity (the moisture condition after free drainage has occurred but before significant drying). Many leading consultants now recommend “dual-season” sensing—mapping in both spring (typically wetter) and fall (typically drier) to develop a more complete understanding of how compaction manifests under different conditions.

The Execution: Variable Rate Tillage Technology

With a validated prescription map in hand, the next phase involves the physical implementation—translating digital prescriptions into precise mechanical action across the landscape. This requires specialized equipment systems that combine robust tillage implements with sophisticated control technology.

A. Hardware: The “How” of Variable Tillage

Variable Depth Tillage: This is the most common application. Leading manufacturers like John Deere (with their ExactEmerge platform adapted for tillage), Case IH (Early Riser system), Unverferth (Zone Commander), and DuroTech (Intellivator system) offer implements where each shank is mounted on a hydraulic cylinder controlled by the tractor’s hydraulic system. As the tractor moves across the field, the in-cab controller automatically raises or lowers each shank to the depth specified in the prescription map for that exact location.

  • 6 inches where compaction is low,
  • 10–12 inches where there’s moderate compaction,
  • 14+ inches where subsoil hardpan restricts root growth.

In practice, this might mean shanks running at 6 inches in non-compacted zones, automatically extending to 10 inches as they enter a moderately compacted area, then reaching 16 inches in severe hardpan zones—all seamlessly within a single pass. Advanced systems feature “profile-based” control that not only sets maximum depth but controls the depth curve to match specific hardpan characteristics.

Variable Intensity Tillage: Some systems go beyond just depth. They can change the aggressiveness of the tillage action. This might involve automatically engaging or disengaging individual rows of shanks, or switching between different types of tools (e.g., from a deep-cutting coulter to a full-width sweeper) based on the zone.

Variable Intensity Tillage

The most advanced systems, like Väderstad’s adaptive system or the progressive tillage concept from several European manufacturers, can automatically adjust the angle of attack, vibration frequency, or even switch between completely different tool types (e.g., from an inversion plow to a non-inversion subsurface loosener) based on the prescription. While less common in North America, these systems represent the cutting edge of tillage precision.

B. Software & Control: The “Brain” of the Operation

The system is orchestrated from the tractor cab. The prescription map is loaded onto the farm management software (like John Deere Operations Center, CNH AFS, or Trimble Ag Software) on the in-cab display. Using a high-accuracy RTK-GPS signal for precise positioning, the controller knows the tractor’s location within inches. The implement and tractor communicate via the ISO 11783 (ISOBUS) protocol, a universal “plug-and-play” language for agricultural electronics. The workflow is straightforward and this integrated system ensures accuracy and reduces operator fatigue and guesswork:

1. Pre-Operation Planning: The agronomist or farmer finalizes the prescription map, ensuring zones are logically defined with appropriate buffers between depth changes to prevent excessive implement cycling.

2. Equipment Setup and Calibration: The implement is calibrated—depth sensors are verified, hydraulic response times are tested, and the system is put through test cycles to ensure shanks respond correctly to depth commands.

3. Field Execution: The operator simply selects the prescription map, confirms implement connection, and begins field work. The system handles all depth adjustments automatically. The operator monitors system performance, watching for proper shank response and making minor speed adjustments to optimize soil fracturing in different conditions.

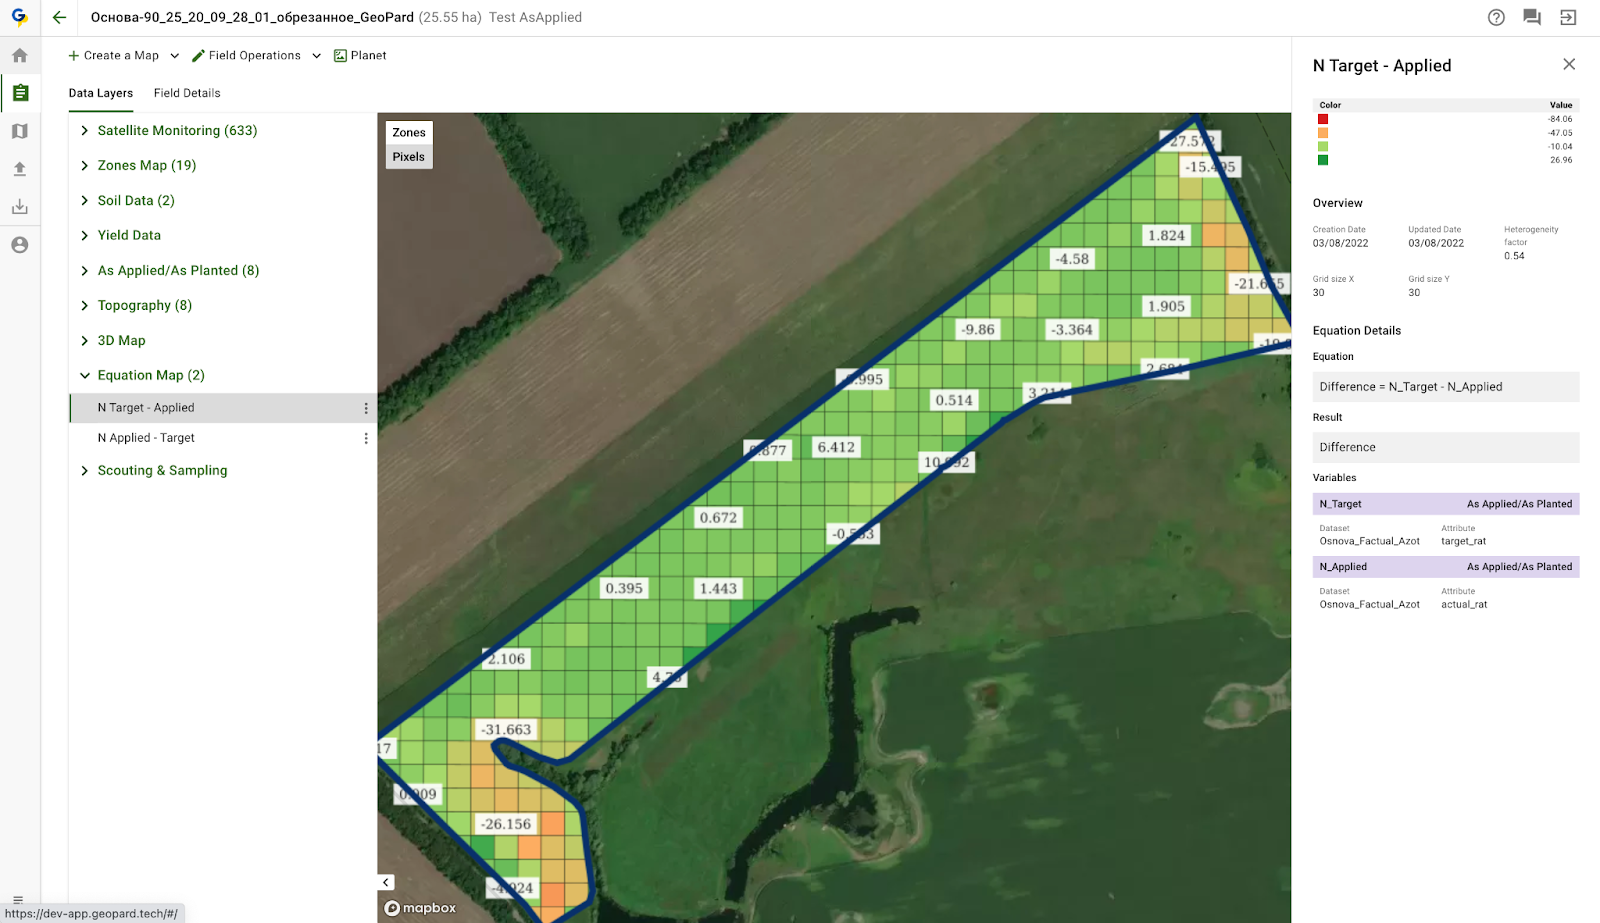
4. Documentation and As-Applied Mapping: As the operation proceeds, the system creates a detailed “as-applied” map showing exactly what depth was applied at every point in the field. This documentation is crucial for evaluating effectiveness and planning future management.

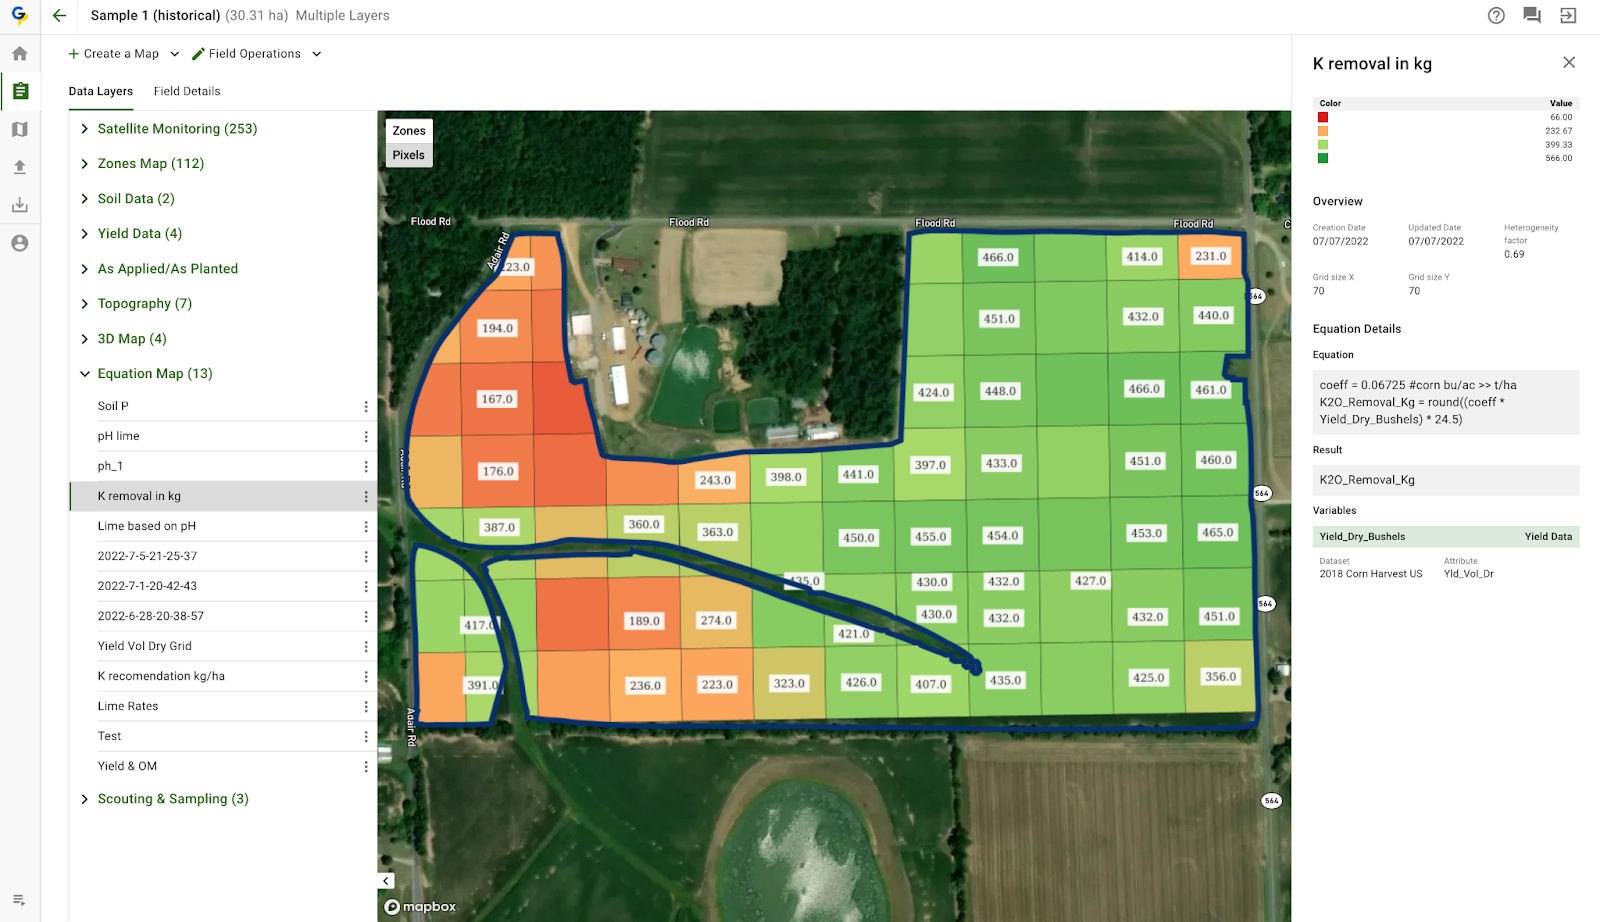
How GeoPard Agriculture Enables Variable Rate Tillage for Soil Compaction

Soil compaction is one of the major constraints to crop productivity, affecting root development, water infiltration, and nutrient uptake. GeoPard Agriculture solves this challenge by enabling data-driven Variable Rate (VR) Tillage based on measured soil compaction at multiple depths. GeoPard’s VR Tillage workflow begins with a Soil Compaction dataset (or equivalent data) collected across the field at multiple depths.

This detailed subsurface information allows growers and agronomists to understand exactly where and how deeply soil compaction exists, rather than relying on assumptions or uniform tillage strategies. Using GeoPard, this data is seamlessly transformed into precise VR Tillage applications, ensuring that tillage depth is adjusted only where necessary.

1. Single-Field VR Tillage Applications

For individual fields, GeoPard provides an interactive, multilingual workflow that guides users step-by-step through the creation of a VR Tillage map. By analyzing soil compaction values at specific depths, GeoPard automatically generates prescriptions that optimize tillage depth across the field—reducing fuel use, equipment wear, and soil disturbance.

GeoPard Single-Field VR Tillage Applications

2. Batch VR Tillage Maps for Multiple Fields

GeoPard also supports batch processing, making it easy to create VR Tillage maps for multiple fields at once. With just a few clicks, users can generate consistent, scalable VR tillage prescriptions across an entire operation—ideal for large farms, service providers, and agronomy teams managing multiple locations.

GeoPard Batch VR Tillage Maps for Multiple Fields

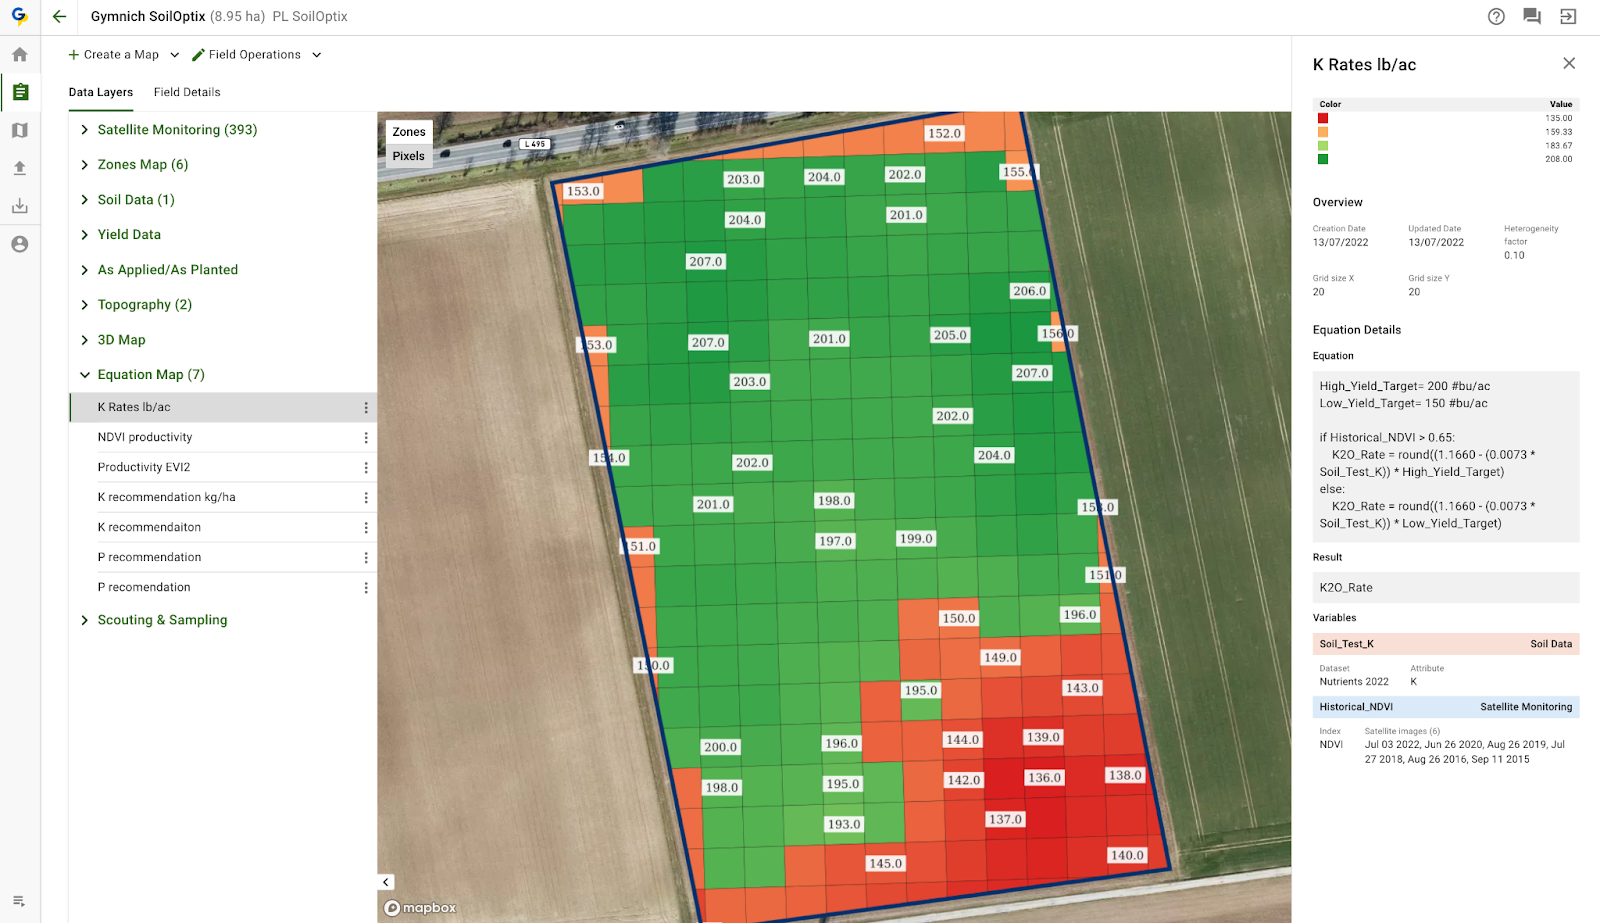
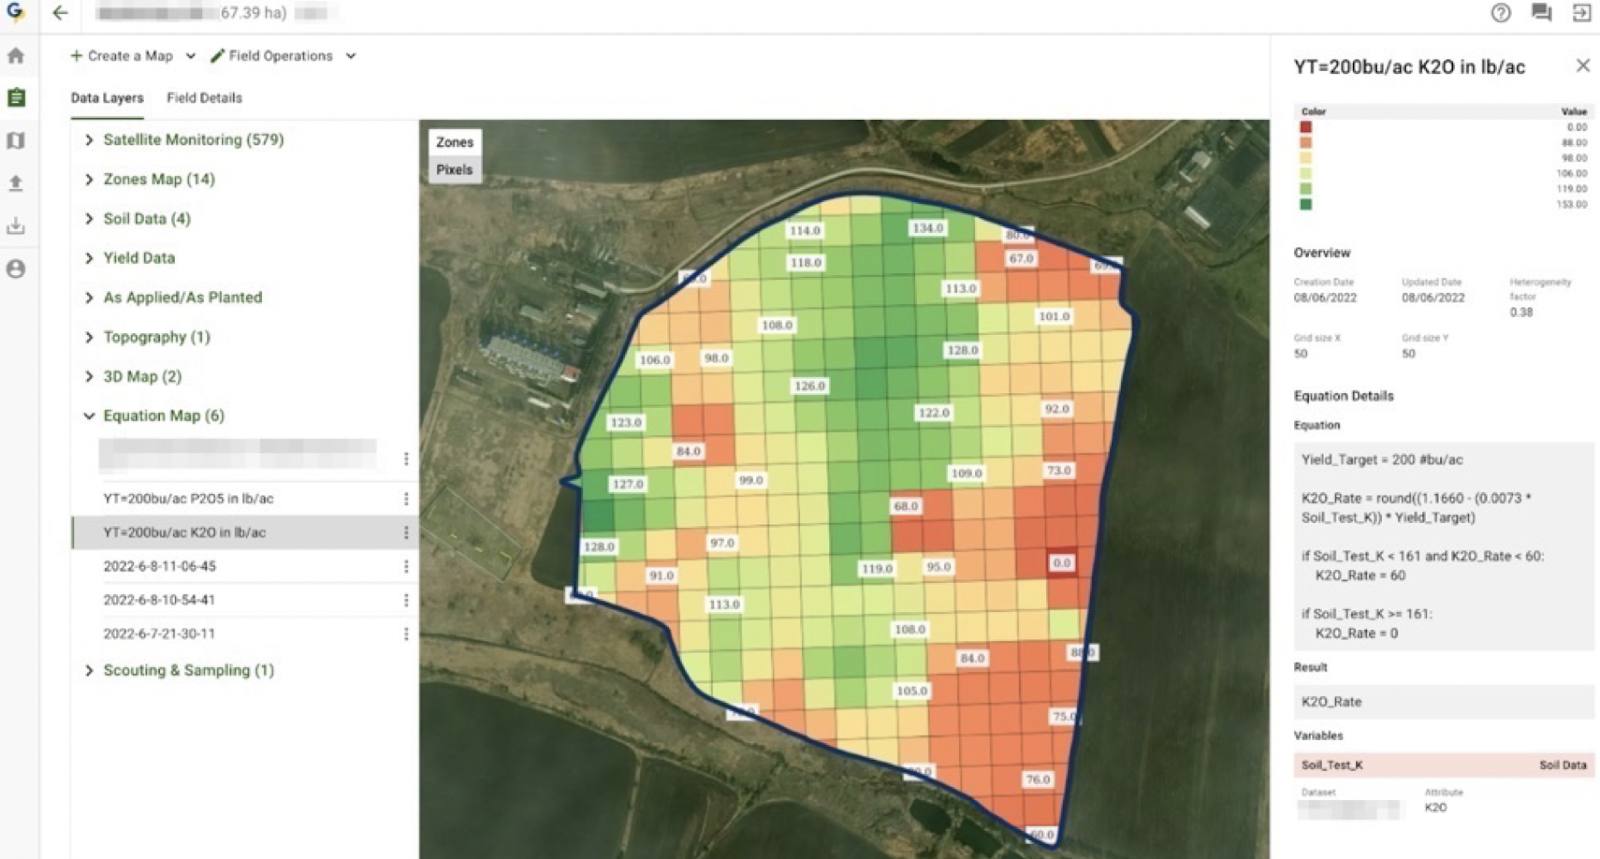
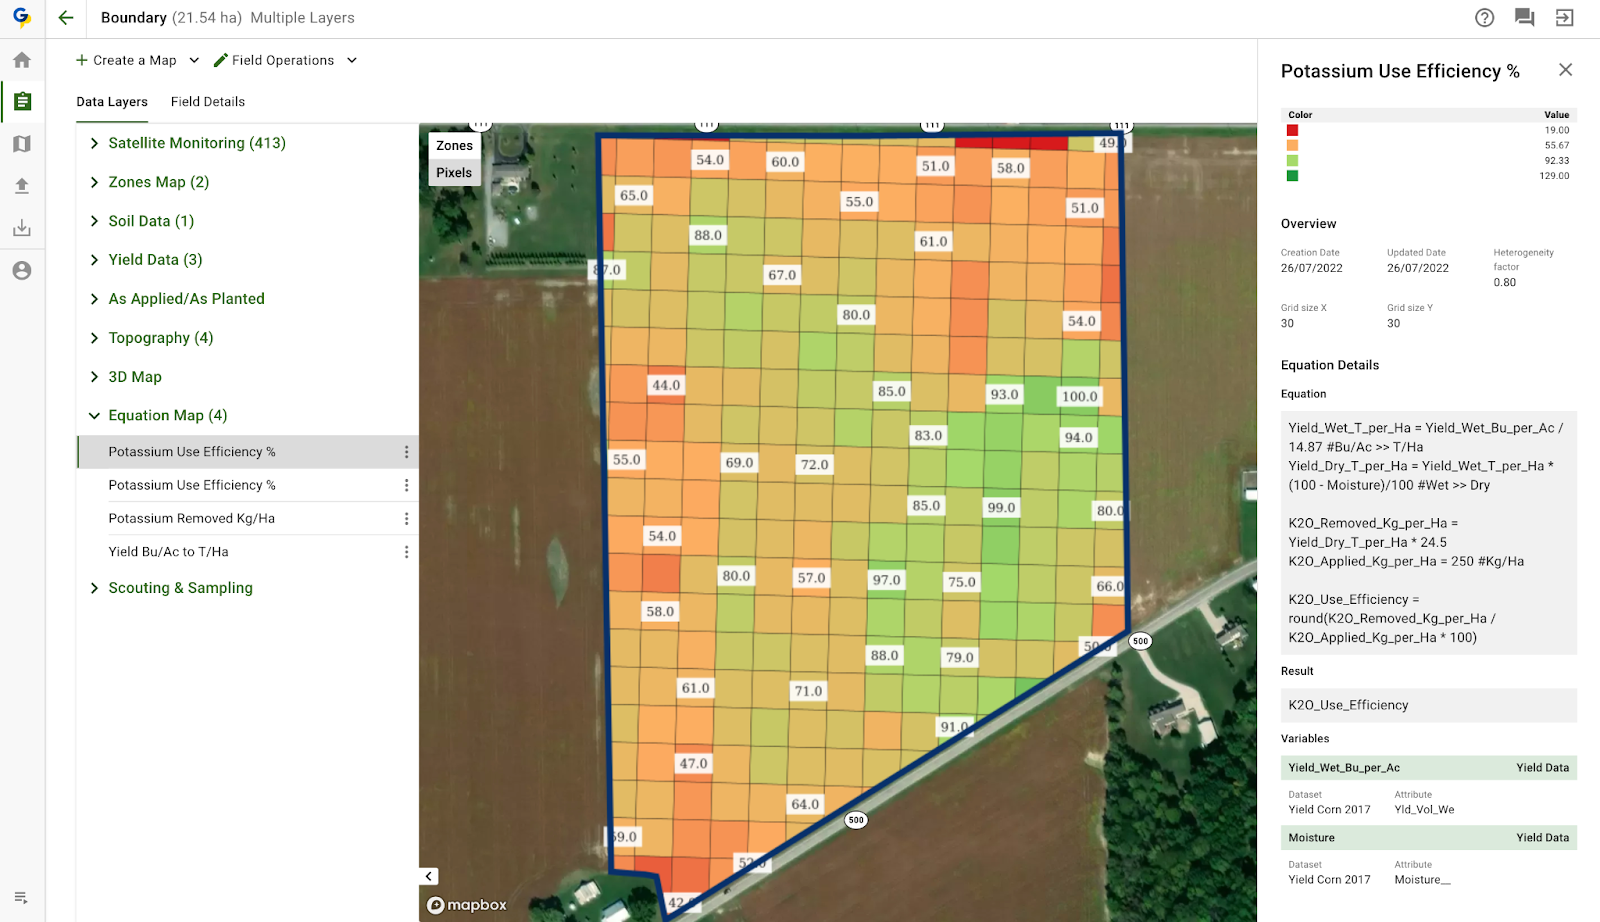
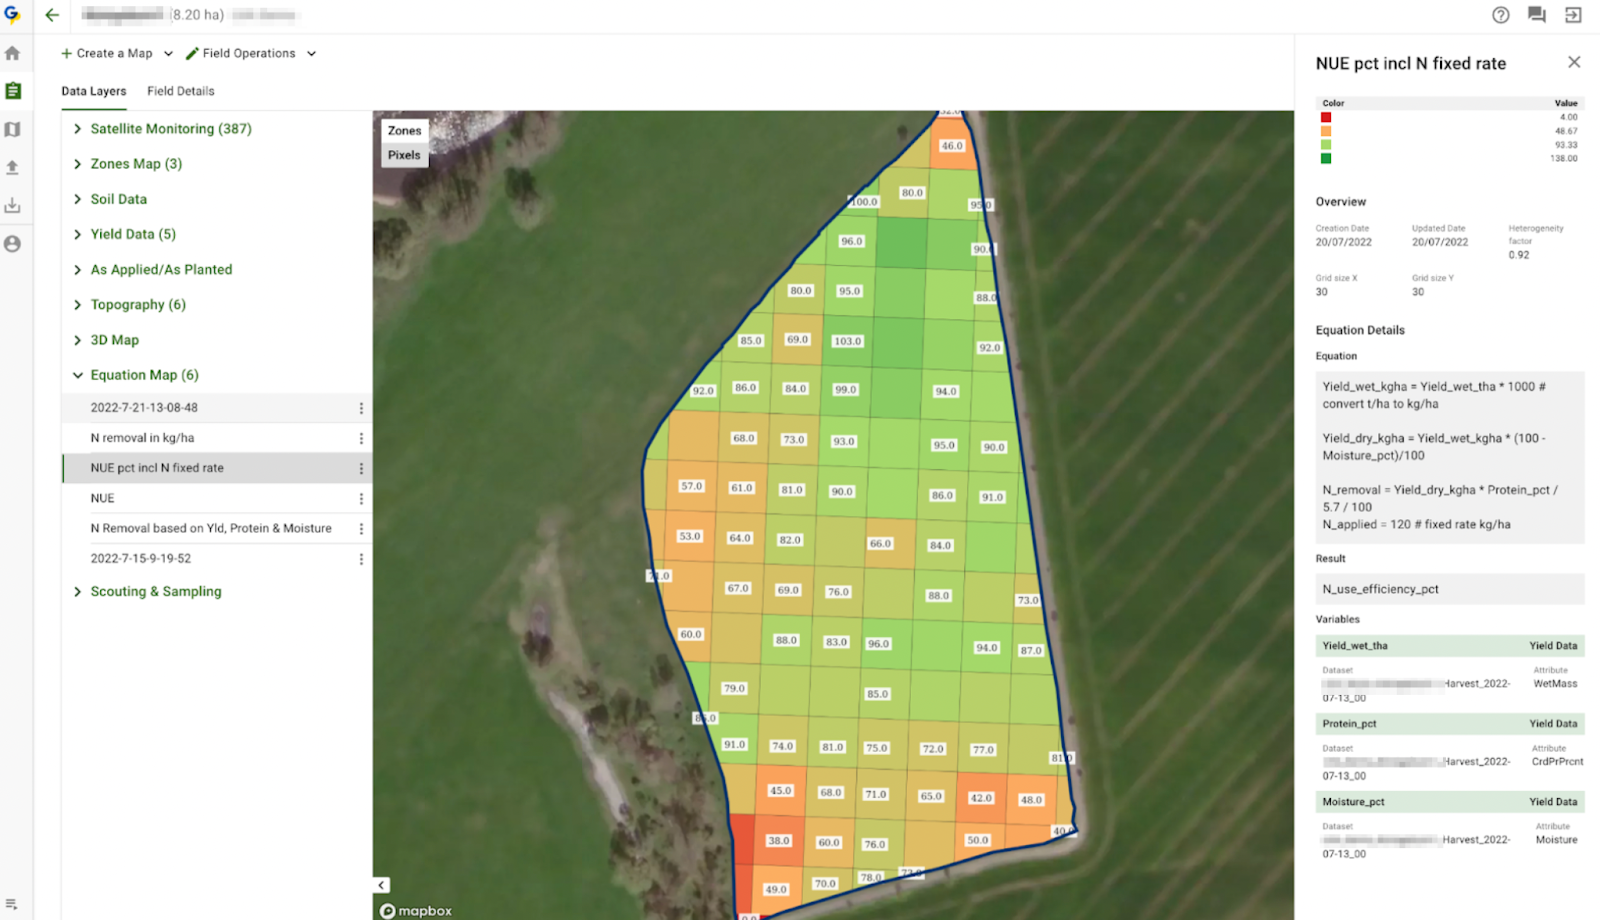
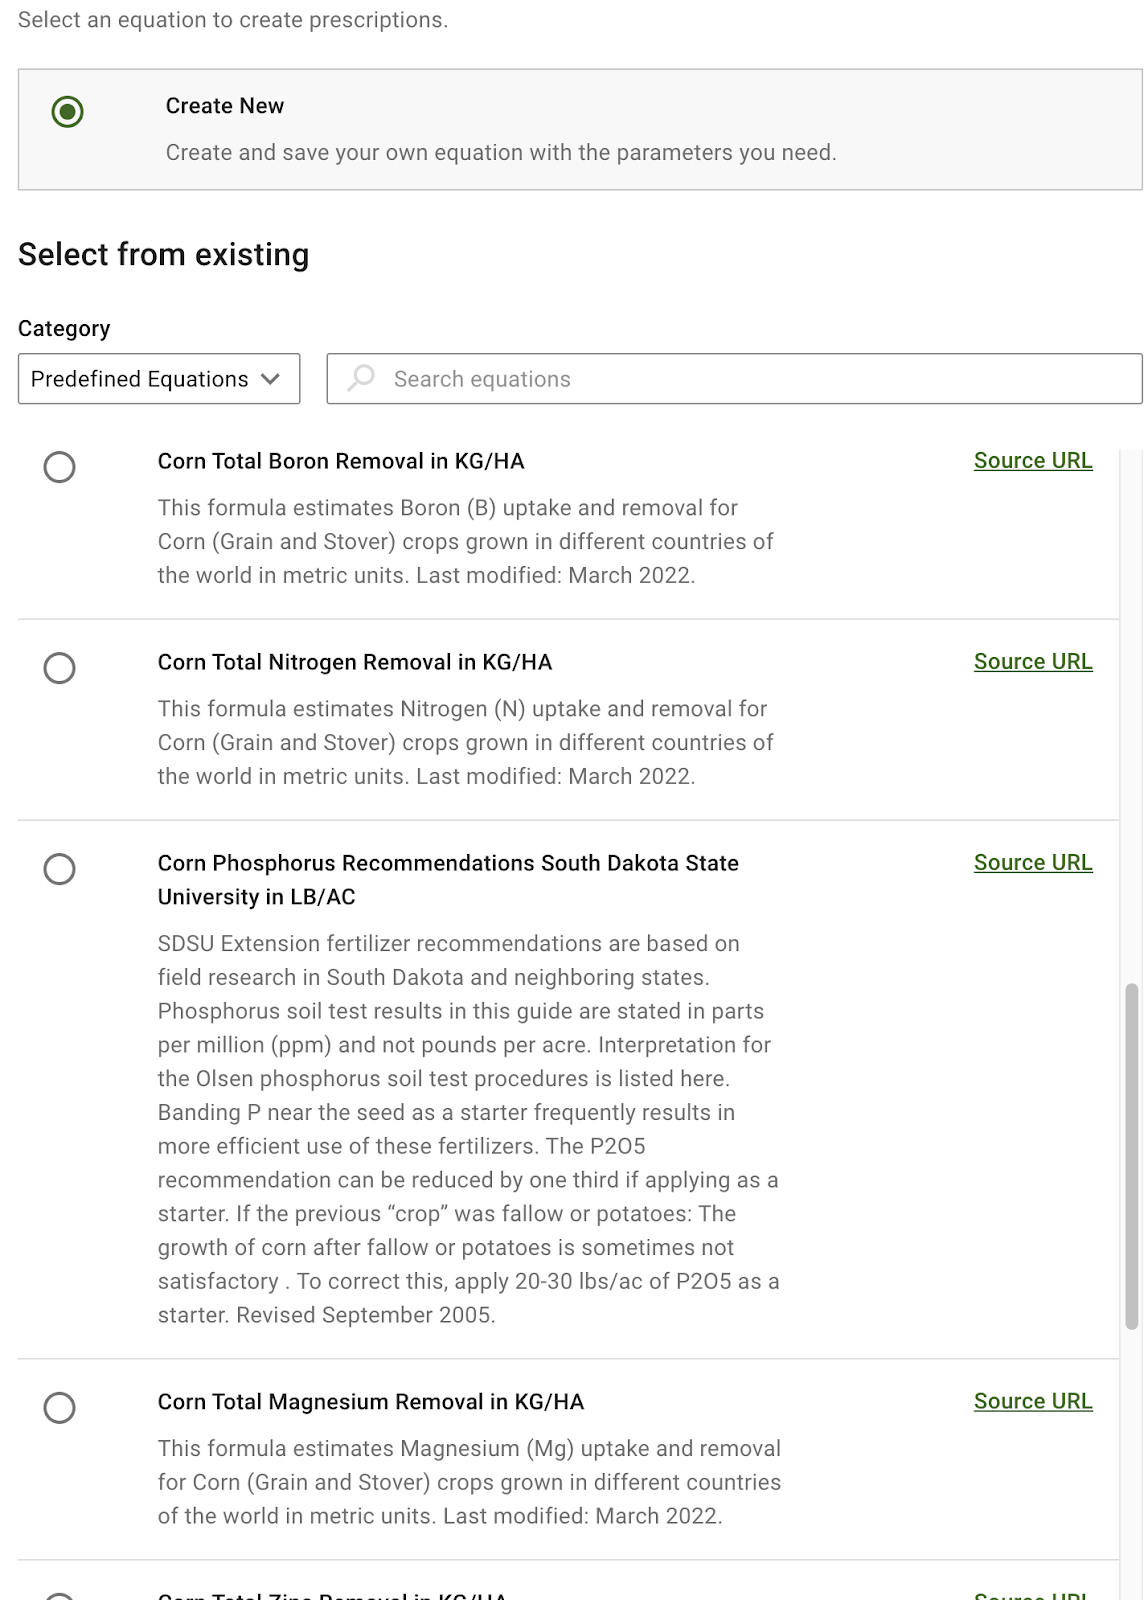
3. Smart Tillage Depth Calculation with Custom Equations

A key strength of GeoPard is its custom equation library, which allows users to define how tillage depth responds to soil compaction values. For example, tillage depth can be calculated based on the 25 cm compaction measurement using a simple, transparent rule:

if pressure < 15:
tillage_depth = 25
elif pressure < 21:
tillage_depth = 27
else:
tillage_depth = 30

This equation—or any variation of it—can be saved and reused in GeoPard, ensuring consistent decision-making while remaining fully customizable to local soil conditions, equipment, and agronomic strategies. By integrating soil compaction data with Variable Rate Tillage technology, GeoPard Agriculture helps growers:

  • Reduce unnecessary deep tillage
  • Improve soil structure and root development
  • Lower fuel and operational costs
  • Protect soil health and long-term productivity

The Benefits: Why Implement This System?

The adoption of compaction-based VRT delivers measurable advantages across multiple dimensions of farm performance. These benefits compound over time, creating what economists call “increasing returns to adoption.”

Agronomic & Environmental Benefits:

1. Enhanced Soil Health: Minimizing disturbance in non-compacted zones protects soil organic matter, microbial communities, and earthworm habitats. This builds long-term resilience. A 2024 study in “Soil Biology and Biochemistry” comparing VRT to uniform tillage found that mycorrhizal fungal colonization of corn roots was 40-60% higher in no-till VRT zones compared to tilled areas, with corresponding improvements in phosphorus uptake efficiency.

2. Reduced Erosion: By leaving approximately 30-50% of field areas undisturbed with surface residue intact, VRT significantly reduces erosion risk. Purdue University field trials (2022-2024) showed that VRT-managed fields absorbed rainfall 2-3 times faster than uniformly tilled fields during 1-inch per hour simulated rainfall events. This reduces surface runoff, decreases erosion, and increases plant-available water by an average of 0.8-1.2 inches per growing season—equivalent to a free irrigation event in many regions.

Furthermore, USDA Natural Resources Conservation Service models estimate that properly implemented VRT can reduce soil loss by 35-55% compared to full-field deep tillage, with corresponding reductions in phosphorus runoff of 40-60%.

benefits and adoption of compaction-based Variable Rate Tillage

3. Optimized Root Zones: Correcting compaction only where it exists allows for uniform root exploration and water infiltration, leading to more even crop emergence and development. University of Illinois research (2023) demonstrated that corn roots in VRT-managed zones reached depths 8-12 inches greater than in uniformly tilled fields, with corresponding improvements in drought resilience.

Economic Benefits:

1. Direct Input Savings: The most immediate economic benefit comes from reduced input consumption. By deeply tilling only the portion of the field that actually needs it, farmers save substantially on:

  • Fuel Consumption: Multiple studies across the Midwest (Iowa State University, 2023; Ohio State University, 2024) document fuel savings of 25-45% on primary tillage operations, translating to $4-8 per acre in direct savings.
  • Labor Requirements: Reduced tillage intensity and area covered decreases labor time by 20-35%.
  • Equipment Maintenance: Reduced hours of operation and less strain on equipment components decreases repair and maintenance costs by an estimated 15-25% annually.

2. Yield Optimization: While eliminating unnecessary tillage preserves yield potential in good areas, addressing compaction in problem areas typically increases yields. Research compiled by the Precision Agriculture Association (2024) shows consistent yield improvements of 8-15% in previously compacted zones following targeted deep tillage. For a typical Midwestern corn field with 20% compaction problem area, this translates to an overall field yield increase of 1.6-3.0%. At $5.00/bushel corn, this represents $12-22 per acre in additional revenue.

A 2024 study from Purdue University Extension demonstrated that targeted subsoiling in compacted zones increased corn yields by an average of 12-18 bushels per acre in those zones, while eliminating unnecessary tillage in good areas preserved their yield potential.

3. Return on Investment (ROI): While the upfront cost for sensors and a compatible VRT implement can range from $20,000 to $80,000, the payback period can be swift. For a 1,000-acre corn and soybean farm, annual fuel and labor savings of $5,000-$8,000, combined with a conservative yield increase of 2-3% from better compaction management, can create an ROI within 3-5 years. The investment also future-proofs equipment for the data-driven era of farming.

Challenges and Practical Considerations

Adopting this technology is not without its hurdles.

Upfront Investment: The cost of sensors, compatible implements, and high-accuracy RTK-GPS guidance is significant and can be a barrier for smaller operations. Farmer cooperatives in regions like the Red River Valley have successfully pooled resources to purchase VRT equipment for member use.

Data Complexity: Turning raw sensor data into an accurate, actionable prescription map requires agronomic expertise. Farmers may need to partner with agronomists or consultants. The learning curve is real but manageable. Most successful adopters emphasize starting with a single demonstration field in year one, expanding to 20-30% of acreage in year two, and full implementation by year three or four.

Critical Timing Considerations: Soil moisture at tillage execution is arguably more critical for VRT than uniform tillage. If soil is too wet, deep tillage in compacted zones will create smearing rather than fracturing. If too dry, excessive energy is required and soil may pulverize. The optimal moisture window—typically when soil is at or slightly below field capacity—may be narrow. Advanced operations use soil moisture sensors and forecasting to identify optimal tillage windows, sometimes operating at night or during unconventional hours to hit the moisture sweet spot.

The Limitations of Corrective Tillage: Perhaps the most important conceptual understanding is that VRT for compaction addresses symptoms. The most sophisticated systems still represent corrective rather than preventive management. Truly sustainable soil management requires integrating VRT with:

  1. Controlled Traffic Farming (CTF): Permanently confining wheel traffic to specific lanes, dramatically reducing future compaction.
  2. Cover Cropping: Building soil structure and organic matter to resist compaction.
  3. Improved Harvest Logistics: Reducing axle loads and avoiding field operations in wet conditions.
  4. Organic Matter Management: Building the “biological glue” that helps soil resist compaction.

Farmers who use VRT as part of a comprehensive soil health system typically find they can reduce the frequency of deep intervention over time as overall soil resilience improves.

Future of Emerging Technological Trends

The future of compaction-based tillage is intelligent and integrated. Emerging trends include the coupling of real-time, on-the-go compaction sensors with implements that adjust depth instantly—creating a true “sense-and-act” system in one pass.

Real-Time, Integrated Sensing and Response: The holy grail of VRT is closing the loop between sensing and action in real time. Prototype systems now in field testing combine ground-penetrating radar or continuous penetrometry with instantly adjustable implements. These “sense-and-act” systems create compaction maps on the first pass and execute tillage on the second pass, or in some advanced prototypes, perform both simultaneously. Companies like AgDNA and some European manufacturers have demonstrated working systems that could commercialize within 3-5 years.

Artificial Intelligence and Machine Learning Optimization: AI is transforming prescription development. Rather than relying solely on human interpretation of data layers, machine learning algorithms can now identify complex, nonlinear relationships between soil properties, historical management, and compaction outcomes. Systems like IBM’s Watson for Agriculture and several startup platforms can analyze decades of field data to predict where compaction is likely to (re)develop, enabling preventive rather than reactive management.

Autonomous Tillage Platforms: The convergence of autonomy and VRT promises to revolutionize tillage economics and timing. Small, lightweight autonomous tillage robots could work in optimal soil moisture conditions 24/7 without operator fatigue. European trials with companies like Agrointelli and FarmDroid have shown promising results with solar-powered autonomous implements performing targeted tillage at precisely the right soil moisture.

Integration with Carbon Farming and Ecosystem Services Markets: As carbon credit markets mature, precisely documented reductions in tillage intensity through VRT create verifiable carbon sequestration claims. Early-adoption data suggests VRT can reduce soil carbon loss by 0.2-0.4 metric tons per acre annually compared to full-field tillage. When carbon markets reach $50-100 per metric ton (as projected by several analysts for 2030), this could add $10-40 per acre in ecosystem service payments to the VRT value proposition.

Zaključak

In conclusion, variable rate tillage guided by soil compaction data represents a fundamental paradigm shift. It moves soil management from a reactive, uniform practice to a proactive, prescription-based strategy. It acknowledges the inherent variability of the land and treats each square foot according to its specific need. By adopting this approach, farmers position themselves at the forefront of site-specific conservation agriculture, making strategic decisions that enhance both the profitability of their business and the long-term sustainability of their most valuable asset: the soil. It is a powerful step toward farming that is not only more precise but also more intelligent.

Optimizacija upotrebe dušika u durum pšenici pomoću strategija temeljenih na NNI i NDVI kartama

Durum pšenica, temelj mediteranske poljoprivrede i globalno ključna kultura za proizvodnju tjestenine, suočava se s hitnim izazovom: neodrživom upotrebom dušičnih (N) gnojiva.

Iako je dušik neophodan za maksimalno povećanje prinosa, njegova prekomjerna primjena ima ozbiljne ekološke posljedice, uključujući onečišćenje podzemnih voda, emisije stakleničkih plinova i degradaciju tla.

Revolucionarno četverogodišnje istraživanje (2018. – 2022.) provedeno u Ascianu u Italiji i objavljeno u časopisu European Journal of Agronomy, nastojalo je odgovoriti na ovu krizu rigoroznim usporedbom konvencionalnog upravljanja dušikom s naprednim tehnikama precizne poljoprivrede.

Istraživanje se usredotočilo na tri strategije vođene satelitom – Indeks dušične ishrane (NNI), proporcionalni NDVI (NDVIH) i kompenzacijski NDVI (NDVIL) – u usporedbi s tradicionalnom jednolikom primjenom dušika. Nalazi ne samo da otkrivaju put prema održivoj kultivaciji durum pšenice, već također s izvanrednom preciznošću kvantificiraju ekonomske i ekološke kompromise svake metode.

Metodologija: Precizna poljoprivreda susreće satelitsku tehnologiju

Eksperiment se odvijao tijekom četiri uzastopne sezone rasta u brežuljcima Toskane, regiji koja je simbol mediteranskog uzgoja pšenice. Istraživači su testna polja podijelili na parcele podvrgnute četirima različitim strategijama upravljanja dušikom.

Konvencionalni pristup “fiksne stope” slijedio je regionalne agronomske smjernice, primjenjujući 150 kg dušika po hektaru godišnje. Nasuprot tome, precizne metode koristile su satelitsku snimku Sentinel-2 – misiju Europske svemirske agencije koja pruža multispektralne podatke visoke razlučivosti (10 metara) – za prostorno i vremenski prilagodbu primjene N.

NNI strategija se istaknula izračunavanjem statusa dušika u usjevima u stvarnom vremenu pomoću validiranog algoritma koji integrira indekse lisne površine i procjene biomase. NDVIH je proporcionalno raspodijelio N na temelju gustoće vegetacije (Indeks razlike vegetacije), dok je NDVIL usvojio kompenzacijski pristup, usmjeravajući dodatni N u zone s niskom vegetacijom.

NNI nadmašuje konvencionalne strategije i strategije temeljene na NDVI-u

Tijekom studijskog razdoblja, NNI metoda pokazala je nenadmašnu učinkovitost. Smanjila je korištenje dušika za 20%, primjenjujući samo 120 kg po hektaru u usporedbi s konvencionalnih 150 kg, dok je održala statistički ekvivalentne prinose zrna od 4,8 tona po hektaru naspram 4,7 tona pri paušalnom uzgoju.

Sadržaj proteina — ključni pokazatelj kvalitete za krajnju upotrebu durum pšenice u proizvodnji tjestenine — dosegao je 13,2%s NNI, neznatno nadmašivši 12,5% konvencionalne metode.

Ovo marginalno povećanje proteina rezultiralo je značajnim industrijskim prednostima: tijesto proizvedeno od NNI-optimizirane pšenice pokazalo je W-indeks (mjeru čvrstoće glutena) od 280, daleko nadmašujući 240 zabilježenih kod konvencionalne pšenice.

Takva poboljšanja proizlaze iz sposobnosti NNI da uskladi dostupnost dušika s razvojnim fazama usjeva, osiguravajući optimalnu raspodjelu hranjivih tvari tijekom nalijevanja zrna.

Skriveni troškovi pristupa temeljenih na NDVI-u

Strategije temeljene na NDVI-ju, iako inovativne, otkrile su kritična ograničenja. Proporcionalni NDVIH pristup, koji je dodjeljivao N na temelju zelenila krošanja, povećao je sadržaj proteina na 13,8%, ali je smanjio prinose na 4,5 tone po hektaru—pad od 6% u usporedbi s NNI-jem.

Ovaj se paradoks pojavio zbog pretjeranog gnojenja u zonama već bogatima dušikom, gdje je pretjeran vegetativni rast preusmjerio energiju iz proizvodnje žita.

Metoda kompenzacijskog NDVIL-a, osmišljena za poticanje područja s problematičnim usjevima, postigla je najveći prinos (5.1 tona/ha), ali uz visoku ekološku cijenu: zahtijevala je 160 kg dušika po hektaru, što je dovelo do porasta emisija dušikovog oksida od 33% (1.4 kg ekvivalenta CO2 po kg zrna) u usporedbi s 0.8 kg kod NNI-a.

Ove emisije imaju dubok značaj – dušični oksid ima 265 puta veći potencijal globalnog zagrijavanja od ugljičnog dioksida tijekom stoljeća.

Ekonomski gledano, NNI (integrirana proizvodnja) pokazao se kao jasni pobjednik. Poljoprivrednici koji su usvojili ovu strategiju postigli su neto povrat od 220 eura po hektaru,% 12% viši od 196 eura kod konvencionalne metode. Prednost je proizašla iz dva faktora: smanjenih troškova gnojiva (98 €/ha u usporedbi sa 123 €/ha) i premijskih cijena za žitarice s visokim udjelom proteina.

Studija je predstavila novu metriku “društvenog troška” - sveobuhvatnu mjeru ekološke štete, zdravstvenih utjecaja onečišćenja vode i dugoročne degradacije tla. Društveni trošak NNI-a iznosio je 42 eura po hektaru, daleko nadmašen konvencionalnom poljoprivredom od 60 eura. NDVIH i NDVIL zabilježili su srednje troškove od 58, odnosno 55 eura, odražavajući njihovu neuravnoteženu distribuciju dušika.

Dubljim zaronom u ekološke pokazatelje, učinkovitost korištenja dušičnih gnojiva (NfUE) – postotak primijenjenog N pretvorenog u urodivo zrno – dosegnula je 65% pod NNI, što je značajno poboljšanje u odnosu na 52% učinkovitost konvencionalnih metoda. Ovaj skok pretvorio se u 18% smanjenje ispiranja nitrata, štiteći lokalne vodonosnike od onečišćenja.

Tijekom četverogodišnje studije, polja pod NNI izgubila su samo 12 kg dušika po hektaru godišnje ispiranjem, u usporedbi s 22 kg na konvencionalnim parcelama. Za usporedbu, EU Direktiva o nitratima propisuje koncentracije nitrata u podzemnoj vodi ispod 50 mg/L — prag koji je premašen u 30% konvencionalnih parcela, ali samo u 8% područja kojima upravlja NNI.

Skaliranje NNI: Izazovi i intervencije politike

Istraživanje je također osvijetlilo skrivene klimatske prednosti. Koristeći metodologiju procjene životnog vijeka (LCA), tim je izračunao da je ugljični otisak NNI-a iznosio ukupno 0,8 kg CO2-ekvivalenta po kg žita, što je 33% manje nego u konvencionalnoj poljoprivredi od 1,2 kg.

Ovo smanjenje prvenstveno proizlazi iz smanjene emisije u proizvodnji gnojiva (1,2 kg CO2-eq/kg izbjegnutog N) i nižeg ispuštanja dušikovog oksida iz tla. Ako se proširi na 2,4 milijuna hektara poljoprivrednog zemljišta za durum pšenicu u EU, široko usvajanje NNI moglo bi smanjiti godišnje emisije za 960.000 metričkih tona ekvivalenta CO2—što je jednako uklanjanju 208.000 automobila s cesta.

Međutim, studija upozorava na gledanje precizne poljoprivrede kao na lijek za sve. Uspjeh NNI metode ovisi o neprekidnom pristupu visokokvalitetnim satelitskim podacima i naprednim strojevima sposobnim za primjenu varijabilnom brzinom – infrastrukturne praznine u zemljama u razvoju.

Na primjer, sateliti Sentinel-2 ponovno snimaju svaku lokaciju svakih pet dana, ali oblačnost tijekom ključnih faza rasta može ometati prikupljanje podataka. Nadalje, algoritmi zahtijevaju kalibraciju na lokalne uvjete; u ovoj studiji, pragovi NNI fino su podešeni za mediteranske klime, postižući 92% točnosti u predviđanju statusa dušika.

Primjena modela na sušna područja ili teška glinovita tla bez ponovne kalibracije mogla bi smanjiti točnost na 70–75%.

Ljudski faktor pokazuje se jednako ključnim. Poljoprivrednici koji prelaze na NNI trebaju obuku za interpretaciju spektralnih indeksa — na primjer, razumijevanje da NDVI vrijednosti iznad 0.7 često signaliziraju pretjeranu vegetaciju i opravdavaju smanjenje N.

Istraživački tim procjenjuje da bi povećanje pismenosti poljoprivrednika o preciznim alatima za 10% moglo povećati NfUE za 4–6 postotnih bodova. Političke intervencije će vjerojatno biti neophodne: subvencioniranje senzora za tlo, financiranje radionica koje vode agronomi i poticanje zadruga na dijeljenje strojeva mogli bi demokratizirati pristup.

Gledajući unaprijed, implikacije studije sežu daleko izvan durum pšenice. NNI okvir, kada bi se prilagodio usjevima poput kukuruza ili riže, mogao bi riješiti problem 60 milijuna tona viška dušika koji se primjenjuje globalno svake godine – ključni cilj UN-ovih Ciljeva održivog razvoja.

Početna ispitivanja na španjolskim poljima ječma pokazuju sličnu stabilnost prinosa s 18% manje dušika, što sugerira primjenjivost na druge usjeve. Za istraživače, integracija strojnog učenja sa satelitskim podacima predstavlja obećavajuću granicu: rani modeli sada mogu predvidjeti potrebe za dušikom s 95% točnosti 30 dana prije primjene, omogućujući proaktivno umjesto reaktivnog upravljanja.

Zaključak

Zaključno, ovo istraživanje nadilazi akademske krugove, nudeći nacrt za usklađivanje poljoprivredne produktivnosti sa zdravljem planeta.

Smanjenjem upotrebe dušika za 20%, povećanjem zarade poljoprivrednika za 12%i drastičnim smanjenjem emisija stakleničkih plinova za trećinu, NNI metoda pokazuje da održivost i profitabilnost nisu međusobno isključive. Kako klimatske promjene pojačavaju suše i destabiliziraju sezone rasta, ovakve precizne strategije pokazat će se neophodnima.

Izazov sada leži u pretvaranju ove znanstvene potvrde u stvarnu akciju – kroz reformu politike, demokratizaciju tehnologije i promjenu paradigme u načinu na koji gledamo na gnojiva: ne kao na grube alate, već kao na precizne instrumente u potrazi za sigurnošću opskrbe hranom.

ReferencaFabbri, C., Delgado, A., Guerrini, L., & Napoli, M. (2025). Strategije precizne gnojidbe dušikom za durum pšenicu: evaluacija održivosti pristupa temeljenih na NNI i NDVI kartama. European Journal of Agronomy, 164, 127502.

How To Calculate Fertilizer Uptake For Corn Field Based On Yield Dry Value?

Fertilizer management is a crucial aspect of successful corn production. Properly calculating fertilizer uptake based on yield dry value ensures that crops receive the necessary nutrients to maximize yield while minimizing costs and environmental impacts.

What is Fertilizer Uptake?

Fertilizer uptake involves the absorption of nutrients by plant roots from the soil. These nutrients include macronutrients such as nitrogen (N), phosphorus (P), and potassium (K), as well as micronutrients like zinc, iron, and manganese.

Meanwhile, the efficiency of this process depends on several factors, including soil health, fertilizer type, application methods, and environmental conditions. Corn, being a high-demand crop, requires substantial amounts of nutrients to achieve its full yield potential. Efficient fertilizer uptake ensures that the corn plant receives adequate nutrition throughout its growth stages, from germination to maturity.

However, it’s important to note that excessive or improper use of fertilizers can have detrimental effects on both the crop and the environment. Over-fertilization can lead to nutrient leaching into water bodies, causing pollution and eutrophication. It can also result in nutrient imbalances in the soil, negatively impacting soil health and future crop cycles.

Why It’s So Important?

Adequate nutrient uptake promotes vigorous plant growth by ensuring that nitrogen supports leaf and stalk development, phosphorus aids in root growth and energy transfer, and potassium strengthens the plant’s resistance to disease and stress.

What is Fertilizer Uptake

Furthermore, efficient nutrient absorption directly correlates with higher yields, enabling the corn plant to produce more kernels per cob and more cobs per plant. This is particularly important for corn that is used for human consumption, as it directly affects the food’s caloric and nutritional content. Studies have shown that optimized fertilizer use can increase corn yields by 20-30%.

Moreover, nutrient availability also affects the overall quality of the corn crop. Sufficient potassium levels enhance the size and weight of the kernels, while adequate nitrogen contributes to protein content, which is vital for both animal feed and human consumption. Corn plants with access to balanced nutrients can photosynthesize more effectively, leading to better growth and higher biomass production.

What Is Corn Yield and Dry Matter Content?

Corn, a staple crop in many parts of the world, is essential for food, feed, and industrial products. Two critical aspects of corn production are yield and dry matter content. These metrics are vital for evaluating crop performance and determining the economic value of the harvest.

1. Corn Yield

Corn yield refers to the amount of harvested crop produced per unit of land area. It is a crucial metric for farmers, agronomists, and the agricultural sector as it directly correlates with the efficiency and profitability of corn production.

The typical measurement unit for corn yield in the United States is bushels per acre (bu/acre). One bushel of corn is equivalent to 56 pounds (approximately 25.4 kilograms) of shelled corn at standard moisture content (15.5%).

What Is Corn Yield and Dry Matter Content

The process of estimating corn yield is methodical and involves several components, including the number of plants per acre, ears per plant, rows per ear, kernels per row, and kernel weight. These components are measured during the growing season using the Yield Component Method, which provides a systematic approach to predict the potential harvest.

2. Dry Matter

Dry matter content in corn refers to the portion of the corn that remains after all the water content has been removed. It is a vital indicator of the quality and nutritional value of the corn, especially when used for silage. The dry matter content is significant because it affects the storage, processing, and feeding value of the corn.

For instance, research has shown that an increase in total tract starch digestibility occurs when corn silage is between 32 and 40 percent dry matter, compared to unprocessed corn silage.

The dry matter content also plays a pivotal role in the overall growth and development of the corn plant. It is involved in nutrient accumulation and partitioning, which are essential for the plant’s productivity. Understanding the dynamics of dry matter accumulation can help farmers and agronomists make informed decisions about irrigation, fertilization, and harvesting times.

How To Calculate Fertilizer Uptake For Corn Field? Step by Step Guide

Corn, one of the most widely cultivated crops, is a staple in the global food supply. To achieve optimal yields, understanding the precise fertilizer requirements based on the yield’s dry value is crucial.

By determining the nutrient requirements, farmers can apply the right amount of fertilizers. However, calculating fertilizer uptake for a corn field based on yield dry value involves understanding the nutrient removal rates by the crop.

Here is a step-by-step guide to calculating fertilizer uptake for corn fields based on yield dry value.

Step 1: Determine the Corn Yield

First, you need to know the corn yield. This is typically measured in bushels per acre (bu/acre). For dry corn, the yield is often adjusted to a standard moisture content of 15.5%.

Step 2: Convert Yield to Dry Matter

Corn grain is typically considered to be 85% dry matter. If you have the yield in bushels per acre, you can convert it to pounds of dry matter per acre.

  • Dry Matter (lb/acre) = Yield (bu/acre) × 56 lb/bu × 0.85

Step 3: Nutrient Removal Rates

Corn plants require essential nutrients like nitrogen (N), phosphorus (P), and potassium (K) for growth. The nutrient removal rates per unit of dry yield can be found in agronomic guidelines or research publications. Typical values are:

  • Nitrogen (N): 1.2 lbs per bushel
  • Phosphorus (P2O5): 0.44 lbs per bushel
  • Potassium (K2O): 0.29 lbs per bushel

guide to calculating fertilizer uptake for corn fields based on yield dry value

Step 4: Calculate Total Nutrient Uptake

Using the yield and the nutrient removal rates, calculate the total nutrient uptake for each nutrient.

  • Total Nitrogen Uptake (lb/acre) = Yield (bu/acre) × 1.2
  • Total Phosphorus Uptake (lb/acre) = Yield (bu/acre) × 0.44
  • Total Potassium Uptake (lb/acre) = Yield (bu/acre) × 0.29

Step 5: Determine Fertilizer Requirement

Depending on the efficiency of your fertilizer application and the nutrient availability in your soil, you might need to adjust these values. Soil tests can help determine the existing nutrient levels and the appropriate fertilizer amounts.

If you assume 100% efficiency (which is rarely the case), the fertilizer requirement would be equal to the nutrient uptake. However, due to losses and other factors, you typically apply more than the calculated uptake.

Example Calculation

Let’s assume a corn yield of 200 bu/acre:

Convert Yield to Dry Matter (optional for nutrient calculations):

  • 200 bu/acre × 56 lb/bu × 0.85 = 9520 lb /acre of dry matter

Calculate Nutrient Uptake:

  • Nitrogen: 200bu/acre × 1.2 = 240 lb N/acre
  • Phosphorus: 200bu/acre × 0.44 = 88 lb P2O5/acre
  • Potassium: 200bu/acre × 0.29 = 58 lb K2O/acre

How Adjusting Fertilizer Application Improve Yield?

Based on the calculated nutrient uptake and crop response, farmers can adjust their fertilizer application rates to meet the specific needs of their crops. However, several critical factors must be considered in this process:

1. Soil Nutrient Levels

Conducting regular soil tests is essential for determining existing nutrient levels and soil health. Soil tests provide a snapshot of nutrient availability, which can inform fertilizer application rates. For instance, if soil tests reveal high phosphorus levels, farmers can reduce or eliminate phosphorus fertilizers, focusing on other nutrients the soil lacks. Key steps include:

  • Baseline Testing: Establish a baseline by conducting soil tests before planting. This helps determine the initial nutrient levels and identifies any deficiencies that need to be addressed.
  • Seasonal Testing: Perform soil tests at various stages of the growing season to monitor changes in nutrient levels and adjust fertilizer applications accordingly.

Soil Nutrient Levels Conducting regular soil tests is essential

2. Fertilizer Efficiency

Not all applied fertilizer is utilized by crops; some may be lost to the environment through processes like leaching, runoff, or volatilization. To enhance fertilizer efficiency:

  • Precision Application: Utilize precision agriculture technologies, such as GPS-guided equipment and variable rate technology (VRT), to apply fertilizers more accurately and efficiently. This reduces waste and ensures nutrients are delivered where they are needed most.
  • Slow-Release Fertilizers: Consider using slow-release or controlled-release fertilizers that provide a steady supply of nutrients over time, improving nutrient uptake efficiency.

3. Environmental Impact

Sustainable fertilizer application practices are crucial for protecting the environment. Improper application can lead to nutrient runoff and leaching, which can contaminate water bodies and harm ecosystems. To minimize environmental impact:

  • Buffer Zones: Establish buffer zones around water bodies to reduce the risk of nutrient runoff. Vegetated buffers can help absorb excess nutrients before they reach water sources.
  • Timing and Weather Considerations: Apply fertilizers during periods of low rainfall and avoid application before heavy rains to reduce the risk of nutrient runoff. Soil moisture conditions should also be considered to optimize nutrient uptake.

4. Crop-Specific Nutrient Needs

Different crops have varying nutrient requirements. Understanding these needs is essential for formulating an appropriate fertilizer strategy.

Crop-Specific Nutrient Needs Different crops have varying nutrient requirements

For example, corn typically requires high nitrogen inputs, while legumes like soybeans can fix atmospheric nitrogen and therefore need less nitrogen fertilizer. Tailoring fertilizer plans to the specific needs of each crop ensures optimal growth and productivity while preventing nutrient imbalances in the soil.

5. Monitoring Crop Response

After applying fertilizers, it’s crucial to monitor the crop’s response through regular field observations and data collection. This can include visual assessments of plant health, growth measurements, and more sophisticated methods such as remote sensing and tissue testing.

For instance, chlorophyll meters can measure the greenness of leaves, indicating nitrogen levels in the plants. Similarly, drone or satellite imagery can detect variations in crop health across a field, allowing for timely adjustments.

6. Adaptive Management

Agricultural conditions are dynamic, influenced by weather patterns, pest pressures, and evolving soil health. Therefore, fertilizer strategies must be adaptable. By continually assessing crop performance and environmental conditions, farmers can make informed adjustments to their fertilizer plans. This adaptive management approach ensures that crops receive the right amount of nutrients at the right time, enhancing yield potential and resource use efficiency.

Zaključak

Accurately calculating fertilizer uptake based on yield dry value is fundamental for effective corn production. By understanding nutrient removal rates, conducting soil tests, and considering application efficiency, farmers can optimize fertilizer use, enhance crop yield, and promote environmental sustainability. Adopting best practices and staying informed about advances in precision agriculture and nutrient management can further improve outcomes in corn farming.

PlanetImagery (d

Access to Planet imagery became simpler, faster, and more affordable with GeoPard Agriculture. Since August 2022 GeoPard has released the capabilities to search and analyze only requested Planet images from the user’s preferred date range.

So a GeoPard user requests only preferred Planet images and can use them in GeoPard analytical toolbox.

Planet images extend Sentinel and Landsat coverages (provided by default) and can be mixed with other data layers (harvesting/spraying/seeding machinery datasets, topography profile) via existing Multi-Layer, Multi-Year, i Equation tools


Planet Imagery za kreiranje menadžment zona


Planet is the largest earth observation satellite network delivering a near-daily global dataset and enables its high-resolution and high-frequency satellite imagery data.

Management Zones Based on Planet Scope (3.5m resolution) imagery.

Read more about GeoPard / Planet Partnership.

What is Planet Imagery And Its Use for Management Zones Creation?

It refers to the satellite imagery provided by Planet Labs, a private company that operates a fleet of small satellites called Doves. These satellites capture high-resolution images of Earth’s surface on a daily basis. The term “3m resolution” means that each pixel in the image represents a 3×3 meter area on the ground. This level of detail allows for detailed analysis and monitoring of various features and changes on the Earth’s surface.

When it comes to management zones creation, Planet Imagery with daily 3m resolution can be highly beneficial for various industries and applications, such as:

  • Agriculture: High-resolution imagery can help in creating management zones in agriculture, where different areas of a field may require different treatments, like irrigation, fertilization, or pest control. By analyzing the imagery, farmers can identify patterns related to crop health, soil moisture, and other factors, enabling them to make better decisions about resource allocation.
  • Environmental management: Satellite imagery can be used to identify and monitor environmentally sensitive areas, such as wetlands, forests, and wildlife habitats. This information can be used to create management zones that protect these areas and ensure sustainable land use practices.
  • Urban planning: High-resolution imagery can help urban planners identify areas of growth, land use patterns, and infrastructure development. This information can be used to create management zones that guide future development and ensure efficient use of resources.
  • Disaster management: Satellite imagery can help in identifying and monitoring disaster-prone areas, such as floodplains or wildfire hotspots. Management zones can be created to establish evacuation routes, allocate resources for disaster response, and inform land use policies that minimize the risk of future disasters.
  • Natural resource management: High-resolution imagery can help in monitoring and managing resources like water, minerals, and forests. By identifying areas of high resource value or scarcity, management zones can be created to ensure the sustainable use and conservation of these resources.

In summary, Planet Imagery with daily 3m resolution is a valuable tool for creating management zones in various fields, providing up-to-date and detailed information that can help decision-makers optimize resource allocation and ensure sustainable land use practices.


Često postavljana pitanja


1. What can the use of imagery help establish?

The use of imagery can help establish a more efficient and effective farming system. By utilizing technologies like drones or satellite imaging, imagery can provide valuable insights into crop health, soil conditions, and irrigation needs.

It aids in identifying areas of concern, such as pest infestations or nutrient deficiencies, allowing farmers to take targeted actions. Furthermore, imagery helps in monitoring crop growth and development, enabling precise decision-making and maximizing yields. 

Analitika temeljena na jednadžbama u preciznoj poljoprivredi

With the release of the Equation-based analytics module, the GeoPard team has taken a big step forward in empowering farmers, agronomists, and spatial data analysts with actionable insights for each square meter. The module includes a catalog of over 50 predefined GeoPard precision formulas that cover a wide range of agriculture-related analytics.

The precision formulas have been developed based on multi-year independent agronomic university and industry research and have been rigorously tested to ensure their accuracy and usefulness. They can be easily configured to be executed automatically for any field, providing users with powerful and reliable insights that can help them to optimize their crop yields and reduce input costs.

The Equation-based analytics module is a core feature of the GeoPard platform, providing users with a powerful tool to gain a deeper understanding of their operations and make data-driven decisions about their farming practices. With the ever-growing catalog of formulas and the ability to customize formulas for different field scenarios. The GeoPard can meet the specific needs of any farming operation.


Potassium Removal based on Yield data

Potassium Removal based on Yield data


Use Cases (see examples below):

  • Nitrogen Uptake in absolute numbers using Yield and Protein data
  • Nitrogen Use Efficiency (NUE) and Excess calculations with Yield and Protein data layers
  • Lime recommendations based on pH data from soil sampling or soil scanners
  • Sub-field (zones or pixel-level ROI maps)
  • Micro and Macro nutrients fertilization recommendations based on Soil sampling, Field Potential, Topography, and Yield data
  • Carbon modeling
  • Change detection and alerting (calculate difference between Sentinel-2, Landsat8-9 or Planet imagery)
  • Soil and grain moisture modeling
  • Calculation of dry yield out of wet yield datasets
  • Target Rx vs As-applied maps difference calculation


Potassium Recommendations based on Two Yield Targets (Productivity Zones)

Potassium Recommendations based on Two Yield Targets (Productivity Zones)


Fertilizer: Recommendations Guide. Potassium / Corn.

Fertilizer: Recommendations Guide (South Dakota State University): Potassium / Corn. Review and Revision: Jason Clark | Assistant Professor & SDSU Extension Soil Fertility Specialist


Potassium Use Efficiency in Kg/Ha

Potassium Use Efficiency in Kg/Ha


Nitrogen Use Efficiency in percentage. Calculation is based on Yield, Protein and Grain Moisture data layers

Nitrogen Use Efficiency in percentage. Calculation is based on Yield, Protein and Grain Moisture data layers


Nitrogen: Target Rx vs As-Applied

Nitrogen: Target Rx vs As-Applied


Chlorophyll difference between two satellite images

Chlorophyll difference between two satellite images


A user of GeoPard can adjust existing and create their private formulas based on Imagery, Soil, Yield, Topography, or any other data layers GeoPard supports. 

Examples of the template GeoPard Equations

Examples of the template GeoPard Equations


Formula-based analytics helps farmers, agronomists, and data scientists to automate their workflows and make decisions based on multiple data and scientific research to enable easier implementation of sustainable and precision agriculture.

What is Equation-based Analytics in Precision Agriculture? The Use of Precision Formula

Equation-based analytics in precision agriculture refers to the use of mathematical models, equations, precision formula, and algorithms to analyze agricultural data and derive insights that can help farmers make better decisions about crop management.

These analytics methods incorporate various factors such as weather conditions, soil properties, crop growth, and nutrient requirements to optimize agricultural practices and improve crop yields, while minimizing resource waste and environmental impact.

Some of the key components of equation-based analytics in precision agriculture include:

  • Crop growth models: These models describe the relationship between various factors such as weather, soil properties, and crop management practices, to predict crop growth and yield. Examples of such models include the CERES (Crop Environment Resource Synthesis) and APSIM (Agricultural Production Systems sIMulator) models. These models can help farmers make informed decisions about planting dates, crop varieties, and irrigation scheduling.
  • Soil water models: These models estimate the water content in the soil profile based on factors such as rainfall, evaporation, and crop water use. They can help farmers optimize irrigation practices, ensuring that water is applied efficiently and at the right time to maximize crop yields.
  • Nutrient management models: These models predict nutrient requirements for crops and help farmers determine the optimal rates and timing of fertilizer application. By using these models, farmers can ensure that crops receive the right amount of nutrients, while minimizing the risk of nutrient runoff and environmental pollution.
  • Pest and disease models: These models predict the likelihood of pest and disease outbreaks based on factors such as weather conditions, crop growth stages, and management practices. By using these models, farmers can make proactive decisions about pest and disease management, such as adjusting planting dates or applying pesticides at the right time.
  • Remote sensing-based models: These models use satellite imagery and other remote sensing data to monitor crop health, detect stress factors, and estimate yield. By integrating this information with other data sources, farmers can make better decisions about crop management and optimize resource use.

In summary, equation-based analytics in precision agriculture uses mathematical models and algorithms to analyze complex interactions between various factors that affect crop growth and management. By leveraging these analytics, farmers can make data-driven decisions to optimize agricultural practices, improve crop yields, and minimize environmental impact.


Često postavljana pitanja


1. How can precision agriculture help address resource use and pollution issues in agriculture?

It can help address resource use and pollution issues in agriculture through targeted resource application, efficient resource management, enhanced monitoring, and the adoption of conservation practices. By applying inputs such as fertilizers and pesticides only where needed, farmers can reduce waste and minimize pollution.

Data-driven decision-making enables optimal resource management, while real-time monitoring allows for timely interventions to prevent pollution incidents. Additionally, the implementation of conservation practices promotes sustainable agriculture and reduces environmental impacts.

GeoPard karte potencijala polja prema podacima o prinosu

GeoPard Field Potential maps very often look exactly like yield data.

We create them using multi-layer analytics of historical information, topography, and bare soil analysis.

The process of such synthetic Yield maps is automated (and patented) and it takes about 1 minute for any field in the world to generate it.


GeoPard karte potencijala polja prema podacima o prinosu

Can be used as the basis for:

What are Field Potential maps?

Field potential maps, also known as yield potential maps or productivity potential maps, are visual representations of the spatial variability in potential crop yield or productivity within a field. These maps are created by analyzing various factors that influence crop growth, such as soil properties, topography, and historical yield data.

These maps can be used in precision agriculture to guide management decisions, such as variable-rate application of fertilizers, irrigation, and other inputs, as well as to identify areas that require specific attention or management practices.

Some key factors that are typically considered when creating field potential maps include:

  1. Soil properties: Soil characteristics such as texture, structure, organic matter content, and nutrient availability play a significant role in determining crop yield potential. By mapping soil properties across a field, farmers can identify areas of high or low productivity potential.
  2. Topografija: Factors like elevation, slope, and aspect can influence crop growth and yield potential. For example, low-lying areas may be prone to waterlogging or have a higher risk of frost, while steep slopes may be more susceptible to erosion. Mapping these topographical features can help farmers understand how they affect productivity potential and adjust their management practices accordingly.
  3. Historical yield data: By analyzing historical yield data from previous years or seasons, farmers can identify trends and patterns in productivity across their fields. This information can be used to create these maps that highlight areas of consistently high or low yield potential.
  4. Podatci daljinskog istraživanja Satellite imagery, aerial photography, and other remote sensing data can be used to assess crop health, vigor, and growth stage. This information can be used to create these maps that reflect the spatial variability in crop productivity potential.
  5. Climate data: Climate variables such as temperature, precipitation, and solar radiation can also influence crop growth and yield potential. By incorporating climate data into these maps, farmers can better understand how environmental factors affect productivity potential in their fields.

They are valuable tools in precision agriculture, as they help farmers visualize the spatial variability in productivity potential within their fields. By using these maps to guide management decisions, farmers can optimize the use of resources, improve overall crop yields, and reduce the environmental impact of their agricultural operations.

Difference between Field Potential maps vs Yield data

Field potential maps and yield data are both used in precision agriculture to help farmers understand the spatial variability in their fields and make better-informed management decisions. However, there are some key differences between the two:

Data sources:

These maps are created by integrating data from various sources, such as soil properties, topography, historical yield data, remote sensing data, and climate data. However, this data is collected using yield monitors installed on harvesting equipment, which record the crop yield as it is harvested.

Temporal aspect:

These maps represent an estimation of the potential productivity of a field, which is generally static or changes slowly over time, barring significant changes in soil properties or other influencing factors. However, yield data is specific to a particular growing season or multiple seasons and can vary significantly from year to year based on factors like weather conditions, pest pressure, and management practices.

In summary, field potential maps and yield data are complementary tools in precision agriculture. These maps provide an estimate of the potential productivity of a field, helping farmers identify areas that may require different management practices. Yield data, on the other hand, documents the actual crop output and can be used to assess the effectiveness of management practices and inform future decision-making.

Vegetacijski indeksi i sadržaj klorofila

GeoPard proširuje obitelj podržanih indeksa vegetacije povezanih s klorofilom s

  • Indeks klorofila nadstrešnice (CCCI)
  • Modificirani indeks omjera apsorpcije klorofila (MCARI)
  • Transformirani indeks apsorpcije klorofila u odrazu (TCARI)
  • Omjer MCARI/OSAVI
  • omjer TCARI/OSAVI

Pomažu u razumijevanju trenutne faze razvoja usjeva, uključujući

  • identifikacija područja s potrebama za hranjivim tvarima,
  • procjena uklanjanja dušika,
  • procjena potencijalnog prinosa,

I uvidi se koriste za izradu preciznih karata za primjenu dušika promjenjivom brzinom.


Pročitajte višeKoji je indeks najbolje za korištenje u precisionAg

Pročitajte više: GeoPard indeksi vegetacije


Vegetacijski indeksi i sadržaj klorofila
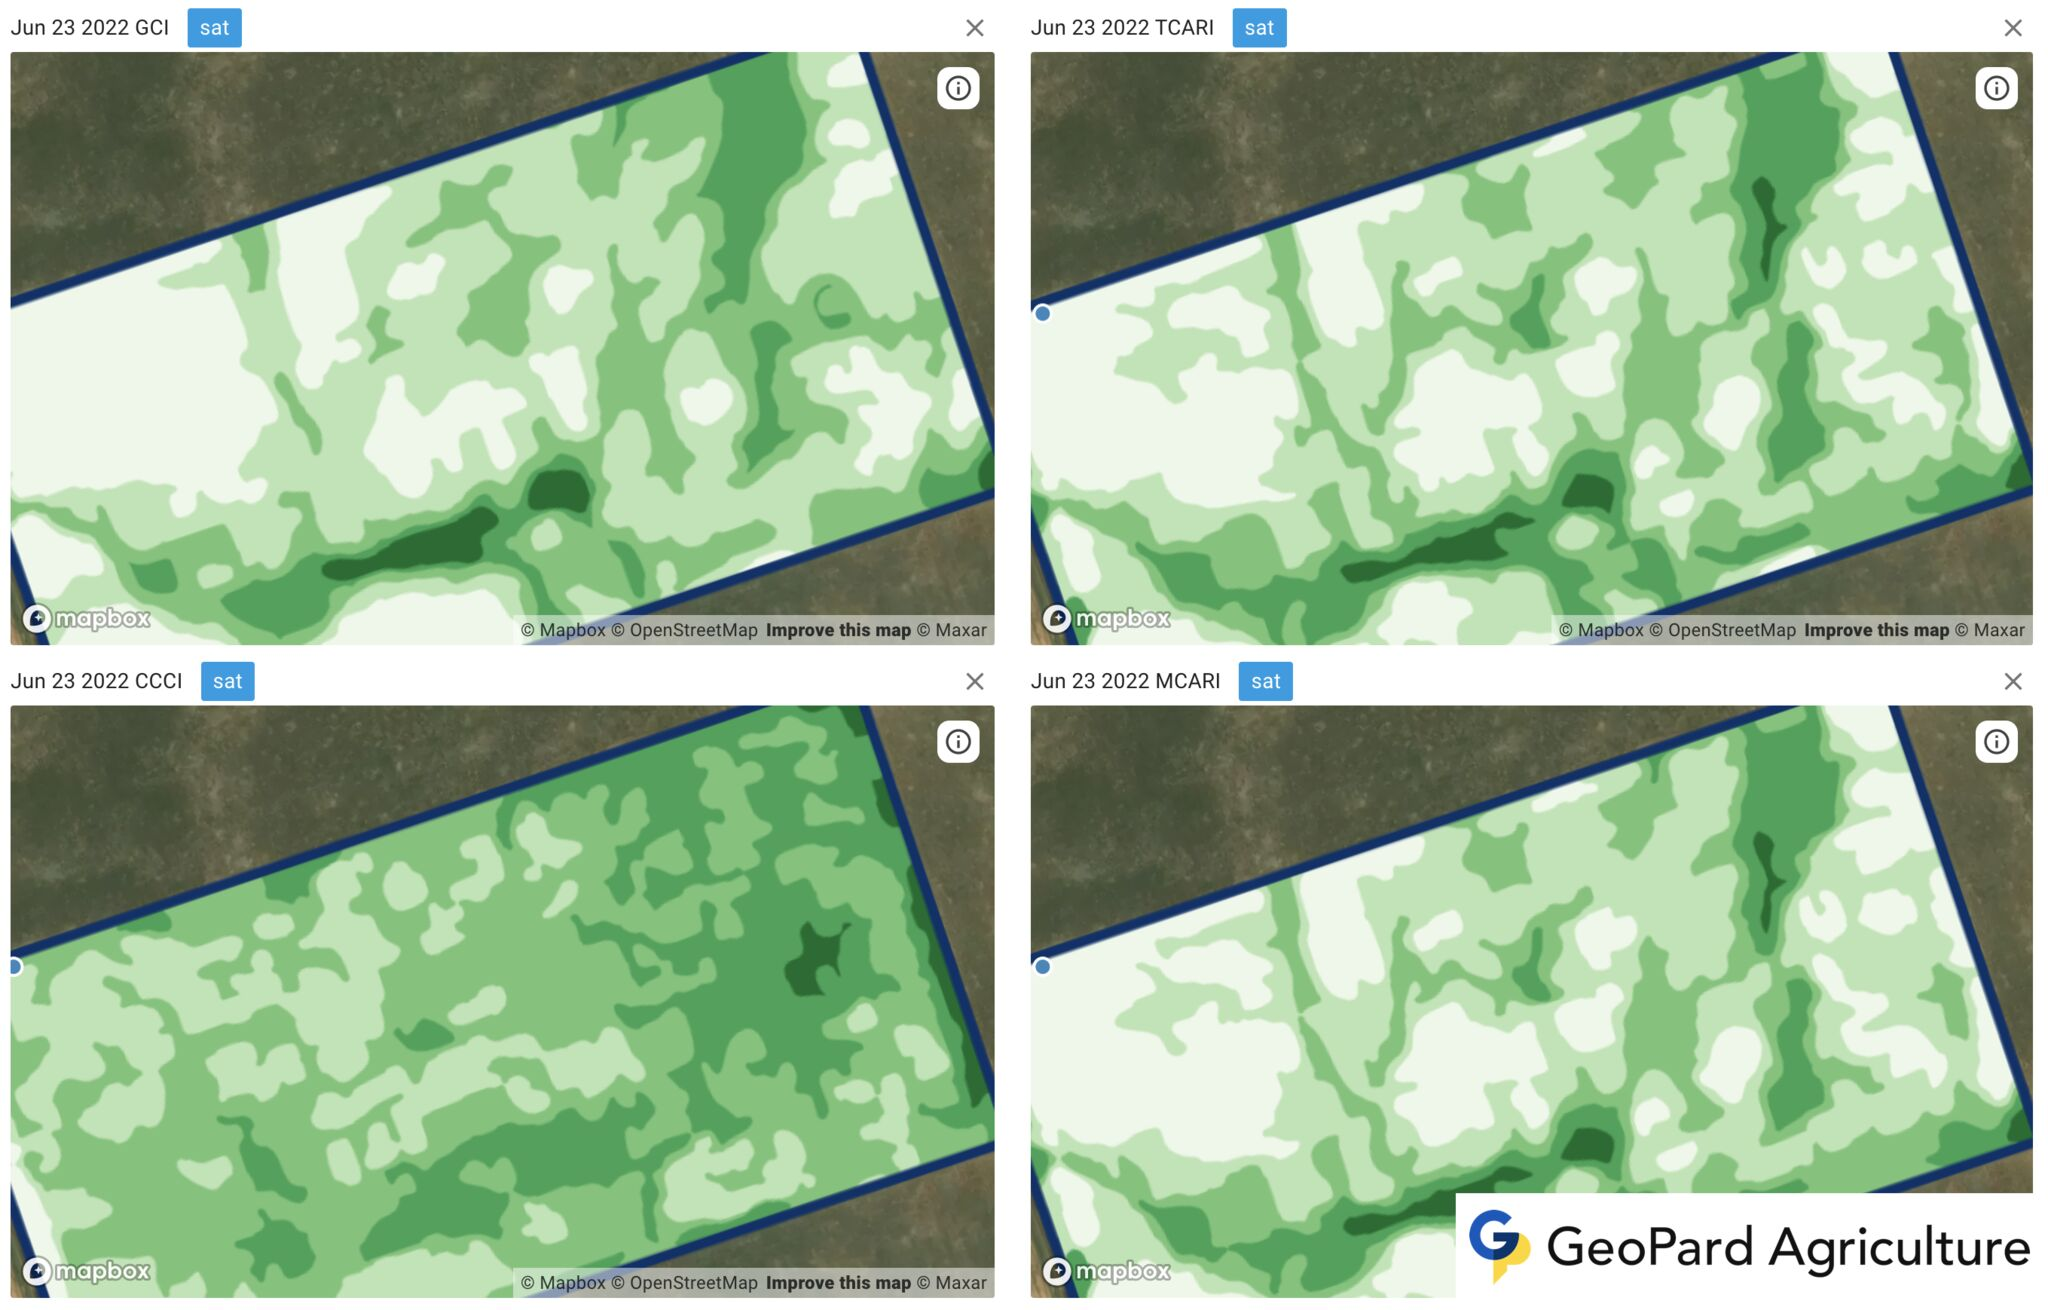
Indeks sadržaja klorofila nadstrešnice (CCCI) u odnosu na modificirani indeks omjera apsorpcije klorofila (MCARI) u odnosu na transformirani indeks apsorpcije klorofila u odrazu (TCARI) u odnosu na omjer MCARI/OSAVI

Što su Indeksi Vegetacije?

Vegetacijski indeksi su brojčane vrijednosti izvedene iz daljinski sondiranih spektralnih podataka, poput satelitskih ili zračnih snimaka, kako bi se kvantificirala gustoća, zdravlje i distribucija biljnog pokrova na Zemljinoj površini.

Često se koriste u daljinskom istraživanju, poljoprivredi, praćenju okoliša i aplikacijama upravljanja zemljištem za procjenu i praćenje rasta, produktivnosti i zdravlja vegetacije.

Ovi indeksi izračunavaju se pomoću vrijednosti refleksije različitih valnih duljina svjetlosti, osobito u crvenom, bliskom infracrvenom (NIR) i ponekad drugim pojasevima.

Reflektivna svojstva vegetacije variraju s različitim valnim duljinama svjetlosti, dopuštajući razlikovanje između vegetacije i drugih tipova zemljišnog pokrova.

Vegetacija tipično ima snažnu apsorpciju u crvenom području i visoko reflektiranje u NIR području zbog karakteristika klorofila i stanične strukture.

Neki široko korišteni indeksi vegetacije uključuju:

  • Normalizirani indeks razlike vegetacije (NDVI)Najpopularniji je i najčešće korišten indeks vegetacije, izračunat kao (NIR – Red) / (NIR + Red). Vrijednosti NDVI kreću se od -1 do 1, pri čemu više vrijednosti ukazuju na zdraviju i gušću vegetaciju.
  • Poboljšani indeks vegetacije (EVI): Ovaj indeks poboljšava NDVI smanjenjem atmosferskog i tlačkog šuma, kao i ispravkom signala pozadine krošanja. Koristi dodatne pojaseve, poput plavog, te uključuje koeficijente za minimiziranje tih učinaka.
  • Indeks prilagođen tlu za vegetaciju SAVI je dizajniran da umanji utjecaj svjetline tla na indeks vegetacije. Uvodi faktor korekcije svjetline tla, omogućujući točniju procjenu vegetacije u područjima s rijetkim ili slabim pokrovom vegetacije.
  • Zeleno-crveni vegetacijski indeks (GRVI): GRVI je još jedan jednostavan omjerni pokazatelj koji koristi zeleni i crveni pojas za procjenu zdravlja vegetacije. Izračunava se kao (Zeleni – Crveni) / (Zeleni + Crveni).

Ovi indeksi, između ostalih, koriste istraživači, upravitelji zemljišta i kreatori politika kako bi donosili informirane odluke u vezi s korištenjem zemljišta, poljoprivredom, šumarstvom, upravljanjem prirodnim resursima i nadzorom okoliša.

Zone Kvalitete

Almost all management zones are adjusted before becoming a Variable Rate Application map. This can be merging some zones together, manual corrections in well-known spots, the addition of extra buffer areas, ag equipment compatibility, etc.

We, in the GeoPard team, understand that accurate natural management zones with valid polygons will save a lot of time during zone verification and correction processes.

The GeoPard engine does the following:

  • automatically removes noise,
  • automatically merges small polygons into the closest bigger zone,
  • keeps only the necessary minimum amount of points in every zone polygon,
  • makes VRA maps compatible with any agricultural equipment and machinery.

In addition to automatic correction, the tool to merge and split zones is available to adjust the map according to your own field knowledge and agronomic practice. 

There are many different maps from various providers on the market, but you will definitely recognize GeoPard maps.

Use of Heterogeneity Factor in Precision Agriculture

One of the unique insights that GeoPard can provide is the Heterogeneity Factor of your fields.

What does it mean? This number shows the level of heterogeneity/variability of your fields. The more variability field has – the more need for precisionag technologies. Especially, it is very useful in pair with GeoPard’s multi-year analytics (30-year history). 

What is Heterogeneity Factor?

Heterogeneity factor in precision agriculture refers to the variation in soil and crop characteristics within a given field. It can be caused by differences in topography, soil type, nutrient availability, water content, pest pressure, and other factors that affect plant growth.

In precision agriculture, the goal is to manage this by using site-specific information to apply inputs such as water, fertilizer, and pesticides at the right time and in the right amount to maximize crop yield and quality while minimizing environmental impact.

This requires the use of sensors, mapping technologies, and data analysis tools to create detailed maps of the field that can guide management decisions.

Its understanding is important because it can help farmers optimize their management strategies and increase their profitability.

By tailoring inputs to the specific needs of each area within a field, farmers can reduce input costs, increase crop yields, and improve overall crop health.

How you can use it?

If you have many fields, it can help you to understand, which fields to target first with Variable Rate Applications (seeding, fertilizing, spraying). 

By mapping the variations in soil and crop characteristics within a field, farmers can identify areas that have different needs and apply inputs at variable rates accordingly.

For example, areas of a field that have high nutrient availability may not need as much fertilizer as areas that have low nutrient availability. Similarly, areas of a field that have a high density of weeds may require more herbicide than areas with fewer weeds.

By using VRA, farmers can reduce input costs by applying inputs only where they are needed, and avoid over-application of inputs that can lead to environmental degradation.

This approach can also lead to higher crop yields and better quality crops, as inputs are tailored to the specific needs of each area within the field.

Therefore, understanding the heterogeneity factor in precision agriculture is crucial for making informed decisions about where to apply inputs and at what rates, ultimately leading to better management practices and increased profitability.

You save the most on chemicals on the most heterogeneous fields!

What is heterogeneity service?

In agriculture, it refers to the recognition and utilization of the natural variation or heterogeneity within a field or landscape. It involves understanding and leveraging the diverse characteristics of different areas to optimize agricultural practices.

The services can include precision agriculture techniques such as variable rate applications, site-specific management, and targeted interventions based on the specific needs of different zones or areas within a field.

By harnessing it, farmers can enhance resource efficiency, improve crop productivity, and minimize environmental impacts.

wpChatIkona
wpChatIkona

    Zatražite besplatnu GeoPard demo / konzultaciju


    Klikom na gumb prihvaćate naše Pravila o privatnosti. Treba nam kako bismo odgovorili na vaš zahtjev.

      Pretplati se


      Klikom na gumb prihvaćate naše Pravila o privatnosti

        Pošaljite nam informacije


        Klikom na gumb prihvaćate naše Pravila o privatnosti