Imágenes planetarias (diarias, resolución de 3m) para la creación de zonas de gestión

Con GeoPard Agriculture, acceder a las imágenes de Planet es más sencillo, rápido y económico. Desde agosto de 2022, GeoPard ofrece la posibilidad de buscar y analizar únicamente las imágenes de Planet solicitadas, dentro del rango de fechas que el usuario prefiera.

De este modo, un usuario de GeoPard solicita únicamente las imágenes de Planet que prefiera y puede utilizarlas en la caja de herramientas analíticas de GeoPard.

Las imágenes del planeta se extienden Sentinel y Landsat coberturas (proporcionadas por defecto) y se pueden mezclar con otras capas de datos (conjuntos de datos de maquinaria de cosecha/pulverización/siembra, perfil topográfico) a través de existentes Multicapa, Plurianual, y Herramientas de ecuaciones


Imágenes planetarias para la creación de zonas de gestión


Planeta Es la mayor red de satélites de observación de la Tierra, que proporciona un conjunto de datos globales casi diarios y permite la obtención de imágenes satelitales de alta resolución y alta frecuencia.

Zonas de gestión basadas en imágenes de Planet Scope (resolución de 3,5 m).

Lea más sobre GeoPard / Planet Partnership.

¿Qué son las imágenes planetarias y cuál es su uso para la creación de zonas de gestión?

Se refiere a las imágenes satelitales proporcionadas por Planet Labs, una empresa privada que opera una flota de pequeños satélites llamados Dove. Estos satélites capturan diariamente imágenes de alta resolución de la superficie terrestre. El término "resolución de 3 m" significa que cada píxel de la imagen representa un área de 3 × 3 metros en el terreno. Este nivel de detalle permite un análisis y monitoreo exhaustivos de diversas características y cambios en la superficie terrestre.

En lo que respecta a la creación de zonas de gestión, las imágenes planetarias con una resolución diaria de 3 m pueden ser muy beneficiosas para diversas industrias y aplicaciones, tales como:

  • AgriculturaLas imágenes de alta resolución pueden ayudar a crear zonas de manejo en la agricultura, donde diferentes áreas de un campo pueden requerir tratamientos distintos, como riego, fertilización o control de plagas. Al analizar las imágenes, los agricultores pueden identificar patrones relacionados con la salud de los cultivos, la humedad del suelo y otros factores, lo que les permite tomar mejores decisiones sobre la asignación de recursos.
  • Gestión ambiental: Las imágenes satelitales permiten identificar y monitorear áreas ambientalmente sensibles, como humedales, bosques y hábitats de vida silvestre. Esta información puede utilizarse para crear zonas de gestión que protejan estas áreas y garanticen prácticas de uso sostenible de la tierra.
  • Planificación urbana: Las imágenes de alta resolución pueden ayudar a los planificadores urbanos a identificar áreas de crecimiento, patrones de uso del suelo y desarrollo de infraestructuras. Esta información puede utilizarse para crear zonas de gestión que orienten el desarrollo futuro y garanticen un uso eficiente de los recursos.
  • Gestión de desastres: Las imágenes satelitales pueden ayudar a identificar y monitorear áreas propensas a desastres, como llanuras aluviales o zonas de alto riesgo de incendios forestales. Se pueden crear zonas de gestión para establecer rutas de evacuación, asignar recursos para la respuesta ante desastres e informar las políticas de uso del suelo para minimizar el riesgo de futuros desastres.
  • Gestión de los recursos naturales: Las imágenes de alta resolución pueden ayudar a monitorear y gestionar recursos como el agua, los minerales y los bosques. Al identificar áreas con alto valor o escasez de recursos, se pueden crear zonas de gestión para garantizar el uso sostenible y la conservación de estos recursos.

En resumen, Planet Imagery con una resolución diaria de 3 metros es una herramienta valiosa para la creación de zonas de gestión en diversos ámbitos, ya que proporciona información actualizada y detallada que puede ayudar a los responsables de la toma de decisiones a optimizar la asignación de recursos y garantizar prácticas de uso sostenible de la tierra.


Preguntas frecuentes


1. ¿Qué puede ayudar a establecer el uso de imágenes?

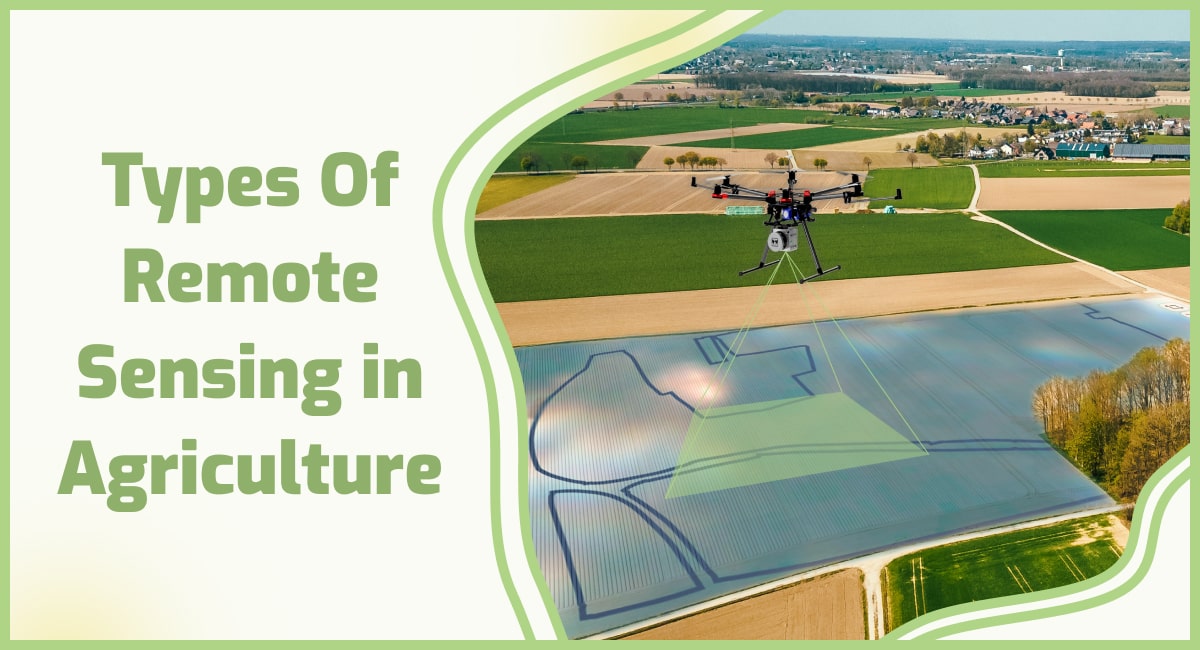
El uso de imágenes puede contribuir a establecer un sistema agrícola más eficiente y eficaz. Mediante tecnologías como drones o imágenes satelitales, se pueden obtener datos valiosos sobre la salud de los cultivos, las condiciones del suelo y las necesidades de riego.

Ayuda a identificar áreas problemáticas, como plagas o deficiencias nutricionales, lo que permite a los agricultores tomar medidas específicas. Además, las imágenes facilitan el seguimiento del crecimiento y desarrollo de los cultivos, permitiendo una toma de decisiones precisa y la maximización de las cosechas. 

Cómo la imagen satelital ayuda en la monitorización de cultivos

Satellite imagery is one of the most versatile functions that can be implemented in agricultural production in order to improve the decision-making process. Making decisions, based on a large quantity of data, can help the farmers, agronomists, or advisors to comprehend the situation and the processes that are occurring in the agricultural fields that are subject to monitoring.

What is satellite imaging?

Satellite imaging, also known as satellite remote sensing, is the process of using satellite imagery to gather information about the Earth’s surface, atmosphere, and oceans. This technology involves the use of satellites equipped with specialized sensors and cameras that can capture high-resolution images of the Earth from space.

The images captured by the satellites can be used for a variety of applications, including monitoring weather patterns, tracking changes in the environment, mapping land use and vegetation, and assessing the impact of natural disasters. They can also be used for military and intelligence purposes.

Satellite imaging with its benefits can present situations that can not be seen with regular observation. Regular observations can be very demanding in the sense of the quantity of implemented workforce, finance, and time.

Even with regular observations made during the growth period of the crops, there are several things that can not be seen with the naked eye, such as the early progression of enfermedad and damage induced by the pests that ultimately result in chlorophyll degradation on a cell level.

With the integration and calculation of spectral bands invisible to the human eye, the growers and the advisors can easily visualize chlorophyll degradation before the visible disease or pest damage symptoms on the plants.

Multispectral Satellite Imagery

These advantages in crop monitoring are beneficial with nowadays technologies, allowing implementation of such information to be integrated into geographic information systems, resulting in creating a prompt and quality set of data ready to be utilized in the decision-making processes regarding agricultural production systems.

Besides making information-based decisions, satellite imagery can be used for reporting, record-keeping, and integrating with different sets of data (disease and pest models, yield maps, pest monitoring, fertilization maps and etc,) in order to create an even more functional system of crop monitoring and the way how the farmer or other professionals see the progress of the crops during their growing period.

How are satellite imagery used in farming?

The images can be used to model and calculate spectral indices which later are equated to be used for visualization in the form of color synthesis, either in the visible part of the spectrum or by including other wavelengths. Properly selected color synthesis can reveal crop growth, stress or soil erosión displayed with different colors.

Spectral indices are combinations of spectral reflection of two or more wavelengths to show features of interest. Crop indices are most commonly used in agriculture, but the indices are used for the identification of burned areas, other artificial characteristics, water, and other geological features.

Hyperspectral Satellite Imagery

Useful spectral indices in crop production include:

  • NDVI (Normalized Difference Vegetation Index).
  • EVI (Enhanced Vegetation Index).
  • RENDVI or NDRE (Red Edge Normalized Difference Vegetation Index).
  • GNDVI (The Green Normalized Difference Vegetation Index).
  • MSI or NDWI (Moisture Stress Index).
  • LAI (Leaf Area Index).

NDVI is one of the most used indices and is frequently used to review the initial state of a crop. Other indexes work with certain characteristics, so the results are specific to related to specific agricultural sites, it is important to work with the history of land vegetation.

NDVI (Índice de Vegetación de Diferencia Normalizada)

This index is a measure of green vegetation and is generally the most widely used index. The leaves reflect infrared light (NIR) and use only visible light for photosynthesis. This means that a healthy plant with a good photosynthesis rate can be analyzed by comparing NIR with visible red light.

Unhealthy vegetation will reflect more visible light and lower NIR. Healthy vegetation will reduce some of the visible light that falls on it. However, NDVI is sensitive to the effects of soil (light and color), cloud cover, and shade. Also, the NDVI values can be incorrect in a situation with dense vegetation.

EVI (Enhanced Vegetation Index)

This index is the standard for the moderate resolution spectra – an instrument used on the Terra and Aqua satellites. EVI presents an alternative to NDVI which refers to some of its deficiencies, e.g., soil and atmospheric constraints, by optimizing the reflectivity of leaf vegetation.

It uses the blue part of the visible spectrum for signal correction, lowering the effects of the abovementioned constraints including the scattering of electromagnetic radiation by aerosols.

RENDVI or NDRE (Red Edge Normalized Difference Vegetation Index)

This index is based on the standard NDVI index, but with modifications. RENDVI is very useful in precision agriculture, forest monitoring, and the detection of crop stress.

Its effectiveness is due to the inclusion of wavelengths that fall into the red end band, rather than wavelengths that correspond to the value of reflection and absorption. It is especially convenient for detecting small changes in the vegetation condition.

GNDVI (The Green Normalized Difference Vegetation Index)

This index is similar to the NDVI index and measures the reflection of the light in the green part of the spectrum in the wavelength range of 540 to 570 nanometers, instead of the red part of the spectrum. This makes the index more sensitive to the chlorophyll content in the green parts of the crops.

MSI (Moisture Stress Index)

This index is sensitive to the increase in water content in the leaves. The MSI index is used to detect water scarcity stress and is a good indicator of crop conditions often used for crop modeling, fire analysis, and ecosystem physiology. High values ​​indicate water stress and lower water content.

LAI (Leaf Area Index)

This index is used to estimate leaf area and to predict plant growth and yield.

Types of crop satellite imagery

Satellites and technology providers Type of satellite imagery Repeat cycle Spatial resolution
Landsat4-9 RGB, MULTISPECTRAL, PANCHROMATIC 8 days 15, 30, 100 m
Sentinel-2, RGB, MULTISPECTRAL 5 days 10 m
Planet Scope RGB, MULTISPECTRAL Daily 3-4 m
Planet SkySat PANCHROMATIC, MULTISPECTRAL Daily 0.5, 0.71-0.82 m
Airbus Pleiades MULTISPECTRAL Daily 0.5 m
Pleades NEO PANCHROMATIC, MULTISPECTRAL 40 minutes after request 0.3 m
ICEEYE SYNTHETIC APERTURE RADAR Daily 0.25 m
Hyperion HYPERSPECTRAL N/A 30 m
Prism HYPERSPECTRAL N/A 0.3 m

Satellite imaging use-cases

Here are some important use of satellite images in crop monitoring:

Thermal Imagery

The heat emitted by ground-level objects can be seen in thermal photography taken from the air, which also reveals temperature variations that correspond to crop stress. The removal of unnecessary elements, such as pivot equipment, from the image through calibration and image correction prevents data skew.

Cooler regions show purple and warmer regions appear yellow in the final imagery. Thermal imaging is helpful for finding leaks, jams, and other irrigation problems since water cools vegetation. Thermal imaging aids growers in identifying pre-symptomatic disease and pest pressures and responding with more timely and focused interventions by revealing tiny changes in leaf surface temperature.

Soil moisture

Agriculture must take into account soil moisture. For precision farming applications (at the scale of individual fields) and with the anticipation of improving crop yield modeling, the availability of high-resolution soil moisture maps is especially crucial.

Due to the poor spatial resolution and shallow depth of the observations, soil moisture products generated from satellites have so far been employed sparingly in farm- or field-scale agricultural decision support. However, if it can deliver pertinent data on acceptable temporal and spatial dimensions, satellite-derived soil moisture is anticipated to have much potential.

Resolution

High-resolution satellite imaging from low-orbit satellites has recently become more developed and accessible, providing another potential for phenotyping applications. This paper illustrates how satellite photography is used in crop phenotyping and agricultural production, and it identifies plant features that can be assessed using high-resolution satellite data.

The paper covers the benefits of using satellite-based phenotyping in crop breeding programs as well as the drawbacks, such as cloud blockage. It also explores potential uses for high-resolution satellite imaging as a phenotyping tool in the future.

In order to help plant breeders choose high-yielding, stress-tolerant varieties that can help meet global food demand while coping with climate change, high-resolution satellite imagery can be used as a phenotyping tool for the evaluation of crop varieties.

Satellite monitoring

Applications of satellite imagery

GeoPard capabilities and satellite imaging applications offer the users to visualize, normalize, analyze and derive insights directly from the agricultural plots in order to improve crop production. This data utilization can be done with the help of ready-to-use GeoPard algorithms or by creating your own algorithms to make them useful for agronomy.

These algorithms allow evaluation of crop growth, stress, etc. (see photo) or even create prescription maps: for example Nitrogen VR application maps, Crop Protection spraying application maps.


Preguntas frecuentes


1. ¿Cómo obtener imágenes satelitales para una granja?

To get it for your farm, research providers, sign up, and access their database or portal. Specify your farm’s location and desired parameters to retrieve relevant images for agricultural monitoring.

2. ¿Por qué son útiles las imágenes satelitales para comprender las redes tróficas?

It is helpful in understanding food webs due to its ability to provide a broad and comprehensive view of ecosystems. By capturing large-scale images of land and water bodies, it allows scientists to observe and analyze the spatial distribution of various habitats and resources.

This, in turn, aids in studying the interactions between different species, identifying key feeding relationships, and comprehending the flow of energy through food webs.

It helps unravel complex ecological dynamics, contributing to a deeper understanding of ecosystem functioning and conservation efforts.

3. How expensive is satellite imagery?

Its cost varies depending on several factors. These include the provider, resolution, frequency of acquisition, and extent of coverage needed. Prices can range from affordable options for low-resolution imagery to more expensive options for high-resolution and real-time monitoring.

Additionally, specialized services or customized data requests may incur additional costs. It is advisable to explore different providers and their pricing models to find a satellite imaging solution that aligns with your specific requirements and budget.

4. What is infrared satellite imagery? How to read it?

It captures the infrared radiation emitted by objects and surfaces on the Earth’s surface. It provides valuable insights into temperature variations and thermal patterns.

To read infrared satellite imaging, one must understand that warmer objects appear brighter in the image, while cooler objects appear darker. By analyzing these temperature variations, one can assess cloud formations, identify land and water temperature disparities, detect wildfires, and even monitor ocean currents.

Understanding the color scale and interpreting the brightness levels on the imagery helps in extracting meaningful information from infrared satellite images.

Predicción del rendimiento de los cultivos con datos de teledetección en Agricultura de Precisión

For crop yield prediction, we need to understand how much sunlight plants receive and how much water they need. Plant growth depends on these two factors, but many other factors affect plant growth such as temperature, humidity, and tipo de suelo.

The quantity and quality of crops produced in the world is a major factor affecting food security. This is especially important in developing countries where agriculture is still an important part of the economy.

Remote sensing data can be used to estimate quantities of light received by plants and thus predict crop yield. Remote sensing data is a powerful tool for estimating crop yield. It provides information on the growing crops and their environment, allowing you to estimate crop production.

Remote sensing data is a form of data analytics in agriculture that can be used to predict yield before the harvest. This article explores everything you need to know about remote sensing data.

What is crop yield data in agriculture?

Crop yield data is information on the amount of crop produced by a farmer or farmer group. It includes the amount of crop harvested per hectare of land. This can be measured in tonnes, bushels, or any other unit of measurement depending on the crop.

Farm Yield data is important when it comes to agriculture because it can help farmers determine how much they should plant next season. In addition, yield data allows them to determine if there’s a problem with their crops that needs to be addressed.

Yield data can also be used to monitor progress toward global goals set by governments, non-governmental organizations, and other stakeholders.

In addition, yield data is used to identify strengths and weaknesses in farming practices and make recommendations based on this information. Yield data is useful in making informed decisions about many aspects of farming, such as:

Data analytics in precision agriculture

Seed selection: Choosing varieties and hybrids based on yield data can help ensure that fields are planted with the most profitable seeds available.

Pest management: By monitoring plant growth, yield data can help farmers determine when to introduce pest control measures. This can reduce the use of pesticides and increase profits.

Irrigation scheduling: Using information from yield monitors allows farmers to fine-tune irrigation scheduling, which helps conserve water and money while maintaining high yields.

What is remote sensing data?

Remote sensing is the science of acquiring information about an object or phenomenon without being in direct contact with the object and thus in a non-intrusive manner. It is used in agriculture to monitor crops, soil, and moisture conditions.

Remote sensing uses electromagnetic radiation (EMR) emissions such as those emitted by radio waves, microwaves, infrared, visible light, and ultraviolet light.

Remote sensing of crops provides a way to measure crop growth conditions over time. It also provides information on the state of crops at specific points in time and space. This information can be used to estimate crop yields and provide estimates of when the harvest should occur.

Remotely sensed data can be used to measure land-use changes, monitor crop growth, and farm yield, detect soil moisture and salinity levels, determine pest infestation levels, monitor environmental pollution levels, etc.

So, for example, if you’re walking through a field and looking at the plants, you’re collecting data about them. If you’re driving around in a helicopter or plane and looking at the plants from above, you’re collecting remote sensing data.

There are many different types of remote sensing techniques and devices used to collect this data: satellite images, aerial photos, radar systems, lidar, and more.

What is crop yield prediction?

Crop yield prediction is the process of estimating the potential or expected yield of a specific crop for a given area and growing season.

It involves analyzing various factors such as weather conditions, soil characteristics, crop genetics, and management practices to make informed predictions about the likely harvest.

It is important to note that crop yield predictions are subject to uncertainty due to the complexity of agricultural systems and the influence of unpredictable factors like pests, diseases, and extreme weather events.

While prediction models provide valuable insights, they serve as a tool to aid decision-making rather than providing absolute certainty.

How does it work?

The following data sources are combined to create a varied weighting on yield projection numbers based on the present cropping season circumstances in various regions.

Farmers Edge data scientists combine these data sources with the most recent advances in machine learning to update yield forecast estimates whenever a major yield component is disrupted.

1. Preseason data

Preseason data must be accurate to lay the groundwork for crop yield prediction. This information is available before the crop is planted, and it lays the stage for the first yield prediction readings.

Data such as a field’s location, current and previous crops, field-specific weather months before planting or seeding, soil test information and data, and regional weather trends over the last decade are all combined to provide insight into how to start the season with accurate yield numbers to anticipate.

2. In-season data

In-season data provides insight into variables that affect farm yield throughout the growing season after the foundation has been laid.

Farmers Edge on-farm weather stations give field-centric data that enhances these datasets by delivering expected and predicted values that are stored and then reset when data comes in each day, advancing the models.

Other in-season data, like fertilizer application, is also taken into account during the season, whether planned or not, to improve field diagnostics and offer forecast yield values.

3. Crop-specific data

Farmers Edge’s wide network of local agronomists may also provide crop-specific data during the growing season.

Farmers Edge agronomists have identified crop-specific data that impacts yield during a growing season, including water content during major growth stages or hours above cardinal temperatures for crops during key yield determining periods, for the five main crops in yield prediction (corn, canola, lentils, soybeans, and wheat).

4. Crop and field imagery

High-resolution satellite imagery is used to set NDVI crop health values on fields fast and precisely, allowing researchers to look for erroneous results or regional concerns with crops that could affect yield.

These regional trends can be used to determine if areas are on track for forecast or whether environmental factors have distorted the crop yield prediction values.

5. Histogram data

Farmers Edge Yield Prediction models use big statistics to find different distributions in field images over time, which then offers clarity to a convolutional neural network that can use these modifications to forecast yield across large areas, such as the United States or Canada, as imagery changes over time.

What is remote sensing data in agriculture?

It’s not simple to anticipate production before the harvester runs through the field, but the Farmers Edge team is thrilled to provide producers with farm yield predictions based on complete and accurate statistics.

Each data source has a weight in crop yield prediction, which can be changed based on the model parameters.

How to increase farm yield with precision technologies?

Farm owners have debated and worked on raising agricultural yields for generations. Some of the methods discovered were effective, while others were ineffective.

In addition to the invaluable experience of earlier generations of farmers, the agriculture industry may now profit from modern scientific and technological advancements.

Let’s take a look at the most common ways for farmers to boost yields and how previous experience and new technology can be utilized to boost agricultural productivity.

1. Proper irrigation

Farmers that want to boost their average crop output per acre on their farms need a well-designed irrigation system. Providing the right amount of water to the plants has a direct impact on their development and, as a result, agricultural yields.

Weather forecasts are crucial for effective irrigation of farmlands. Hyper-local weather forecasting is now possible thanks to today’s technologies, which include customized programs and software for farmers.

It makes precision irrigation possible by allowing farmers to prepare ahead of time and schedule irrigation of their crops most exactly and efficiently possible.

2. Soil testing and its quality

One of the most important factors affecting crop yields is soil quality or fertility. Aside from agricultural production, soil quality has an impact on how much it costs a farmer to cultivate a certain plant, as some of them require specific ratios of specific elements in the soil, such as mineral particles, organic matter, water, and air.

Farmers must regularly monitor soil conditions on their land plots to achieve higher agricultural yields. Rotación de cultivos is one of the most effective techniques to keep the soil healthy, among other things.

Plant rotation on a specific field plot avoids soil fatigue and interrupts insect cycles, resulting in higher agricultural output and, as a result, higher average farm yield per acre.

3. Quality of seeds

The quality of seeds used by farmers to sow their fields has an impact on agricultural production. As a result, agrarians are advised to sow only certified seeds that have passed all necessary quality controls on their farmlands to increase agricultural yield.

Certified seeds may be more expensive than uncertified seeds, but the result will be worth it because seed quality is one of the most important elements affecting crop productivity.

Aside from that, using only high-quality seeds is one of the most environmentally responsible ways to boost crop productivity. A farmer can examine the quality of specific seeds by contacting a relevant seed business and arranging customized trials on a specific parcel of land if necessary.

Aside from that, it’s crucial to understand that seed quality isn’t permanent or unaffected. From the moment they are sown in the earth, seed grains require protection. One of the seed treatment strategies used to achieve this is seed coating.

It is the technique of encasing seed grains in exterior materials to improve their properties (weight, size) and/or providing them with active chemicals (micronutrients, microbial inoculants, growth regulators, and so on) to protect them from plant diseases and enhance their growth.

4. Smart application of fertilizers

Fertilizers are designed to nourish different types of soil, enhance plant growth, and increase harvests, but their use should be balanced and judicious. Overuse of fertilizers can have a severe impact on soil quality and, as a result, agricultural productivity.

Various regions of a field may require different levels of soil fertilization, so the best approach is to use fertilizers selectively, according to the demands of different field zones. This precise approach to field fertilizing keeps the soil healthy, resulting in higher average yields per acre.

A Crop Monitoring software is one of the technology options in this context. It contains a field zoning tool that separates farmland into 2-7 zones based on satellite photography, identifying places that require more attention than others.

Growers frequently employ precision technology as one of the most environmentally friendly ways to boost it.

5. Crop protection methods

Agriculturists who want to boost yields must look after their plants throughout their growth and until the end of the growing season. Farmers use a variety of compounds to reduce the influence of weeds, pests, and diseases on crop productivity, depending on the situation.

Herbicides, insecticides, desiccants, plant growth regulators, fungicides, adjuvants, and other chemicals are common examples. Crop protection can be done in a variety of ways. Weed/pest control and plant disease control are two of the most important.

6. Plant disease prevention and management

Plant infections are another significant hazard to a grower’s agricultural performance. Farmers can use a variety of plant disease prevention and management methods, like choosing disease-resistant or disease tolerant varieties, treating seeds with fungicides, and applying pesticides and other similar substances to developing plants, depending on the type of plants to be grown on a field.

Agrarians should pay extra attention to when they use these or other tactics so that they have the most impact. It’s necessary to keep in mind that timely plant protection is critical for the farm yield per acre indication — the earlier a problem is recognized, the faster and easier it will be resolved, and the lesser fields acres will be impacted.

7. Weed and pest management

During the growing season, farmers’ primary challenges are weed control and pest management. A single weed, for example, can produce over 10 million weed seeds, which, if not controlled promptly, can significantly reduce yields on a given field and cause difficulties for years. Agrarians must also take a holistic response to pest infestations.

Farmers must constantly be ready to respond to pest infestation issues promptly because pests are highly adaptive and fast-reproducing organisms that might jeopardize the produce on specific farmland.

Crop yield prediction is a major concern for farmers as it directly affects their profit margin. If a farmer knows how much yield he can expect from his land, he can plan his crops accordingly and increase his profit margin. This is why it is important to predict farm yield accurately before planting any crop on a particular land.

Crop yield prediction with GeoPard Agriculture Tools

It has been an important issue in agronomy since ancient times. It is critical to food security, especially at times of drought, floods, or other natural disasters.

Crop yield prediction is also used by farmers to make decisions about when to plant and harvest crops based on soil moisture content, pest infestations, and other factors such as weather conditions and fertilizer requirements.

To make more informed decisions and improve growing efficiency with Farm Yield Data, click here to request a demo now.


Preguntas frecuentes


1. How do farmers increase their crop yield?

Farmers increase crop yield through soil management, efficient irrigation, crop rotation, and pest and weed control. These practices optimize soil fertility, water availability, and minimize pests and diseases, resulting in higher crop productivity.

2. How to calculate crop yield per hectare/plot?

It can be measured through various methods and factors. One common approach is to physically harvest a representative sample of the crop from a given area and weigh it. This weight is then extrapolated to estimate the total yield of the entire field or farm.

For example, if the sample weighs 100 kilograms and the field area is 2 hectares, the crop yield per hectare would be 50 kilograms.

Additionally, advanced technologies such as remote sensing and satellite imagery can be used to assess crop health, vegetation indices, and biomass, providing valuable insights.

Other factors like grain quality, size, and market value are also taken into account when measuring it. For example, if the sample weighs 100 kilograms and the field area is 2 hectares, the crop yield per hectare would be 50 kilograms.

3. How do you estimate the crop yield prior to harvest?

Estimating crop yield prior to harvest can be done through a combination of methods.

One approach is using crop-specific growth models that take into account factors such as planting date, weather conditions, and crop health to predict potential yield. A

Another method is using remote sensing techniques, such as satellite imagery or drones, to assess crop vigor and biomass.

4. Which type of farming system yields healthier grains?

Organic farming systems are often associated with healthier grains. Organic farming avoids the use of synthetic pesticides, herbicides, and genetically modified organisms (GMOs). Instead, organic farmers rely on natural fertilizers, crop rotation, and biological pest control methods.

These practices contribute to the production of grains that are free from chemical residues, potentially higher in essential nutrients, and have lower levels of pesticide contamination.

However, it’s important to note that the specific health benefits of grains can vary depending on factors such as soil quality, crop variety, and post-harvest handling practices.

5. How does pesticides increase crop yield?

Pesticides can increase it by protecting plants from various pests, diseases, and weeds. They help control or eliminate harmful insects, fungi, bacteria, and other organisms that can damage or destroy crops.

By reducing the impact of pests, pesticides allow plants to grow more vigorously, utilize nutrients efficiently, and allocate more resources towards productive growth. \

Hyperspectral imagery for Agriculture. Grant from the state of North Rhine-Westphalia.

We are glad to announce that the “Artificial intelligence framework for quantitative estimation of soil properties using hyperspectral satellite imagery” project was selected for partial funding by the Ministry of the Environment of North Rhine-Westphalia and the European Union under the REACT-EU InnovationUmweltwirtschaft.NRW program. The grant is funded by the European Regional Development Fund / Europäischen Fonds für regionale Entwicklung (EFRE).

the European Regional Development Fund

The use of artificial intelligence and statistics in this project made it possible to determine the correlation between hyperspectral and soil data (e.g., N, pH), facilitating a more precise and scalable approach to soil analysis. The forthcoming launch of hyperspectral satellites with frequent revisit intervals and seamless access to new imagery without delays presents several advantages, particularly in nutrient management for sustainable agriculture. The technology helps assess nutrient content and availability in the soil, allowing farmers to tailor fertilisation strategies. This leads to better nutrient uptake by plants, reduced environmental impact, and cost savings.

What is Hyperspectral imagery?

Hyperspectral imagery is a powerful remote sensing technique that captures the electromagnetic spectrum with high spectral resolution.

Unlike traditional satellite imagery, which typically consists of three to four bands (red, green, blue, and sometimes near-infrared), hyperspectral imagery collects hundreds to thousands of narrow spectral bands across the visible, near-infrared, and shortwave infrared regions. Each band provides unique information about the surface properties of the imaged area.

It is acquired using sensors mounted on airborne or spaceborne platforms. These sensors use spectrometers to measure the intensity of reflected or emitted radiation across multiple narrow bands.

By collecting a wide range of spectral data, hyperspectral sensors can detect subtle differences in the spectral signatures of various materials, allowing for highly detailed and precise analysis.

Applications of Hyperspectral Imagery

  • Environmental Monitoring: It plays a vital role in monitoring and assessing the health of ecosystems. It helps identify vegetation stress, monitor land cover changes, detect invasive species, and measure water quality parameters like chlorophyll concentration or turbidity in lakes and rivers.
  • Agriculture: It aids in precision agriculture by providing detailed information about crop health, nutrient content, moisture levels, and disease detection. Farmers can make data-driven decisions regarding irrigation, fertilization, and pest management, resulting in optimized crop yields and reduced environmental impact.
  • Geology and Mineral Exploration: It is instrumental in mapping geological formations, identifying mineral deposits, and characterizing rock types. It helps geologists detect alterations in mineral composition and map potential areas for exploration, contributing to more efficient and targeted mining activities.
  • Forestry: It assists in forest management and monitoring. It enables the identification of tree species, quantification of forest biomass, detection of tree stress, and assessment of wildfire damage. This information aids in sustainable forest management, biodiversity conservation, and early warning systems for forest fires.

Benefits of Hyperspectral Imagery

Its main advantage lies in its ability to provide detailed spectral information, enabling the discrimination of materials with high accuracy.

This leads to improved classification and mapping of land cover types, enhanced identification of specific substances, and better understanding of environmental processes.

Hyperspectral data can also be analyzed using advanced algorithms and machine learning techniques to extract valuable insights and automate image interpretation.

Sistema de monitoreo remoto de cultivos: ¿Cómo funciona?

Un sistema remoto de monitoreo de cultivos en agricultura de precisión se refiere al uso de diversas tecnologías y herramientas para monitorear y gestionar cultivos a distancia. Este enfoque aprovecha tecnologías de recolección, análisis y comunicación de datos para tomar decisiones informadas sobre la salud de los cultivos, el riego, la fertilización y la gestión general de la granja.

La agricultura no se queda atrás en el siglo XXI, donde todo se está digitalizando. Mientras lees este artículo, varios agricultores repartidos por todo el mundo ya están utilizando tecnología para realizar diversas tareas en sus campos, como monitorear la humedad de las plantas, las condiciones del suelo, la salud general, las temperaturas e incluso mucho más mediante el uso de sensores.

Al adoptar la tecnología, los agricultores están disfrutando de los beneficios de tener estadísticas precisas en comparación con los viejos tiempos en que utilizaban suposiciones e intuiciones para tomar decisiones. Esto les ayuda a tomar mejores decisiones que resultan en cosechas más abundantes.

¿Qué es un sistema de monitoreo de cultivos?

El monitoreo de cultivos se refiere al proceso de observar, evaluar y recopilar sistemáticamente datos sobre los cultivos a lo largo de su ciclo de crecimiento.

Implica la observación regular y sistemática de los cultivos para recopilar información sobre su salud, crecimiento y desarrollo.

Su objetivo es tomar decisiones informadas sobre las prácticas de manejo de cultivos, optimizar la utilización de recursos y maximizar los rendimientos. Típicamente implica las siguientes actividades:

  • Inspección visual
  • Observaciones Fenológicas
  • Monitoreo de Suelos
  • Monitoreo del clima
  • Monitorización basada en sensores
  • Análisis de datos

Al monitorear los cultivos, los agricultores pueden abordar problemas de manera proactiva, optimizar la asignación de recursos y tomar decisiones informadas para mejorar la salud general del cultivo, el rendimiento y la rentabilidad. Es un componente esencial de la agricultura de precisión, que permite a los agricultores practicar una gestión de cultivos específica y sostenible.

Sistema inteligente de monitoreo de cultivos: ¿Cómo funciona?

Su objetivo principal es garantizar que la agricultura sea más fácil y rentable en comparación con los métodos tradicionales. Desde la visualización de datos sobre los campos hasta los pronósticos meteorológicos, a continuación se presenta todo lo que podría desear saber sobre el monitoreo remoto de cultivos y temas relacionados.

Un sistema inteligente de monitoreo de cultivos incorpora varias tecnologías para recopilar, analizar y utilizar datos para una gestión eficiente de los cultivos. Aquí se detalla cómo funciona típicamente:

1. Despliegue de Sensores

El sistema comienza desplegando sensores en el campo. Estos sensores pueden medir parámetros como la humedad del suelo, la temperatura, la humedad, los niveles de nutrientes y la intensidad de la luz.

También pueden incluir sensores meteorológicos para capturar datos sobre la lluvia, la velocidad del viento y la radiación solar. Los sensores se colocan estratégicamente en todo el campo para recopilar datos representativos.

2. Recopilación de datos

Los sensores desplegados recopilan continuamente datos del campo. Esto se puede hacer utilizando conexiones cableadas o inalámbricas.

Los sensores inalámbricos se utilizan comúnmente porque brindan flexibilidad y facilidad de implementación. Los datos recopilados se envían a un sistema central para su posterior procesamiento y análisis.

3. Transmisión de datos

Los sensores inalámbricos transmiten los datos recopilados a un concentrador o puerta de enlace central. Esto se puede hacer utilizando diversas tecnologías de comunicación inalámbrica como redes celulares, Wi-Fi o sistemas de radio dedicados. La transmisión de datos puede ser en tiempo real o a intervalos regulares dependiendo de la configuración del sistema.

4. Almacenamiento y procesamiento de datos

Los datos recopilados se almacenan en una base de datos para su posterior análisis. Se aplican técnicas avanzadas de procesamiento de datos, incluidos algoritmos de aprendizaje automático y modelos estadísticos, a los datos para extraer conocimientos y patrones significativos. Este análisis ayuda a identificar correlaciones, tendencias y anomalías en las condiciones de los cultivos.

5. Soporte de Decisiones y Alertas

Basado en los datos analizados, el sistema proporciona apoyo a la toma de decisiones para agricultores o agrónomos. Genera alertas y notificaciones sobre eventos críticos, como niveles de humedad del suelo que caen por debajo de un umbral o la presencia de plagas o enfermedades.

Estas alertas se entregan a través de paneles basados en web, aplicaciones móviles o notificaciones por correo electrónico/SMS, lo que permite intervenciones oportunas.

6. Visualización e Informes

El sistema presenta los datos analizados de manera amigable para el usuario a través de visualizaciones e informes. A menudo se utilizan gráficos, tablas y mapas para transmitir información sobre la salud de los cultivos, los patrones de crecimiento y las condiciones ambientales. Esto ayuda a los agricultores a interpretar los datos fácilmente y a tomar decisiones informadas.

7. Automatización y Control

En algunos casos, puede integrarse con sistemas de riego automatizado, sistemas de fertirrigación o maquinaria.

Basado en los datos recopilados y el análisis, el sistema puede controlar automáticamente los cronogramas de riego, ajustar las tasas de aplicación de nutrientes o activar medidas de manejo de plagas.

Esta integración permite la toma de decisiones en tiempo real impulsada por datos y un control preciso sobre las prácticas de manejo de cultivos.

El objetivo final de un sistema inteligente de monitoreo de cultivos es optimizar la utilización de los recursos, mejorar la productividad de los cultivos y reducir los costos al proporcionar a los agricultores información precisa y oportuna para la toma de decisiones. Al aprovechar la tecnología, estos sistemas permiten prácticas de manejo de cultivos más eficientes y sostenibles en la agricultura moderna.

La importancia de un sistema de monitoreo remoto de cultivos

Entre las tareas más importantes que siempre se realizan para obtener buenos rendimientos se encuentra el monitoreo de cultivos. Dado que las plantas son monitoreadas constantemente, se asegura que crezcan en las mejores condiciones y, en caso de cualquier anomalía, se corrige a tiempo, reduciendo así el devastador impacto inminente.

Como agricultor o entusiasta de la agricultura, cabe señalar que actualmente es imprescindible esperar cosechas masivas mejores y de mayor calidad, ya que la mayoría de los inconvenientes se solucionan con suficiente antelación.

Desde seguimiento de cultivos es uno de los requisitos fundamentales para una buena cosecha, se necesita recibir entrenamiento especial. El entrenamiento especial no significa que se necesite tener un título de maestría o licenciatura, solo se necesita entender cómo coordinar, monitorear e incluso sopesar los resultados obtenidos. A través de esto, podrás tomar mejores decisiones basadas en un diagnóstico preciso y, posteriormente, obtener los mejores rendimientos de calidad.

Al optar por monitorear sus cultivos, debe saber que, además de la prevención de infestaciones y la propagación de plagas, enfermedades e incluso malezas, estas siempre están bajo control, por lo que no habrá efectos devastadores que reduzcan el rendimiento e incluso la calidad de los productos finales.

¿Eres consciente de que los cultivos están siempre expuestos a extrañas amenazas anualmente debido a mutaciones y transformaciones en los componentes biológicos de las plagas, por lo que elegir un método similar para tratarlas significa que te equivocas y necesitas cambiar de táctica cada vez?

Por esa razón, el monitoreo de cultivos es percibido como una tarea seria que necesita más responsabilidad y que no debe ser degradada.

Cuando se monitorean cultivos de frutales como peras e incluso manzanos, al utilizar un Programa de Manejo Integrado de Plagas, es aconsejable no solo rastrear los cambios en los árboles sino también revisar el clima en el área que los afecta.

Esto te permite tener una lista de posibles plagas que puedan representar una amenaza para el crecimiento de los árboles. El uso de un monitoreo visual sistemático del bloque frutal funcionará siempre que quieras reducir el costo y tu tiempo desde la temporada de siembra hasta la temporada de cosecha.

Clima y plagas

La parte cuestionable al analizar la influencia del clima es simplemente que algunas plagas pueden alimentarse de él y luego ser tóxicas para los cultivos tan rápido. Básicamente, en la agricultura, muchos agricultores siempre carecen de conciencia, por lo que notan cuando ya es demasiado tarde y sus cultivos ya están masivamente infestados de plagas.

La mejor parte de esto es que las plagas siempre reaccionan de manera predecible al clima, por lo tanto, se puede diseñar una estrategia perfecta para evitar otro ataque de plagas y también para prevenirlas en el futuro.

A pesar de que la monitorización se realiza con más frecuencia, los agricultores de frutas y verduras siempre se enteran de la presencia de plagas o cualquier amenaza un poco tarde. Esto demuestra la importancia de monitorizar los factores climáticos que eventualmente resultan ser signos tempranos de la aparición y la infestación de plagas.

Monitoreo de cultivos en bloque

Se pueden utilizar muchas formas para monitorear cultivos, y una de ellas es a través del monitoreo visual utilizando bloques que le permiten analizar árboles que tienen características similares basándose en su variedad, edad e incluso condición física.

La idea detrás del monitoreo visual es tener bloques que actúen como señales y que puedan ser estudiados como si fueran una unidad y no por separado, ya que es una forma utilizada por varios agricultores en todo el mundo y que los expertos en horticultura siempre tienen tiempo limitado para revisar cada uno de los bloques dispuestos en el campo.

importancia de un sistema de monitoreo remoto de cultivos

Se debe prestar atención a la hora de seleccionar el bloque más apropiado. Esto se debe a que el bloque que se elija debe tener todo el historial de las plagas para que se pueda aplicar el mejor tratamiento y prevención para proteger el crecimiento de otros árboles.

No tienes que tener equipo grande, herramientas e incluso métodos complejos para monitorear tus cultivos. Una de las mejores maneras es simplemente hacer un examen visual meticuloso y extenso que te permita notar los diferentes tipos de plagas presente en los árboles.

Esto se puede completar siempre usando una lente común, sin embargo, los expertos siempre usarán equipos más complejos como un microscopio binocular. Esto les permite contar e incluso identificar ácaros y trips.

Temperatura de los cultivos

Para medir con precisión la temperatura al monitorear cultivos, se puede optar por usar un termómetro simple después de obtener información básica. Además de eso, también puedes optar por usar un termómetro de máximas y mínimas, que es muy común entre los proveedores rurales, y registrar información adicional.

También vale la pena señalar que se debe colocar el termómetro en el huerto y asegurarse de que no esté expuesto a la luz solar directa. También puede agregar un registrador de datos para registrar información meteorológica más precisa.

Para registradores de datos, también puede optar por utilizar aquellos que tienen el potencial de medir la temperatura, la lluvia, la humedad e incluso la humedad de las hojas.

Para que puedas apartar los árboles que no serán estudiados con los que estarán en los bloques que actuarán como indicadores, para que puedas diferenciarlos, simplemente necesitas marcarlos con pintura acrílica o incluso cinta adhesiva.

La aplicación de un Manejo Integrado de Plagas avala la selección y marcado de flores, botones y frutos al azar para monitorear cada uno de los árboles.

Después de aproximadamente una o dos semanas de duración, en el momento en que el fruto se está desarrollando, los agricultores deben dedicar de diez a veinte minutos por cada hectárea a gestionar estrictamente los frutos, flores y capullos marcados, buscando cualquier señal que pueda mostrar la presencia de una o incluso más plagas en el cultivo.

Cada vez que se detecta una plaga en los cultivos, es necesario registrarla de forma rápida y detallada en el registro hecho exactamente para este tipo de datos.

Conclusión

Todo nuestro equipo experto de agrónomos son profesionales en una variedad de ramas de la agricultura y también son capaces de brindar servicios de monitoreo combinando visitas de campo con evaluaciones cuantitativas y cualitativas y un sistema de monitoreo remoto de cultivos agrícolas.

Todos estos sistemas innovadores son evaluaciones que se centran en una amplia gama de actividades que monitorean cuidadosamente el desarrollo de los cultivos, recopilando datos e información relacionados con el área.

Estos datos son analizados cuidadosamente por nuestro equipo profesional y luego se anotan en un informe final que les permite mencionar y evaluar factores importantes y factores que son capaces de afectar la productividad de los cultivos.

Basándose en estos resultados, GeoPard puede proporcionarle una estimación del tiempo de cosecha y también del rendimiento de los cultivos. Esto permite a los clientes monitorear sus cultivos sin problemas a través de imágenes satelitales recientes. Capas de datos de peso en un lugar determinado sin utilizar una instalación determinada.

Tipos de Teledetección en Agricultura

There has been an increase in the utilization of advanced tech type systems like remote sensing in agriculture recently. Agricultural practices today are significantly more effective, coherent, and streamlined in contrast with conventional agrarian practices.

The use of advanced methods, for instance, crop yield estimation in all aspects of the cultivating process can produce an ideal yield and a better harvest.

To guarantee a higher yield, farmers need to ensure the best health of their crops. While the use of customary systems restricted the observation of bigger regions, as the farmers were relied upon to physically visit all parts of the land.

The most recent innovation has given an assortment of ways through which farmers can without much of a stretch screen the quality of crops in bigger regions.

What is remote sensing?

Definir: Remote sensing is a field of study and technology that involves gathering information about the Earth’s surface or other objects from a distance. It utilizes various devices and sensors, such as satellites, airplanes, and drones, to collect data without making physical contact with the target.

Simply, it involves the checking of land from advanced equipment from far distances. The checking includes the physical characteristics of a piece of land.

The process works by estimating the produced and reflected radiation from the land, which helps structure a picture of the land and assists specialists with passing judgment on specific parts of the land.

These electromagnetic waves include visible light, infrared, and microwave radiation. By analyzing the characteristics of the radiation, it enables scientists to extract valuable information about the Earth’s features and processes.

It has a wide range of applications across various disciplines, including environmental monitoring, agriculture, urban planning, and disaster management. It provides a means to observe and study large areas of the Earth’s surface, which would be challenging or impossible to access directly.

What is Remote Sensing used for?

To augment desarrollo de cultivos and increase yield in a tough market, producers tend to exploit the most recent tech accessible. To guarantee the greatest yield, farmers need the harvests to remain in the most ideal health.

Observing the strength of harvests over a huge region becomes significantly simpler with the utilization of remote sensing in agriculture.

The data gathered from the process supports precision growing, empowering farmers to accomplish higher yields from their harvests. Some common remote sensing applications include:

  • Land cover and land use mapping: It can identify and classify different types of land cover, such as forests, crops, water bodies, and urban areas. This information helps in monitoring changes in land use, assessing deforestation, managing natural resources, and planning urban development.
  • Environmental monitoring: It allows for the observation and analysis of environmental parameters like vegetation health, water quality, air pollution, and climate change indicators. It aids in monitoring and understanding natural phenomena, such as wildfires, droughts, and the melting of polar ice caps.
  • Agriculture and crop management: Agricultural remote sensing can assess crop health, estimate crop yields, and identify areas affected by pests or diseases. This information assists farmers in making informed decisions about irrigation, fertilization, and pest control, leading to improved crop productivity and resource management.
  • Gestión de desastres: It plays a crucial role in disaster response and recovery efforts. It helps in mapping the extent of natural disasters like hurricanes, floods, and earthquakes, enabling efficient allocation of resources and aid distribution. It also aids in assessing post-disaster damages and planning reconstruction activities.
  • Geology and mineral exploration: Its techniques, such as hyperspectral imaging and radar, can detect and characterize geological features and mineral deposits. This information supports geological mapping, mineral exploration, and resource assessment.

Remote sensing techniques continue to evolve with advancements in sensor technology, image processing algorithms, and data analysis methods.

With the increasing availability of high-resolution satellite imagery and the integration of remote sensing data with geographic information systems (GIS), its applications and potential are expanding, contributing to a better understanding of our planet and facilitating informed decision-making processes.

How does Remote Sensing Work?

It works by capturing and analyzing electromagnetic radiation emitted or reflected by objects or surfaces on Earth from a distance. Here is a simplified explanation of how remote sensing operates:

How does Remote Sensing Work?

  • Energy source: It begins with an energy source, which can be natural (e.g., sunlight) or artificial (e.g., active sensors like radar). The energy source emits electromagnetic radiation towards the Earth’s surface.
  • Interaction with the target: The emitted energy interacts with the target objects or surfaces. Some of the energy is absorbed, some is reflected, and some may be transmitted through the target. The interaction depends on the properties of the target, such as its composition, texture, and moisture content.
  • Sensor detection: Sensors, typically located on satellites, aircraft, or drones, detect the energy that is reflected or emitted by the target. These sensors can capture a wide range of wavelengths, including visible, infrared, and microwave.
  • Data acquisition: The sensors collect data in the form of digital images or measurements. The data acquired may include the intensity of reflected or emitted energy at different wavelengths.
  • Data transmission and storage: Once collected, the data is transmitted to ground stations or stored on-board the sensor platform. It is then processed and made available for further analysis.
  • Data processing and analysis: Remote sensing data is processed using specialized algorithms and techniques. This includes corrections for atmospheric interference, geometric distortions, and radiometric calibration. The processed data is then analyzed to extract meaningful information about the Earth’s surface.
  • Interpretation and application: The analyzed data is interpreted by experts, such as scientists, geographers, or agronomists. They identify and classify objects, map land cover types, monitor changes, and extract relevant information for various applications.
  • Visualization and communication: The final results are often visualized through maps, images, or other graphical representations. These visual outputs make it easier for decision-makers, scientists, and the public to understand and interpret the information.

It’s important to note that it can utilize both passive and active sensing techniques. Passive sensors detect the naturally occurring energy (e.g., sunlight) that is reflected or emitted by the Earth’s surface. Active sensors, on the other hand, emit their own energy (e.g., radar pulses) and measure the energy that is reflected back.

How It Works In Agriculture?

The process of remote sensing in agriculture works through information gathered by different devices over a period. The gathered data can then be used to analyze different aspects of the crop and yield.

This analysis is used for making changes to the crops to ensure maximum output. The process can be used to conduct a variety of analyses and implement measures accordingly. Common threats faced by farmers are pest infestation and weeds in the crops.

In agriculture, it can help detect those early on and warn the farmers to take the necessary countermeasures to ensure the health of crops. To carry out the process over different areas of land fluctuating in sizes and sorts of harvests, various kinds of devices and sensors are utilized.

Tipos de Teledetección en Agricultura

In agriculture, remote sensing techniques encompass various methods for collecting and analyzing data about crops and agricultural landscapes. Here are some common types of remote sensing used in agriculture:

1. Optical sensing: Optical sensors capture electromagnetic radiation in the visible, near-infrared (NIR), and thermal infrared (TIR) regions of the electromagnetic spectrum. They provide valuable information about crop health, vegetation indices, and land cover. Optical sensing data is commonly acquired through satellite imagery or aerial photography.

2. Multispectral sensing: Multispectral sensors capture data in several discrete bands within the electromagnetic spectrum. They enable the analysis of specific wavelengths relevant to vegetation health and crop monitoring. Multispectral data is commonly used to calculate vegetation indices like NDVI (Normalized Difference Vegetation Index) and EVI (Enhanced Vegetation Index) for assessing crop conditions.

3. Hyperspectral sensing: Hyperspectral sensors capture data in hundreds of narrow and contiguous spectral bands across the electromagnetic spectrum. This high spectral resolution allows for detailed analysis and identification of specific materials and vegetation characteristics. Hyperspectral data is valuable for disease detection, nutrient assessment, and detailed crop classification.

4. Thermal sensing: Thermal sensors capture data in the TIR region of the electromagnetic spectrum. They measure the emitted radiation from objects, including crops and soil, which is related to their temperature. Thermal sensing is useful for assessing water stress, detecting irrigation efficiency, and monitoring crop health based on temperature variations.

5. Radar sensing: Radar sensors utilize microwave radiation to penetrate cloud cover, vegetation, and soil, allowing for data acquisition regardless of weather conditions. Radar sensors measure the backscattered signal, which provides information about the structure and moisture content of crops and the terrain. Radar data is valuable for mapping topography, monitoring soil moisture, and assessing crop growth stages.

6. LiDAR sensing: LiDAR (Light Detection and Ranging) sensors emit laser pulses and measure the time it takes for the reflected light to return. LiDAR data provides highly accurate three-dimensional information about crop height, canopy structure, and terrain elevation. It is useful for precision agriculture applications, including crop height estimation, terrain modeling, and canopy characterization.

7. Unmanned Aerial Vehicles (UAVs): UAVs equipped with various sensors, such as RGB cameras, multispectral sensors, or thermal sensors, enable high-resolution and flexible data collection at a localized scale. UAVs provide detailed and timely information for crop monitoring, disease detection, and precision agriculture practices.

These different types of remote sensing techniques offer complementary data sources and capabilities, allowing for a comprehensive understanding of agricultural systems.

By integrating and analyzing data from multiple sources, farmers, agronomists, and researchers can gain insights into crop health, growth, nutrient status, water management, and other essential factors that contribute to effective agricultural management.

Types of Sensors

Sensors of various sorts are utilized together to gather various kinds of information over fluctuating sizes of grounds. Sensors are fundamentally categorized into their logistical types. There are satellite sensors, Aerial sensors, and ground-based sensors.

These sensors can be further categorized such as the ground sensors and can come in varying configurations. There are handheld ground sensors, there are vehicle-mounted ground sensors, such as the ones mounted to tractors and there are free-standing ground sensors that are typically mounted to posts and bigger trees.

Ground-based sensors are commonly used for checking the nutrient levels, the moisture content in the soil, and the weather. Using these many changes regarding the use of fertilizers and irrigation can be made to keep the yield high.

The next category of sensors is Aerial sensors. Through the availability of drones, aerial sensors have become quite affordable and accessible.

These aerial sensors can take high-resolution pictures of the land, as well as collect other sensor data cruising at low altitudes for longer periods of time over the crops. The data collected through these sensors can help with weed detection, estimating yield, and other detailed analyses such as measuring the soil salinity and the chlorophyll content.

While they have become accessible and affordable, they are still rendered inoperable in strong winds and cloudy weather, which is a downside of their use.

The farthest of all the sensor platforms for imaging is the satellite sensor. The use of satellites for any kind of imaging was traditionally for governments and militaries. Using satellite imaging in agriculture helps cover a vast area of land and can help with checking crop status.

After an event of a natural disaster, it can help calculate the loss and help estimate crop yield. While there are many upsides to using satellite sensor data, there are many caveats attached to it, for starters, it is expensive and even if you put the cost aside, the imaging must be requested for a specific time typically months in advance.

Which could all be for nothing if there is cloud cover in the requested area at the requested time. Governments across the world have started to open satellite imaging for the public, which could make the process a lot easier in the future.

Working of the Sensor

By identifying the colors in a field of crops, sensors relay information that can be helpful in deducing the status of a plant’s health. Looking at the color of the plant through precise data provided by the sensors, the chlorophyll levels of a plant can be measured through which a farmer can determine any lack in nutrition or a problem with a plant’s health.

The simple data can be extracted through common color sensors, but to get complex information, infrared and short-wave sensors are used.

Working of the Sensors in agriculture

The reflection of light from leaves changes in the infrared spectrum if the leaf is damaged internally, this can also show if there isn’t sufficient water content. One of the most reliable models in agricultural remote sensing is known as the normalized difference vegetation index or NDVI.

Using infrared and Red-Edge sensors, the NDVI model can easily identify damaged crops, which gives farmers more reaction time to take effective countermeasures to save the crops.

These sensors can likewise be utilized to check soil health and measure soil saltiness. Soil with unnecessary salt substances will in general be brighter in the infrared range, which can assist with identifying the soil which needs more water system and treatment.

The utilization of thermal sensors can assist in optimizing the irrigation framework. The heat emitted from any source is displayed as a lighter tone in the infrared range.

After irrigation a farmer can send an aerial Long-frequency Infrared sensor or LWIR over his fields to check which regions are radiating heat due to poor water systems, so the issues with the irrigation framework can be fixed.

Satellite sensors can cover a wide assortment of capacities. As they can bypass climate conditions, they are ideal for horticultural observing. Aside from the Radar and microwave sensors, the GPS from the satellites gives exact location information which is fundamental in new agricultural innovations like self-operated farming hardware and self-driving farm vehicles.

Role and Advantages of Remote Sensing and GIS in Agriculture

It plays a vital role in agriculture by providing valuable information and insights that contribute to improved crop management, increased productivity, and sustainable farming practices. Here are some key ways in which remote sensing is important in agriculture:

Crop Sown Area Estimation

One of the critical uses of remote sensing in horticulture is the assessment of the Crop sown region. Data from aerial and satellite sensors give a precise analysis of planted regions and helps with risk evaluation if there ought to be an event of disaster or catastrophe.

Role and Advantages of Remote Sensing and GIS in Agriculture

Crop health assessment

It allows farmers and agronomists to monitor the health and vigor of crops over large areas. By analyzing satellite or aerial imagery, they can detect early signs of stress, nutrient deficiencies, disease outbreaks, or pest infestations. This early warning system enables timely interventions and targeted treatments, reducing crop losses and optimizing resource allocation.

Yield estimation and forecasting

The data, combined with statistical models, can help estimate and predict crop yields. By analyzing vegetation indices and monitoring factors like canopy cover and biomass, farmers can anticipate potential yield variations and make informed decisions regarding harvesting, storage, and marketing of their produce.

Crop Disease Identification

Gis remote sensing in agriculture makes it simpler to recognize contaminations and pest attacks in crops over huge areas at starting stages. This gives producers an adequate opportunity to apply any counter means to safeguard the harvests from any tremendous losses. This becomes possible through satellite imaging and examination.

Soil Properties

Perhaps the primary element in ensuring a sound yield of harvests is the appropriate support of soil. It directly influences the harvest. Any progressions in farm management or farming system cause soil changes, which in turn influence soil capacity of production.

Characteristics, for instance, Soil salinity, Soil pH, organic substance level, and soil texture can be recognized using remote detection and that data can be analyzed to carry out any significant soil treatment.

Soil moisture mapping gives a precise assessment of water content in the soil which can help with carrying out any upgrades in the irrigation system structure.

Irrigation management

Water is a critical resource in agriculture, and it plays a crucial role in optimizing its usage. By assessing vegetation moisture levels and evapotranspiration rates, it helps farmers determine the precise water requirements of their crops.

This information enables them to implement efficient irrigation strategies, reducing water waste, and ensuring that crops receive adequate moisture for optimal growth.

Flood Impact

Through satellite-based sensors and the data assembled through ground sensors, it can help with giving a ton of definite information to decide an accurate loss assessment.

In case of flooding due to excess rainfall, the areas of land with poor drainage frameworks are at risk of waterlogging which causes basic loss of harvests and yield.

The loss assessment can help with further planning for the damage control and countermeasures for keeping losses to a minimum.

NATCAT Modeling

Remote Sensing in agriculture can assist with assessing current and forecasting Natural Catastrophe hazards. Utilizing the information relayed by sensors and the behavior of regular risks.

This requires risk mapping and calculating hazards through estimating hazards which are finished by PC simulated disaster models.

Remote sensing maps prepared with the assistance of historic information and present information gathered from various sensors help in assigning areas of high capability of flooding with high hazard ratings.

This aids in farming as regions with higher risk ratings are not planted on and get treated for better flood protection for the subsequent season.

Drone Image Analysis for Crop Damage Assessment

Drone picture analysis is utilized in crop assessment for damages because of hailstorms, tree counting, and invasions. The drone imagery is as accurate as the input spatial resolution. Which can be increased as per the requirement.

Nutrient management

It can assist in assessing nutrient deficiencies and managing fertilization practices. By analyzing spectral reflectance patterns, farmers can identify areas of the field with varying nutrient levels.

This allows for targeted application of fertilizers, minimizing excess use and potential environmental contamination while maximizing crop nutrient uptake and productivity.

Environmental impact assessment

It provides a means to assess the environmental impact of agricultural practices. It helps in monitoring soil erosion, evaluating the effectiveness of conservation measures, and identifying areas of potential pollution, such as excessive fertilizer runoff or pesticide drift.

This information supports the implementation of sustainable farming practices, minimizing negative environmental effects and promoting long-term agricultural sustainability.

By leveraging the power of remote sensing technologies, farmers and agricultural professionals can make more informed decisions, optimize resource allocation, and implement sustainable practices. This leads to increased productivity, reduced environmental impact, and improved food security, ultimately benefiting both farmers and consumers.

Detección de Nubes y Sombras en Agricultura

Cloud and Shadow detection is one of the most important tasks in analytical remote sensing solutions.

If the whole satellite image is 90% clean, there is still a 10% chance that your field will be under clouds/shadows area. The reverse is also true – many systems do not process images with clouds above 70% – although the remaining 30% can help the agronomist or farmer to make the right decision during the season.

At GeoPard, we solve this problem with the help of several machine learning algorithms that work with very high accuracy.

The determination of clouds and cloud shadows


We define a cloud mask and a shadow mask at the level of the whole image, and for each field-image pair, we consider what percentage of the field is covered by clouds or shadows from the clouds.

In automatic analytics, we take only completely cloudless images for a specific field, which allows the user to be confident in making decisions based on multi-year analytics.

The GeoPard user has the opportunity to view and even run the analytics himself, even on partially cloudy images.

define a cloud mask and a shadow mask


This can still be very useful, for example, during the season to apply Variable Rate spraying with crop protection products based on the latest satellite image, in which 10% of the field’s area is under the clouds. This means that for 90% of the field’s area, the decision will be based on verified data.

Also, users of GeoPard can easily check source images on a regional level in Near-Infrared view, which helps to distinguish clear land from clouds and shadows (see picture attached).

On UI cloud filter is located in the top menu of “Satellite monitoring” module, see screenshots attached.

geopard detected that field is partially located under clouds and shadows


Keep in mind that digital ag companies can still struggle with the correct detection of clouds and shadows. In the attached screenshot one such a company creates VR fertilizer map based on clouds and shadows data. So the wrong map leads to wrong agronomic decisions and wrong outcomes in the end.

GeoPard detects clouds and shadows with a high level of accuracy and doesn’t propose to make your Variable Rate decision based on clouds. You can always look at the source images in different views and indices and zoom out to see the picture around.

created VR fertilizer map based on clouds and shadows data


Not every solution is the same, choose the best options available on the market!


different spectral indices

What is Cloud Detection in Precision Agriculture?

Cloud detection in precision agriculture refers to the process of identifying and monitoring cloud cover in agricultural areas using remote sensing technologies. Clouds can significantly impact agricultural practices and crop productivity, making their detection and analysis crucial for effective farm management.

It involves the use of various sensors, such as satellites, drones, or ground-based instruments, to capture imagery of agricultural fields. These sensors capture data in the form of visible and infrared light, which can be analyzed to determine cloud presence and characteristics.

Its primary purpose in precision agriculture is to assess the spatial and temporal distribution of clouds over agricultural areas.

This information helps farmers and agronomists make informed decisions regarding irrigation, fertilization, pest control, and other farming practices. By understanding cloud cover patterns, farmers can optimize resource allocation and minimize the risk of crop damage or yield reduction.

Cloud detection algorithms analyze the captured imagery to differentiate between cloud pixels and non-cloud pixels.

These algorithms utilize various techniques, such as thresholding, spectral analysis, and machine learning, to identify and classify cloud formations accurately.

The output of algorithms typically includes cloud coverage percentage, cloud type classification, and cloud movement patterns.

Once clouds are detected and their characteristics are determined, farmers can utilize this information to implement precision agriculture techniques.

For example, if a cloud is detected over a specific area of a field, farmers may delay irrigation or pesticide application in that region until the cloud passes. By synchronizing agricultural activities with cloud movements, farmers can optimize resource utilization and minimize unnecessary inputs.

It is particularly beneficial in regions with high cloud cover or where weather patterns change rapidly. By continuously monitoring cloud cover, farmers can adapt their farming practices in real-time, making adjustments based on current weather conditions.

In summary, cloud detection in precision agriculture plays a crucial role in optimizing farming practices and resource management. By accurately identifying and monitoring cloud cover, farmers can make informed decisions to enhance crop productivity, reduce input wastage, and mitigate the risks associated with changing weather conditions.

Análisis ráster

Satellite imagery resolution may vary and the most popular free providers have 10m (Sentinel2) and 30m (Landsat). From time to time such quality is not enough.

Therefore, the GeoPard team adjusts comprehensive scientific algorithms (e.g. also used in medical diagnostic) for agricultural fields to improve the quality of GeoPard raster and vector analytics.

It helps to increase the accuracy of the GeoPard maps to 3-10 times comparing to the original resolution of a source satellite image. For example, the spatial resolution of the GeoPard management zones map is ~3m.

If you are a crop grower or ag consultant, start to utilize https://geopard.tech/ cutting edge analytics for your fields for an affordable price.

If you are a service provider, integrate https://geopard.tech/ analytics via API into your platform and start to give value to your customers right away.

How to read NDVI imagery?

Reading NDVI imagery involves a few key steps. First, understand that NDVI measures the health and vigor of vegetation. High NDVI values indicate healthy and dense vegetation, while low values suggest stressed or sparse vegetation.

To interpret NDVI imagery, compare the color scale provided with the image, where green or dark green represents healthy vegetation, and yellow or red indicates stressed or non-vegetated areas.

By analyzing the patterns and variations in NDVI values across an area, you can gain insights into the health and distribution of vegetation, helping with tasks like crop monitoring and land management.

GeoPard Agricultura

wpChatIcon
wpChatIcon

    Solicita una demostración / consulta gratuita de GeoPard


    Al hacer clic en el botón aceptas nuestra Política de privacidad. Lo necesitamos para responder a tu solicitud.

      Suscríbase a


      Al hacer clic en el botón aceptas nuestra Política de privacidad

        Envíenos información


        Al hacer clic en el botón aceptas nuestra Política de privacidad