A Joint Case by GeoPard & Databoerin
Potatoes are a high-value crop where even small improvements in yield and efficiency can make a big difference to profitability. By combining advanced analytics from GeoPard Agriculture, a global platform for precision ag data integration and field-level analytics, with agronomic expertise from Databoerin, an independent crop advisor in the Netherlands working closely with potato growers, we demonstrate how farmers can unlock additional value through precision management.
Case study: a 30 ha potato field in the Netherlands
We analyzed a 30 ha potato field in the Netherlands to evaluate how better-informed fertilization strategies affect yield and profitability. The GeoPard platform integrates satellite monitoring, machine data, and agronomic models to identify variability within fields and provide decision support. Databoerin brings practical agronomy experience and ensures that insights translate into actionable farm management steps.
Approach: optimal nitrogen fertilization
Optimal nitrogen fertilization means tailoring the application as closely as possible to the needs of the crop. This is not straightforward, especially on soils where large amounts of nitrogen can mineralize depending on the weather conditions.
The most reliable strategy is nitrogen division:
- At the start of the season, a basic fertilization (≈60% of the recommended N) is applied using a combination of manure and fertilizer. Fertilizer ensures a quick start of plant growth, while manure releases nutrients more slowly.
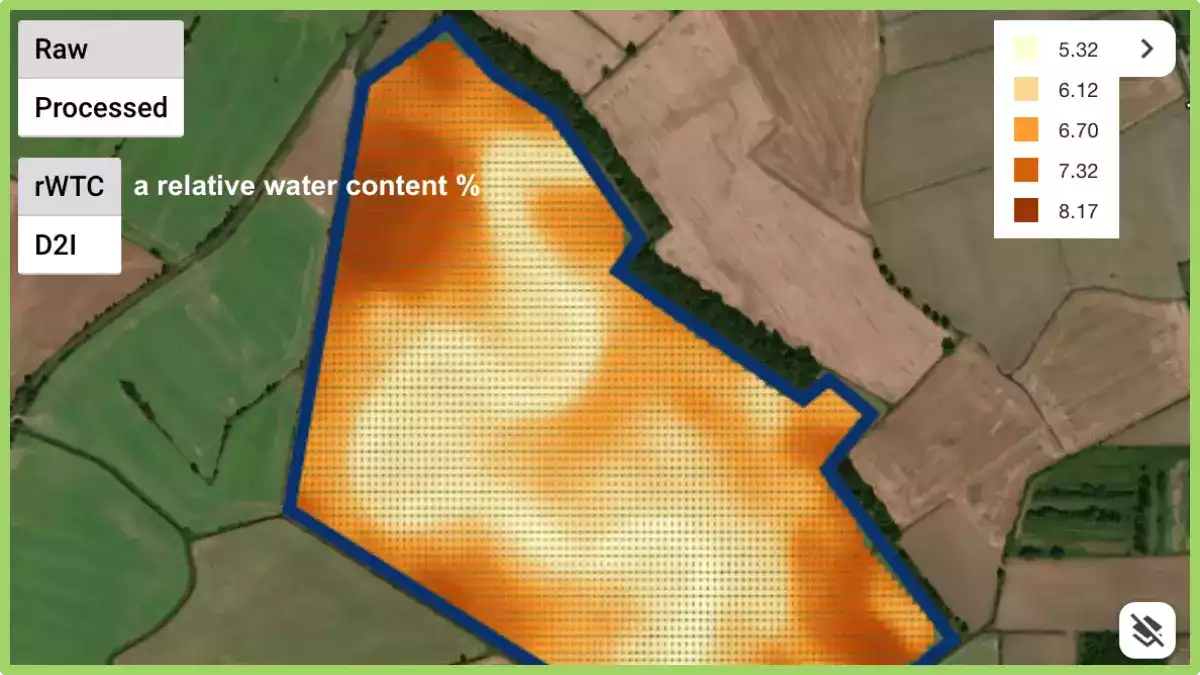
- Later in the season, around crop closure, side-dressing is applied to match actual crop needs. Crop demand at this stage is assessed via chlorophyll content in the leaves, which has a direct correlation with nitrogen uptake.

Crop demand at this stage is assessed via chlorophyll content in the leaves, which has a direct correlation with nitrogen uptake.
How technology supports decision-making
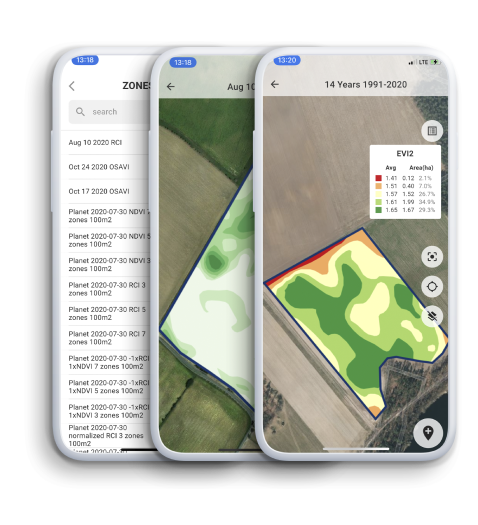
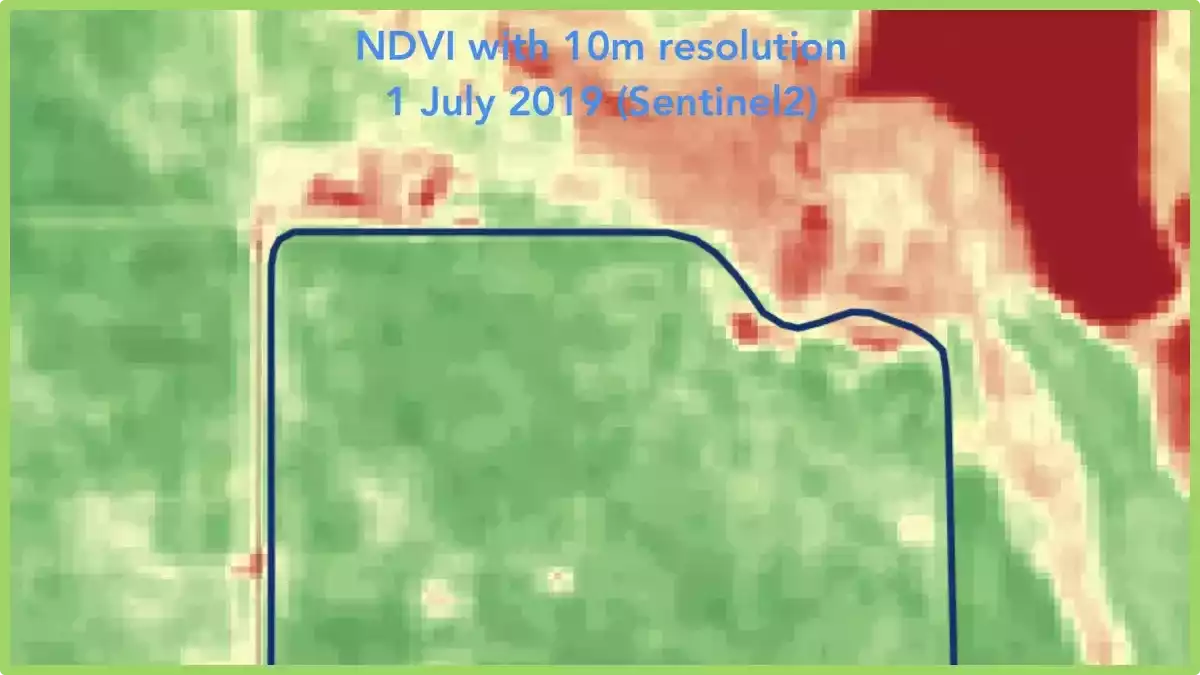
Using Sentinel satellite imagery, GeoPard processes cloud-free images within one day and calculates the RedEdgeChlorophyll index, which indicates the chlorophyll content of the crop.
Based on the crop-growth model, the optimal uptake of nitrogen is calculated, and the difference is converted into a variable-rate application (VRA) map for the fertilizer spreader. This ensures each zone of the field receives exactly what is needed.

Results from practical tests
Multiple years of practical testing confirm that:
- 5–10% additional yield can be achieved with the same total amount of fertilizer, simply distributed more precisely across the field.
- Crop development becomes more uniform. Remaining variability is often due to potato variety differences, visible in the EVI2 vegetation index.
- A more even crop stand ensures more uniform protection against phytophthora, more uniform ripening before harvest, and overall improved crop quality.
Economics of precision management
For the economic calculation, we use practical field figures provided by Databoerin:
- An average yield: 46.2 t/ha
- Potato farmgate price: €200 per ton
- Nitrogen fertilizer cost: €370 per ton
- Average yield uplift: +5%
- Fertilizer saving: -10% (100 kg N/ha = €37/ha)
Fertilizer savings
- €37/ha saved
- For 30 ha: €1,110 saved
Yield increase (+5%)
- €462/ha additional revenue
- For 30 ha: €13,860 additional revenue
 Economic benefits of optimal nitrogen fertilization
Why this matters
Even with conservative potato prices (€200 per ton) and realistic fertilizer costs, precision nitrogen management delivers around €15,000 additional value for a 30 ha field per season. Since other major costs (land, seed potatoes, machinery) remain unchanged, this benefit flows directly into the farm’s bottom line.
The combined approach of GeoPard analytics and Databoerin agronomy proves that digital tools and local expertise together can make farming more profitable, sustainable, and resilient.
About the authors
This case study was prepared jointly by GeoPard Agriculture and Nicole Bartelds, Director and Smart farming advisor at Databoerin. GeoPard provides the analytical engine for precision agriculture, while Databoerin brings local agronomic expertise and close farmer engagement. Together, we aim to support potato growers in making smarter, data-driven decisions.
To find out how GeoPard can provide geospatial analytics that inform your agricultural business or operation, please contact us and we would be delighted to help.
Use-cases