Topography analytics
Create topographic models from machinery, remote sensing and LIDAR datasets
Try for freeCreate topographic models from machinery, remote sensing and LIDAR datasets
Try for free


For every passionate grower and interested.
Unbeatable yearly subscription offer with all functionality.
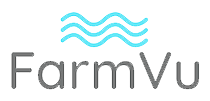
Based on remote sensing data sources and on machinery data. Topography and derivatives such as Elevation, Slope, Aspect, HillShade etc, are available for visualization and delineation of management zones. Example of use:

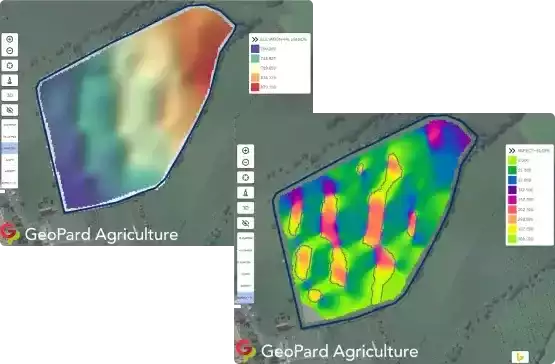
Almost any modern machinery has a GPS receiver which is capable of gathering elevation data, quite often accuracy is improved with Real-time kinematic (RTK). a machinery data-based digital elevation model will be a perfect option and significantly improves knowledge about the field. Сreate zones out of machinery elevation data with Zones Creator, use this data in the Zones Ops module (finding of overlappings among different datasets) and use it in multi-layer analytics.
Partners


Winning teams choose GeoPard


GeoPard’s analytics have made it easy for our team and farmers to use precision ag tools effectively. Reliable analytics and consistent support throughout the season have improved input planning and management. We are confident that the synergy between our department and GeoPard will bring significant changes and benefits to our customers.

We are happy to have GeoPard as part of the platforms working with SoilOptix® data to enable growers and agronomists with the tools to accurately and visually analyze and manage their fields.

GeoPard Agriculture is a system in which I can store my own data, and also receive current information from satellite images directly from my fields. A system that securely stores my own data ‘in the cloud’, so that I have access to the stored information at any time and at any location. But I also think it’s important that the data is only shared with others if I give permission for this myself, and if I no longer want to share the data, then I can immediately stop the data sharing.

Data visualization leads to the creation of ideas and analytics helps us to solve problems. GeoPard’s platform not only helps us visualize data but also gives us the tools to analyze data so we can create solutions and write prescriptions agronomists.

Using Geopard has streamlined key parts of our workflow. In seasons where time is money, we can rely on the team at Geopard to get it done.

Geopard is a great tool for us to build management zones with. When we don’t have access to multiple years worth of yield data for a grower, we can utilize GeoPard and the 20+ years of satellite imagery it gives us to build our management zones.

It is a pleasure to cooperate with GeoPard. Not only the solutions are innovative, but also the service is excellent.

When I compare the +20 year GeoPard product map to fields we have a multiple year average yield data its a very close match. The +20 year average map is an excellent product for growers lacking good yield data.


Select your plan
Get “Start” Plan for
Get started to explore GeoPard on a couple of fields. Also suitable for viewing.
Get “Grow” Plan for
For average size farmers managing fields mostly by themselves.
Get “Expand” Plan for
Perfect for Ag consultants and service providers approximately 30k - 100k ac.
Get “Enterprise” Plan
For teams that require Ag data analytics platform and infrastructure for their business.
Ready?


