How to Create a Variable Rate Prescription Map

A variable rate prescription map tells your machine how much to apply in each part of a field instead of one rate everywhere. Building one takes five steps: gather the layers that describe the field, turn them into zones, set a rate per zone, export the file your display reads, and check it before you drive. Here is each step and the decisions that actually change the outcome.

What a variable rate prescription map is

It is a map file carrying a target rate for every part of the field. The machine reads its position, looks up the rate there, and adjusts the applicator on the move. The same idea covers seeding, fertiliser, lime, and crop protection. Only the rate column changes.

The point is not to apply less. It is to put the input where it returns something and take it away from where it does not.

What you need before you start

The one thing you cannot skip is an accurate field boundary. Everything else is a layer that explains why one part of the field behaves differently from another.

Useful layers, roughly in order of how often they carry real signal:

  • Yield history. Several seasons beat one. One season mostly records that year’s weather.
  • Soil sample results. Lab values for pH, phosphorus, potassium and organic matter anchor nutrient decisions to measurements rather than inference.
  • Satellite history. Multi-year vegetation patterns show which parts consistently perform, which is closer to potential than any single image.
  • Topography. Slope and water flow explain a lot of yield variation, especially in wet or drought years.
  • Soil scans. Electrical conductivity maps texture cheaply and at high density.

The honest minimum is a boundary plus one good layer. Two or three that agree with each other is where confidence starts.

Step 1: pick the layers that explain this field

More layers is not automatically better. A layer earns its place when it separates parts of the field that really do behave differently.

The practical test is simple. Put the layer on screen and ask whether the pattern matches something you already know, the wet corner, the sandy ridge, the headland that always lags. If it matches, it is carrying signal. If it looks like noise or like last season’s weather, leave it out.

You can explore your own field data layer by layer in the browser before committing to anything. The post on why combining layers pays covers the reasoning behind picking a set rather than a single map.

Step 2: turn the layers into zones

Zones are the unit the prescription works in. Three to five is the usual answer for a field, and there is a reason it is not twenty.

Every extra zone makes the map look more precise while making each zone smaller and its average less reliable. It also asks the applicator to change rate more often than it physically can. A twenty zone map, applied by a machine that needs seconds to settle at a new rate, is a three zone map with worse edges.

Check the zone map before you go further. Two checks that take a minute:

  • Does the zone pattern line up with what you know about the field on the ground?
  • Do the zones hold up across seasons, or did one unusual year draw them?

If a zone map only makes sense in the year it was built, rebuild it from more history.

Step 3: set a rate for each zone

There are two honest routes, and they suit different situations.

Redistribute a fixed budget. You have decided to spend a set amount of nitrogen across the field. The prescription moves that same total toward the zones that respond and away from the ones that do not. Your spend stays flat and the return changes.

Calculate the rate agronomically. Each zone gets a rate derived from a removal or response equation using its own soil values and yield goal. Your spend changes and follows the agronomy.

A worked example of the first route. Say the field is 100 hectares, the flat plan was 150 kg N per hectare, so the budget is 15,000 kg. Zones come out at 30, 45 and 25 hectares, carrying high, medium and low yield potential. Shift roughly 15 percent off the low zone and put it on the high zone:

  • High potential, 30 ha at 168 kg per ha
  • Medium potential, 45 ha at 150 kg per ha
  • Low potential, 25 ha at 128 kg per ha

That totals 15,000 kg. The same nitrogen, positioned differently.

Keep the steps modest on the first pass. Independent multi-year studies on variable rate nitrogen find the gains come from moderate reallocation rather than dramatic swings, and a conservative first prescription is easier to learn from. Iowa State University Extension publishes practical guidance on nitrogen rate decisions and on-farm trials.

Validate the rates with your agronomist, your crop plan, current soil tests, product labels, and local regulations before anything goes on the field. Zone maths does not override any of those.

Step 4: export the file your machine reads

Two formats cover most of the industry. Shapefile is widely accepted. ISO-XML is the ISOBUS standard and what most modern terminals prefer. Some displays want their own format, which is why platforms keep a list of what each expects. GeoPard writes the common ones, and the formats GeoPard writes shows what goes to which display.

If your data already lives in the John Deere Operations Center, the prescription can travel back there instead of moving on a memory stick.

Two things to get right on export:

  • The rate column. Name it what the display expects and confirm the units are the ones the machine is set to. A map in kg per hectare loaded into a terminal set to pounds per acre will apply confidently and wrongly.
  • The geometry. Zones should be clean polygons without slivers. Very thin shapes make the applicator chase rates it cannot hold.

Step 5: check the map before you drive

Three checks, all quick, all worth it:

  • Rate range. Is the highest rate inside what the machine can apply, and the lowest above its minimum?
  • Edges and exclusions. Do buffer strips, waterways and no-application areas carry a zero rate rather than being undefined?
  • Total product. Multiply rate by area per zone and compare with what you planned to buy. A surprise here means something is wrong upstream.

Common questions

Do I need yield data to build a prescription?

No. Yield history is the most useful single layer, but soil results, multi-year satellite patterns, or a soil scan can each support a workable zone map. Yield data makes the result stronger and the post-season check possible.

How many zones should a field have?

Three to five for most fields. Go higher only when the field genuinely has that many distinct areas and the applicator can keep up with the rate changes.

Which file format should I export?

ISO-XML if your terminal supports it, shapefile as the general fallback, and the display-specific format when the machine asks for one. Check the units and the rate column name every time.

Will this work with my machinery?

If the applicator supports variable rate and the display reads a common prescription format, yes. Older machines that apply a single rate cannot execute a prescription, though the zone map still helps with soil sampling and planning.

Closing the loop

A prescription is a hypothesis about the field, and the season tests it. After harvest, line the yield data up against the rates actually applied and price each step, so the next map is built on evidence rather than assumption.

Ready to try the steps on a real field? Open management zones and prescription maps in GeoPard and start from the layers you already have.

Optimizing Farm Inputs with Multi-Layer Data Fusion: From Raw Layers to ROI

Forget relying on just one data source for your farm decisions. Multi-layer data fusion brings together yield and soil layers, topography analytics, machinery logs, and satellite imagery to create precise management zones. With GeoPard’s precision agriculture software, you can turn this complex data into actionable VRA prescriptions that reduce waste and protect yield. Keep reading to see how this approach drives real ROI on your farm inputs. Learn more here.

Understanding Multi-Layer Data Fusion

Unlocking the potential of your fields begins with understanding how different layers of data can be combined. This multi-layer approach is key to making informed decisions about your farm inputs.

Yield and Soil Layer Integration

The integration of yield and soil data forms the foundation of your precision agriculture strategy. By examining yield maps alongside soil attributes, you can identify patterns in crop performance. This can reveal areas where soil quality impacts yield. You might find, for example, that sections with lower soil pH correlate with reduced yields. By addressing these soil issues, you improve the overall health of your crops. This integration helps you target specific areas for soil amendments, saving time and resources.

Topography and Satellite Imagery

Understanding the lay of the land is vital. Topographic data helps you understand elevation and slope, which affect water flow and erosion. Combine this with satellite imagery, like NDVI and NDRE, and you get a clearer picture of the crop health across your fields. Satellite imagery lets you monitor vegetation vigor and identify stress areas. This combination supports targeted interventions, so you apply solutions exactly where needed, improving efficiency and outcomes.

Machinery and Historical Data

Your machinery logs can provide valuable historical data. This includes information on past planting, fertilizing, and harvesting activities. By analyzing this data, you can identify trends and optimize machinery use. Historical satellite imagery can also offer insights into long-term field changes. This helps in planning future activities by understanding how your fields have evolved over time. It’s about putting past insights to work for future success.

Creating Effective Management Zones

Once your data layers are integrated, the next step is creating management zones. This allows for targeted interventions across your fields, tailored to the needs of each zone.

Zone Management Strategies

Effective zone management requires strategic planning. Begin by analyzing your integrated data to delineate zones based on similar attributes. This could involve grouping areas with similar soil moisture or yield patterns. By managing these zones individually, you can tailor inputs like water, seed, and nutrients precisely. This strategy not only boosts productivity but also minimizes waste.

Variable Rate Application Prescriptions

Variable Rate Application (VRA) is a game-changer in precision agriculture. With well-defined management zones, you can create VRA prescriptions that adjust the application rates of fertilizers and pesticides. This precision ensures that each area of your field receives exactly what it needs. Implementing VRA can lead to significant cost savings and environmental benefits. It’s about smarter, not just more, farming.

Tools for Geospatial Agronomy Analytics

To support these strategies, leveraging geospatial agronomy tools is essential. These tools help process and visualize data, making it easier to create and manage zones. GeoPard offers comprehensive solutions, turning complex data into actionable insights. By using these tools, you streamline decision-making processes, leading to better farm management and outcomes.

Measuring ROI with Precision Agriculture

Precision agriculture isn’t just about data; it’s about translating that data into measurable returns. Understanding your ROI is crucial for assessing the success of your strategies.

Post-Season ROI Analysis

After a growing season, it’s important to evaluate your efforts. Post-season analysis helps you understand what worked and what didn’t. By comparing initial investments with yield gains, you can calculate the ROI of your precision agriculture practices. This analysis provides insights into which strategies delivered the best returns, guiding future decisions.

Benefits of John Deere Operations Center

Integrating your data with platforms like John Deere Operations Center enhances your ability to measure and improve ROI. This platform provides tools for monitoring and adjusting operations based on data insights. By syncing your precision agriculture data, you can track performance, plan equipment usage, and make informed decisions. It’s about harnessing technology to boost efficiency and profitability.

AI-Powered Agronomic Decision Support

Using AI in agronomic decision-making is a powerful way to refine your precision agriculture strategies. AI tools analyze data patterns to suggest optimal actions. This support helps you make informed choices about inputs, timing, and management interventions. AI doesn’t replace your expertise but amplifies it, ensuring you leverage every piece of data to its fullest potential.

Frequently Asked Questions

What is multi-layer data fusion in agriculture?
Multi-layer data fusion combines various data sets, such as yield, soil, topography, and satellite imagery, to create a comprehensive view of your fields. This integration allows for more precise management and decision-making.

How do management zones improve farming efficiency?
Management zones let you tailor inputs like water and nutrients to specific areas based on their unique needs. This targeted approach reduces waste and increases crop productivity and health.

What is Variable Rate Application (VRA)?
VRA adjusts the application rates of farming inputs according to the specific requirements of different zones within a field. This precision reduces input costs and enhances yield and environmental sustainability.

Why is post-season ROI analysis important?
Post-season ROI analysis helps you assess the effectiveness of your farming strategies by comparing initial investments with resulting yield gains. This evaluation guides future planning and optimizes resource use.

How does AI support agronomic decisions?
AI analyzes complex data patterns to recommend optimal farming actions, assisting in precise input management and timing. This technological support enhances your decision-making capabilities, ensuring maximum productivity.

Join the forefront of agricultural tech with GeoPard’s integrated platform.

How Large Operations Streamline Data Flow with GeoPard’s Advanced Software

Most large farming operations drown in disconnected data—from yield to soil, machinery to satellite imagery. That slows decisions and wastes resources you can’t afford to lose. GeoPard’s precision agriculture software brings all your critical data into one platform, speeding up workflows and sharpening your ROI analysis. Read on to learn how you can unify field data, automate prescriptions, and connect seamlessly with GeoPard.

Streamlining Farm Data Integration

Bringing together farm data is crucial for smooth operations. Let’s explore how to master this with GeoPard.

Unifying Yield and Soil Data

When you merge yield and soil data, you gain a clear view of your field’s potential. Imagine combining this information to understand how nutrients affect your harvest. With GeoPard, you don’t have to imagine. The software integrates these data types seamlessly. You’ll spend less time hunting for information and more time using it to boost your crops.

GeoPard’s interface is intuitive. You can quickly see how soil quality impacts yield. Use these insights to adjust your farming techniques. This integration helps optimize resources, ensuring nothing goes to waste. By having all your data in one place, you’re empowered to make informed decisions.

Leveraging Topography and Satellite Imagery

Using topography and satellite images, you gain an aerial perspective on your fields. These tools reveal patterns you might miss on the ground. GeoPard lets you layer these images with other data for a comprehensive field overview.

This aerial data is vital for spotting areas needing attention. Perhaps a section of your field retains water. With this insight, you can plan drainage solutions. Satellite imagery updates frequently, giving you real-time data. GeoPard makes it easy to use this information effectively.

Machinery Logs and Data Sync

Machinery logs provide critical insights into field operations. With GeoPard, syncing these logs with other data is effortless. This synchronization ensures you have a complete picture of your farm’s activities.

Access to machinery data helps identify inefficiencies. You can see where fuel is wasted or where equipment needs maintenance. These insights lead to cost savings. With GeoPard’s platform, you manage your entire operation from one dashboard. This holistic view promotes smarter decisions and streamlined processes.

Precision Agriculture Software in Action

Now, let’s see how precision agriculture software can transform your farming practices.

Creating Management Zones

Management zones are key to precision farming. They divide your field into sections based on data patterns. GeoPard makes creating these zones straightforward. With precise zones, you apply the right resources in the right places.

Each zone is unique. Some may need more water, while others require different fertilizers. By targeting these needs, you prevent waste and boost productivity. GeoPard’s tools enable you to tailor your approach to each zone. This specificity leads to healthier crops and better harvests.

Generating VRA Prescriptions

Variable Rate Application (VRA) is a game-changer. It adjusts inputs like seeds and fertilizers according to field needs. GeoPard’s software generates VRA prescriptions that are easy to follow.

With VRA, you reduce input costs significantly. The software analyzes data to create precise application maps. You use just the right amount of resources, leading to savings and better yields. Implementing VRA prescriptions optimizes your farming strategy, making every action count.

Automating Crop Monitoring

Automation in crop monitoring saves time and effort. GeoPard’s software takes the guesswork out of tracking crop health. Automated alerts keep you informed about changes in your fields.

Regular monitoring helps catch issues early. If pests invade a section, you’ll know immediately. GeoPard’s system provides timely data, allowing swift action to protect your crops. Automation ensures you stay ahead without constant manual checks, giving you peace of mind.

Maximizing Farm ROI with GeoPard

GeoPard is not just about data integration; it’s about increasing your return on investment.

Analyzing Yield Data Effectively

Analyzing yield data is crucial for understanding performance. GeoPard gives you the tools to interpret this data accurately. You can pinpoint what works and what needs improving.

With detailed yield analysis, you make informed decisions. GeoPard helps you see trends over time, guiding future strategies. This knowledge enables you to invest in techniques that improve yields and profits.

Mapping Soil Zones and Topography

Mapping soil zones with topography enhances your understanding of field dynamics. GeoPard’s mapping tools are precise and user-friendly. They help you visualize how soil types and elevation affect your crops.

These maps guide resource allocation. You know where to focus efforts for the best results. Understanding soil and topography interactions leads to more effective farming practices. With GeoPard, this mapping is straightforward, providing a clear path to improved productivity.

Prescription Maps and ROI Analysis

Prescription maps are vital for applying the right resources. GeoPard’s software creates these maps based on comprehensive data. This precision ensures optimal input use, maximizing your ROI.

ROI analysis with GeoPard shows where your investments pay off. You see which practices yield the best returns, guiding future decisions. This analysis is crucial for sustainable growth. By focusing on ROI, you ensure your resources are used wisely, securing your farm’s profitability.

GeoPard is your partner in optimizing farm operations. With integrated data and precise analytics, you’re equipped to make informed decisions every step of the way.

Explore automation and API solutions designed for scalable precision ag success.

Plan, Apply, Analyze: GeoPard Use Cases for VRA and Post Season ROI

Plan, Apply, Analyze: GeoPard Use Cases for VRA and Post Season ROI

Most precision agriculture tools stop short when it comes to linking pre-season planning with post-season results. You need a platform that ties your management zones and VRA maps directly to yield and ROI analysis. GeoPard Agriculture does exactly that—combining soil, satellite, and machinery data so you can plan smarter, apply precisely, and measure returns with confidence. Let’s explore workflows that put your data to work all season long. For more insights, visit our field potential and yield data analysis page.

GeoPard for Agronomic Planning

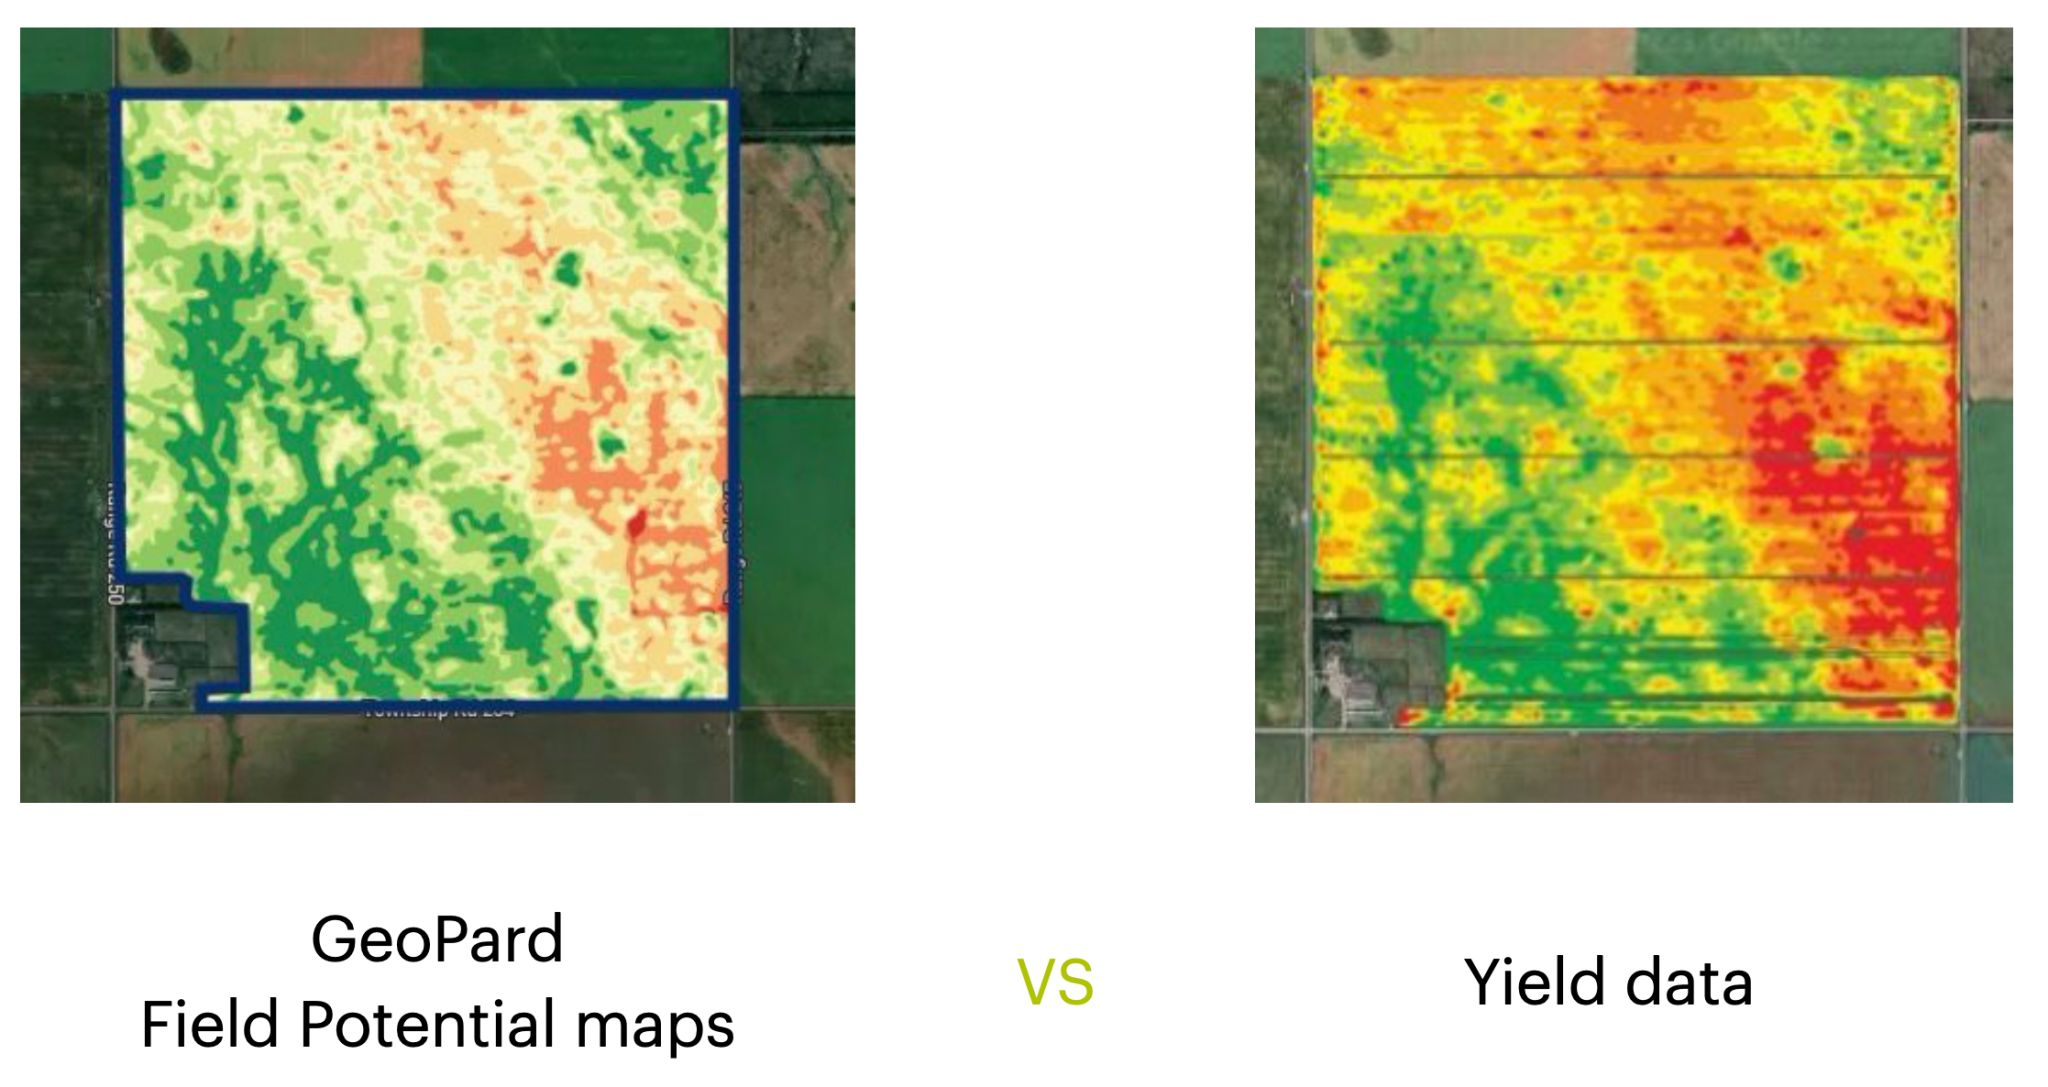
GeoPard Field Potential maps vs Yield data

GeoPard Field Potential is your start into Precision Agriculture

Stepping into the world of agronomic planning, GeoPard offers more than just data. It turns your field insights into actionable strategies.

Crafting Management Zones

Creating management zones is crucial. With GeoPard, you can use varied data layers to draw precise zones. This means you can focus your resources exactly where they’re needed. For example, using soil type and crop health data, you’ll know precisely where to increase or reduce inputs. This way, not only do you save costs, but you also boost productivity.

Imagine a farmer using satellite and soil data to craft zones. They notice a patch needing more nutrients. With GeoPard, they adjust their plan, apply the right amount, and watch the crops thrive. This precise application is how you turn data into yield. Want to learn more about creating management zones? Check out our detailed guide.

Precision Agriculture Software Tools

GeoPard’s tools offer more than just data aggregation. They provide a comprehensive look at your farm’s health. From satellite images to soil tests, you have everything at your fingertips. These tools help you plan efficiently, ensuring every seed, drop of water, and ounce of fertilizer is used wisely.

Consider the impact: A user can reduce input wastage by up to 30%. That’s real savings and real impact on your bottom line. Plus, you’re helping the environment by minimizing runoff and over-application. Ready for the next step? Explore how these tools can revolutionize your farm management in our software tools overview.

In-Season Monitoring with GeoPard

Once your plan is in place, in-season monitoring helps ensure everything stays on track. GeoPard offers intuitive tools for real-time insights.

Leveraging NDVI Satellite Imagery

NDVI satellite imagery is a game-changer. By assessing vegetation health, you can spot issues before they become costly problems. Picture this: you notice a field section with declining NDVI values. With GeoPard, you identify a pest issue and address it promptly, saving your crop.

These images update every few days, providing fresh insights into your fields. This frequency means you’re never in the dark about what’s happening on your farm. By staying informed, you make timely decisions that can save you money and maximize yield. For more on NDVI, dive into our satellite monitoring tutorials.

Crop Monitoring with Yield Data

Monitoring doesn’t stop with satellites. Yield data offers another layer of insight. Use it to track performance and make adjustments. Imagine discovering a particular seed variety outperforms others. You can pivot your strategy to focus on what works best.

With GeoPard, you can compare yields year-on-year, identifying long-term trends and making informed decisions. This level of detail is what sets successful farms apart. Curious about maximizing yield data? Visit our analytics tutorials.

Post-Season ROI Analysis

Finally, post-season analysis ties everything together. It’s where strategy meets results, and GeoPard excels in delivering clear insights.

Examining Variable Rate Applications

Evaluating your variable rate applications (VRA) helps you understand what worked and what didn’t. GeoPard provides detailed maps and reports to review application efficiency. Did varying fertilizer rates impact yield as expected? You’ll have the data to know for sure.

This analysis is not just about learning; it’s about growing better next season. By understanding the impact of your VRA decisions, you enhance future outcomes. To see how others have benefited, check out this VRA use case.

Integrating John Deere Operations Center

GeoPard’s integration with the John Deere Operations Center offers seamless data flow. This integration means you can access all your farm data in one place, simplifying management tasks. Picture managing your operations with ease, thanks to synchronized data.

The integration supports data-driven decisions, improving efficiency and boosting your ROI. With everything connected, you’re better equipped to handle challenges and seize opportunities. Learn more about this powerful integration in our John Deere Operations Center overview.

By leveraging GeoPard’s comprehensive suite of tools, you transform your approach to farming. From planning to post-season analysis, each stage is enhanced, ensuring you get the most from your fields. Don’t wait to maximize your farm’s potential—start using GeoPard today!

Learn how precise data can reveal your farm’s hidden challenges.

wpChatIcon
wpChatIcon

    Request Free GeoPard Demo / Consultation


    By clicking the button you agree our Privacy Policy. We need it to reply to your request.

      Subscribe


      By clicking the button you agree our Privacy Policy

        Send us information


        By clicking the button you agree our Privacy Policy