
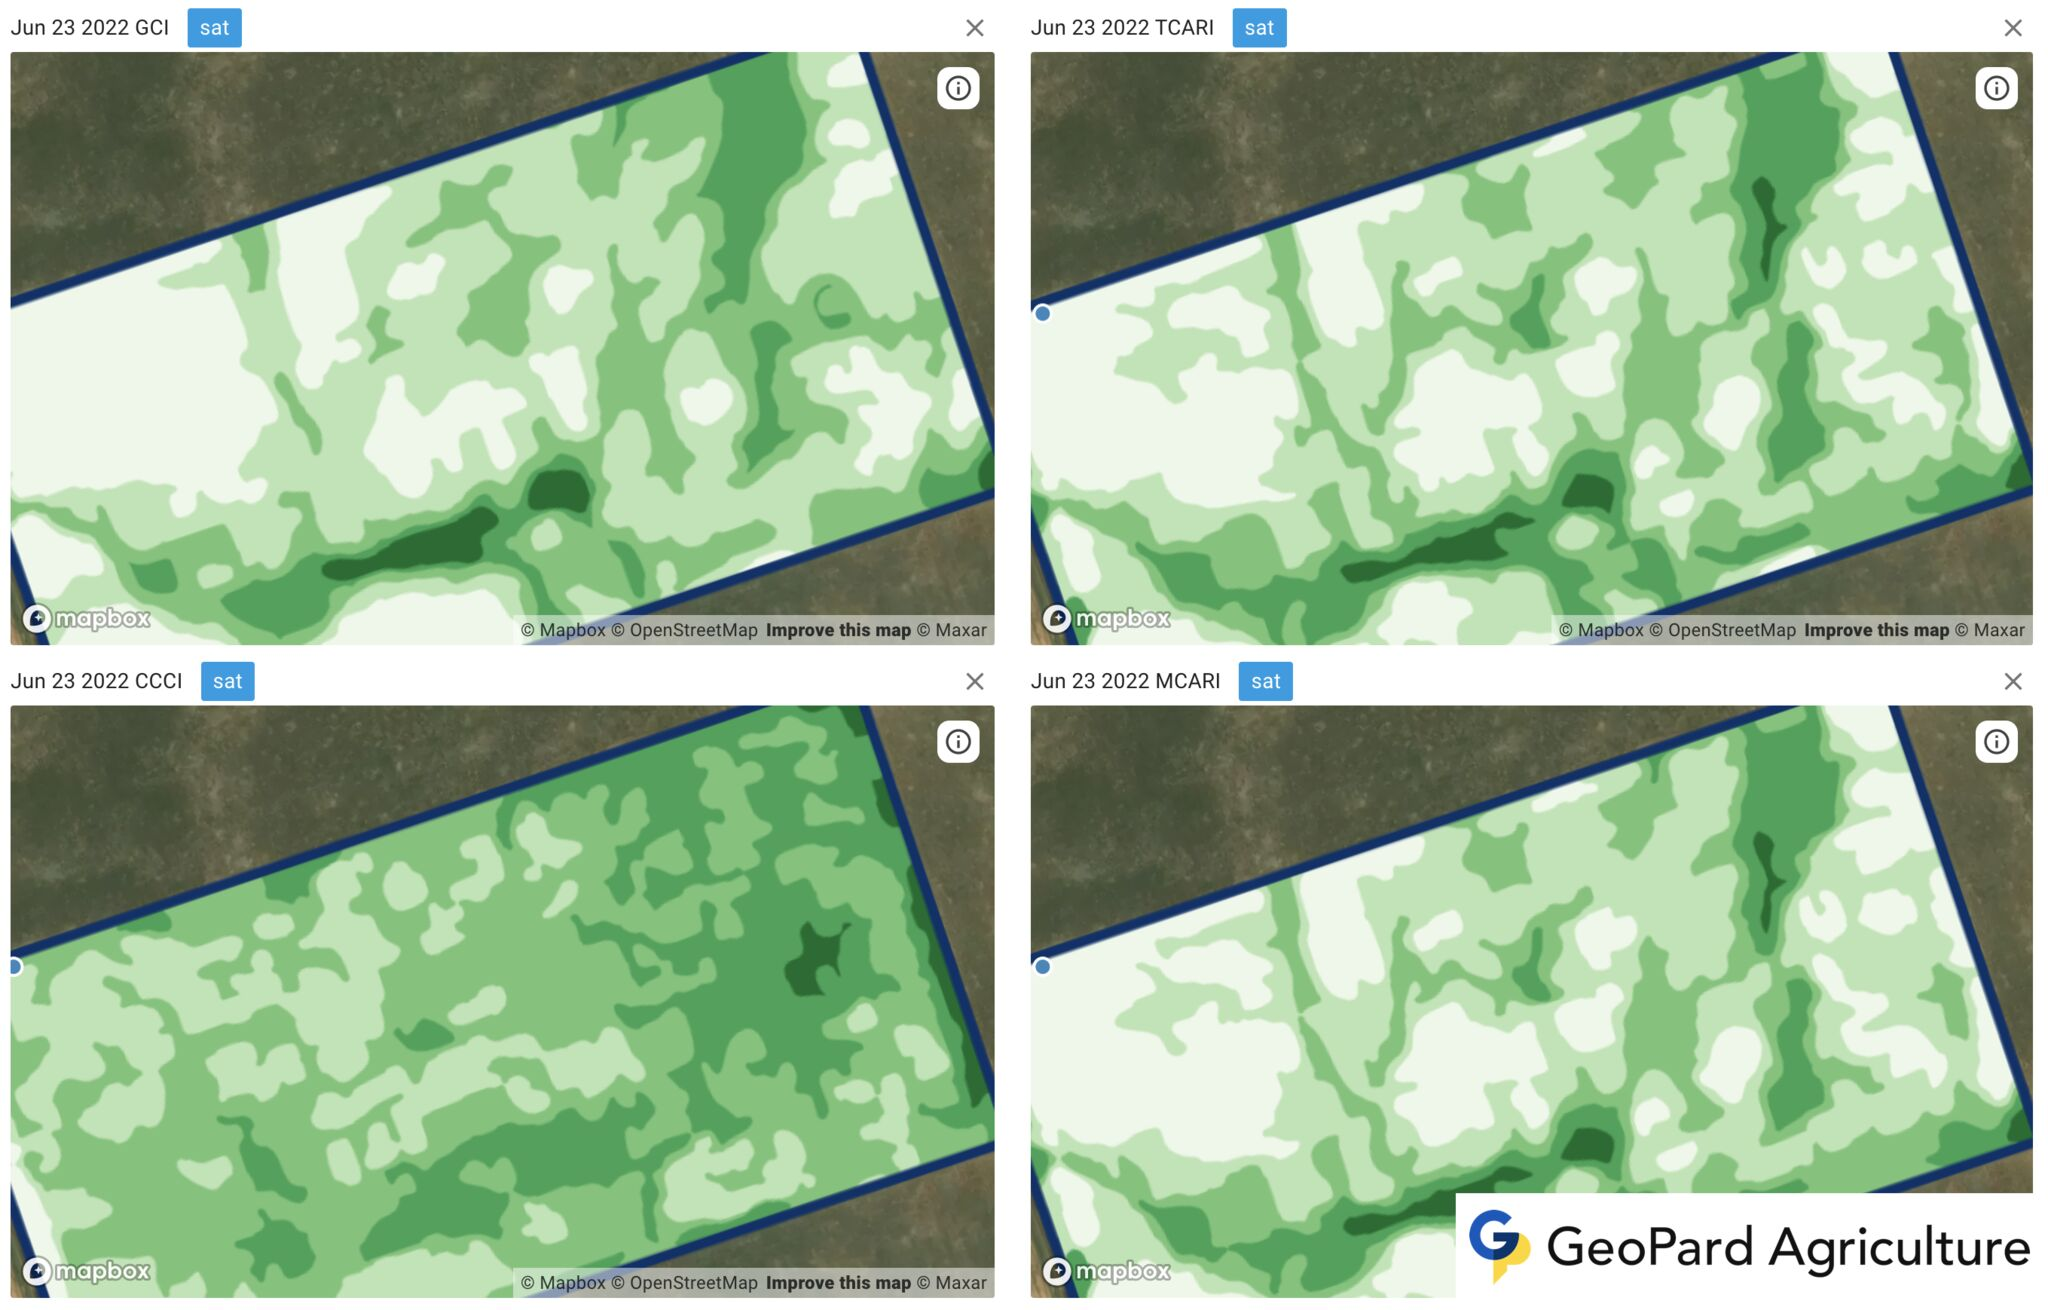
GeoPard extends the family of supported chlorophyll-linked vegetation indices with
- Canopy Chlorophyll Content Index (CCCI)
- Modified Chlorophyll Absorption Ratio Index (MCARI)
- Transformed Chlorophyll Absorption in Reflectance Index (TCARI)
- ratio MCARI/OSAVI
- ratio TCARI/OSAVI
They help to understand the current crop development stage including
- identification of the areas with nutrient demand,
- estimation of the nitrogen removal,
- potential yield evaluation,
And the insights are used for precise Nitrogen Variable Rate Application maps creation.
Read More: Which index is the best to use in the precisionAg
Read More: GeoPard vegetation indices
 Canopy Chlorophyll Content Index (CCCI) vs Modified Chlorophyll Absorption Ratio Index (MCARI) vs Transformed Chlorophyll Absorption in Reflectance Index (TCARI) vs Ratio MCARI/OSAVI
What is Vegetation Indices?
Vegetation indices are numerical values derived from remotely sensed spectral data, such as satellite or aerial imagery, to quantify the density, health, and distribution of plant life on the Earth’s surface.
They are commonly used in remote sensing, agriculture, environmental monitoring, and land management applications to assess and monitor vegetation growth, productivity, and health.
These indices are calculated using the reflectance values of different wavelengths of light, particularly in the red, near-infrared (NIR), and sometimes other bands.
The reflectance properties of vegetation vary with different wavelengths of light, allowing for the differentiation between vegetation and other land cover types.
Vegetation typically has strong absorption in the red region and high reflectance in the NIR region due to chlorophyll and cell structure characteristics.
Some widely used vegetation indices include:
- Normalized Difference Vegetation Index (NDVI): It is the most popular and widely used vegetation index, calculated as (NIR – Red) / (NIR + Red). NDVI values range from -1 to 1, with higher values indicating healthier and denser vegetation.
- Enhanced Vegetation Index (EVI): This index improves upon NDVI by reducing atmospheric and soil noise, as well as correcting for canopy background signals. It uses additional bands, such as blue, and incorporates coefficients to minimize these effects.
- Soil-Adjusted Vegetation Index (SAVI): SAVI is designed to minimize the influence of soil brightness on the vegetation index. It introduces a soil brightness correction factor, enabling more accurate vegetation assessments in areas with sparse or low vegetation cover.
- Green-Red Vegetation Index (GRVI): GRVI is another simple ratio index that uses the green and red bands to assess vegetation health. It is calculated as (Green – Red) / (Green + Red).
These indices, among others, are used by researchers, land managers, and policymakers to make informed decisions regarding land use, agriculture, forestry, natural resource management, and environmental monitoring.


 NDMI calculated on top of Planet / Sentinel-2 / Landsat image
 The equation creates a single number that is representative and integrates the information that is accessible in the red and NIR (near-infrared) bands.
To do this, it takes the reflectance throughout the red spectral band and subtracts it from the reflectance throughout the NIR band. After that, the result is divided by the total reflectance of the NIR and red wavelengths.
The assessment of the NDVI will never be more than a positive one and less than a negative one. In addition, a number between -1 and 0 denotes a plant that has died and inorganic items like stones, roads, and buildings.
Simultaneously, its values for living plants may vary anywhere from 0 to 1, with 1 representing the healthiest plant and 0 representing the unhealthiest plant. It is possible to assign a single value to each pixel in a picture, whether that pixel represents a single leaf or a wheat field that spans 500 acres.
The equation creates a single number that is representative and integrates the information that is accessible in the red and NIR (near-infrared) bands.
To do this, it takes the reflectance throughout the red spectral band and subtracts it from the reflectance throughout the NIR band. After that, the result is divided by the total reflectance of the NIR and red wavelengths.
The assessment of the NDVI will never be more than a positive one and less than a negative one. In addition, a number between -1 and 0 denotes a plant that has died and inorganic items like stones, roads, and buildings.
Simultaneously, its values for living plants may vary anywhere from 0 to 1, with 1 representing the healthiest plant and 0 representing the unhealthiest plant. It is possible to assign a single value to each pixel in a picture, whether that pixel represents a single leaf or a wheat field that spans 500 acres.
 To begin, it is a mathematical computation performed pixel-by-pixel on an image utilizing tools from a GIS (Geographic Information System). Calculated by contrasting the amounts of red and near-infrared light absorbed and reflected by the plant, it measures the plant’s overall state of health.
The Normalized Difference Vegetation Index may be used to study land all over the globe, making it ideal for focused field studies and national or global vegetation monitoring.
By means of utilizing NDVI, we can get an immediate analysis of fields, enabling agriculturalists to optimize the production potential of areas, limit their influence on the environment, and modify their precision agricultural operations.
Moreover, examining it in conjunction with other data streams, such as those about the weather, might provide further insight into recurring patterns of droughts, freezes, or floods and how they impact vegetation.
To begin, it is a mathematical computation performed pixel-by-pixel on an image utilizing tools from a GIS (Geographic Information System). Calculated by contrasting the amounts of red and near-infrared light absorbed and reflected by the plant, it measures the plant’s overall state of health.
The Normalized Difference Vegetation Index may be used to study land all over the globe, making it ideal for focused field studies and national or global vegetation monitoring.
By means of utilizing NDVI, we can get an immediate analysis of fields, enabling agriculturalists to optimize the production potential of areas, limit their influence on the environment, and modify their precision agricultural operations.
Moreover, examining it in conjunction with other data streams, such as those about the weather, might provide further insight into recurring patterns of droughts, freezes, or floods and how they impact vegetation.


 English
  German
  Ukrainian
  French
  Kazakh
  Portuguese
  Spanish
  Arabic
  Swedish
  Serbian
  Romanian
  Norwegian
  Finnish
  Lithuanian
  Estonian
  Latvian
  Croatian
  Slovenian
  Slovak
  Japanese
  Polish