Automated Field Boundaries Detection Model for Precision Agriculture by GeoPard

GeoPard have completed a successful development of an automated field boundaries detection model using mutli-year satellite imagery, accurate cloud and shadow detection, and advanced proprietary algorithms, including deep neural networks.

The GeoPard field detection model has achieved a state-of-the-art accuracy of 0.975 on the Intersection over Union (IoU) metric, validated across diverse regions and crop types globally.

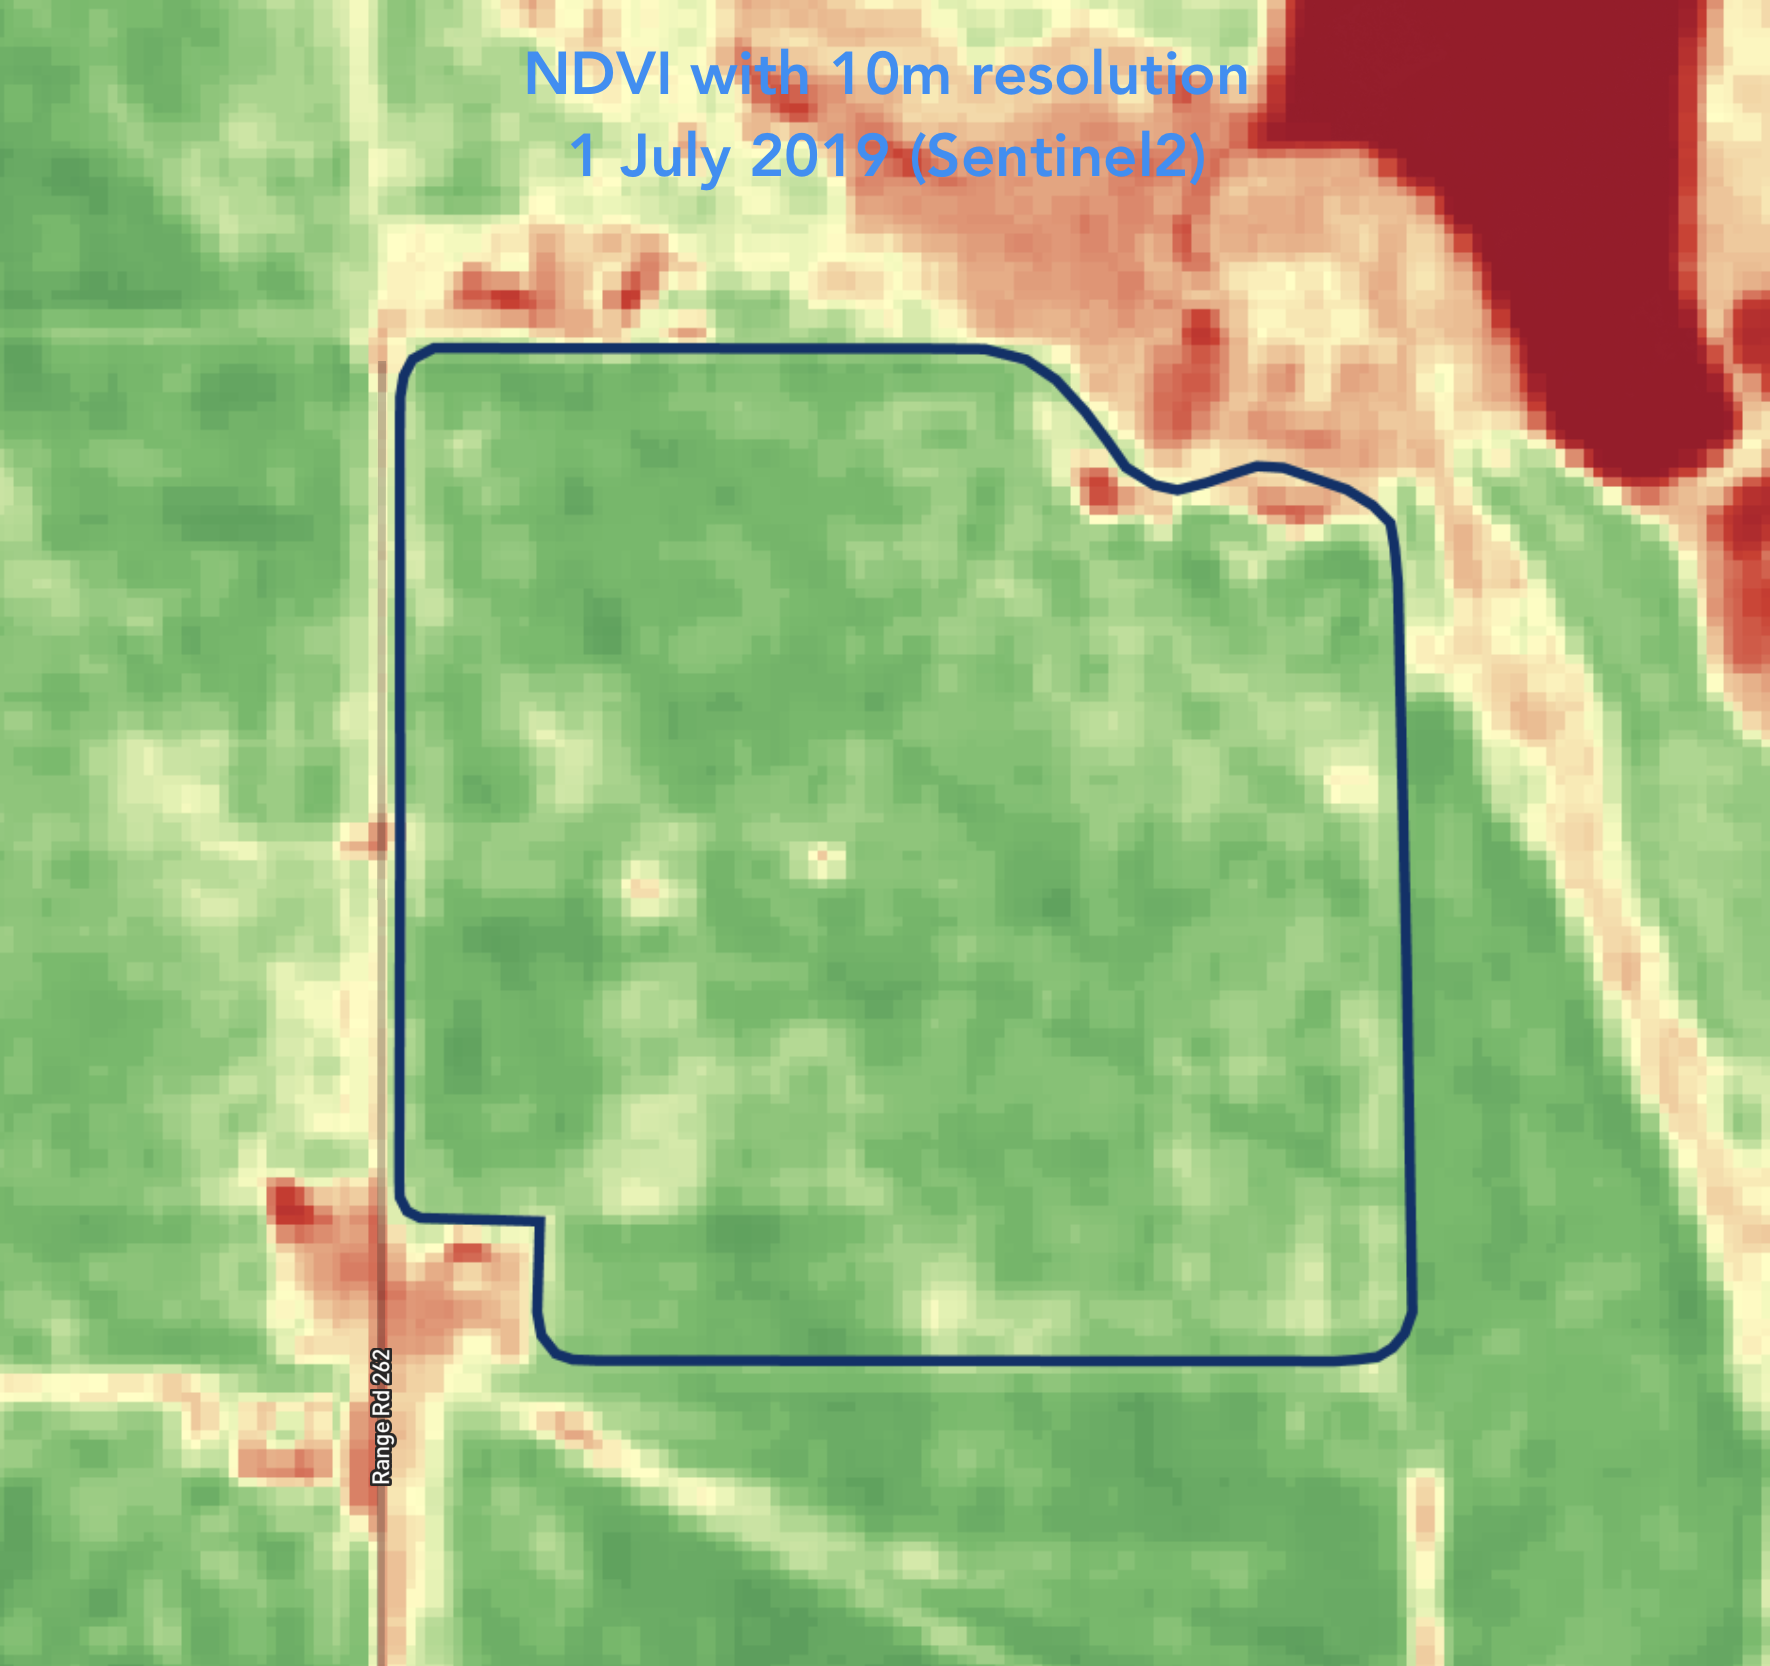
Check out these images to see the results in Germany (average field size is 7 hectares):

1 - Raw Sentinel-2 image

1 – Raw Sentinel-2 image

3 - Segmented field boundaries

2 – Super-resolution Sentinel-2 image by GeoPard (1 meter resolution)

2 - Super-resolution Sentinel-2 image by GeoPard

3 – Segmented field boundaries, 0.975 Intersection over union (IoU) accuracy metric, across multiple international regions and crop types.


Integration into our API and GeoPard application is coming soon. This automated and cost-effective method helps predict yields, benefits governmental organizations, and assists large landowners who often need to update field boundaries between seasons.

GeoPard’s approach utilizes multi-year crop vegetation trends using multi-factor analysis and crop rotation.


The model is accessible via the GeoPard API on a pay-as-you-go basis, offering flexibility without the need for costly subscriptions.


What is Field Boundaries Delineation?

Field boundaries delineation refers to the process of identifying and mapping the boundary of agricultural fields or parcels of land. It involves using various techniques and data sources to demarcate the limits of individual fields or agricultural plots.

Traditionally, field boundaries were delineated manually by farmers or landowners based on their knowledge and observations.

However, with advancements in technology, particularly in remote sensing and geographic information systems (GIS), automated and semi-automated methods have become increasingly prevalent.

One common approach is the analysis of satellite or aerial imagery. High-resolution images captured by satellites or aircraft can provide detailed information about the landscape, including the boundaries between different land parcels.

Image processing algorithms can be applied to these images to detect distinct features such as changes in vegetation type, color, texture, or patterns that indicate the presence of field boundaries.

Another technique involves using LiDAR (Light Detection and Ranging) data, which uses laser beams to measure the distance between the sensor and the Earth’s surface.

LiDAR data can provide detailed elevation and topographic information, allowing for the identification of subtle variations in terrain that may correspond to field boundaries.

Additionally, geographic information systems (GIS) play a crucial role in delineation of field boundaries.

GIS software allows for the integration and analysis of various data layers, including satellite imagery, topographic maps, land ownership records, and other relevant information. By combining these data sources, GIS can aid in the interpretation and identification of field boundaries.

The accurate delineation of field is essential for several reasons. It facilitates better management of agricultural resources, enables precision farming techniques, and supports the planning and implementation of agricultural practices such as irrigation, fertilization, and pest control.

Accurate field boundary data also assists in land administration, land-use planning, and compliance with agricultural regulations.

How it is useful?

It plays a crucial role in agriculture and land management, providing several benefits and importance supported by evidence and global figures. Here are some key points:

1. Precision Agriculture: Accurate field boundaries help in implementing precision agriculture techniques, where resources such as water, fertilizers, and pesticides are precisely targeted to specific areas within fields.

According to a report by the World Bank, precision agriculture technologies have the potential to increase crop yields by 20% and reduce input costs by 10-20%.

2. Efficient Resource Management: It enables farmers to better manage resources by optimizing irrigation systems, adjusting fertilization practices, and monitoring crop health. This precision reduces resource wastage and environmental impact.

The Food and Agriculture Organization (FAO) estimates that precision agriculture practices can reduce water usage by 20-50%, decrease fertilizer consumption by 10-20%, and reduce pesticide usage by 20-30%.

3. Land Use Planning: Accurate field boundary data is essential for land use planning, ensuring efficient utilization of available agricultural land. It allows policymakers and land managers to make informed decisions regarding land allocation, crop rotation, and zoning.

This can lead to increased agricultural productivity and improved food security. A study published in the Journal of Soil and Water Conservation found that effective land use planning could increase global food production by 20-67%.

4. Farm Subsidies and Insurance: Many countries provide agricultural subsidies and insurance programs based on field boundaries. Accurate delineation helps in determining eligible land areas, ensuring fair distribution of subsidies, and calculating insurance premiums accurately.

For instance, the European Union’s Common Agricultural Policy (CAP) relies on accurate field boundaries for subsidy calculations and compliance monitoring.

5. Land Administration and Legal Boundaries: Field boundaries delineation in agriculture is crucial for land administration, property rights, and resolving land disputes. Accurate maps of field boundaries help establish legal ownership, support land registration systems, and facilitate transparent land transactions.

The World Bank estimates that only 30% of the world’s population has legally documented rights to their land, highlighting the importance of reliable field boundary data for secure land tenure.

6. Compliance and Environmental Sustainability: Accurate field boundaries aid in compliance monitoring, ensuring adherence to environmental regulations and sustainable farming practices.

It helps identify buffer zones, protected areas, and areas prone to erosion or water contamination, enabling farmers to take appropriate measures. Compliance with environmental standards enhances sustainability and reduces negative impacts on ecosystems.

According to the FAO, sustainable farming practices can mitigate up to 6 billion tons of greenhouse gas emissions annually.

These points illustrate its usefulness and importance in agriculture and land management. The evidence and global figures presented support the positive impacts it can have on resource efficiency, land use planning, legal frameworks, environmental sustainability, and overall agricultural productivity.

In summary, field boundaries delineation in agriculture is the process of identifying and mapping the boundary of agricultural fields or parcels of land. It relies on various techniques such as satellite imagery analysis, LiDAR data, and GIS to accurately define and demarcate these boundaries, enabling effective land management and agricultural practices.

Planet Imagery (daily, 3m resolution) for Management Zones Creation

Access to Planet imagery became simpler, faster, and more affordable with GeoPard Agriculture. Since August 2022 GeoPard has released the capabilities to search and analyze only requested Planet images from the user’s preferred date range.

So a GeoPard user requests only preferred Planet images and can use them in GeoPard analytical toolbox.

Planet images extend Sentinel and Landsat coverages (provided by default) and can be mixed with other data layers (harvesting/spraying/seeding machinery datasets, topography profile) via existing Multi-Layer, Multi-Year, and Equation tools


Planet Imagery for Management Zones Creation


Planet is the largest earth observation satellite network delivering a near-daily global dataset and enables its high-resolution and high-frequency satellite imagery data.

Management Zones Based on Planet Scope (3.5m resolution) imagery.

Read more about GeoPard / Planet Partnership.

What is Planet Imagery And Its Use for Management Zones Creation?

It refers to the satellite imagery provided by Planet Labs, a private company that operates a fleet of small satellites called Doves. These satellites capture high-resolution images of Earth’s surface on a daily basis. The term “3m resolution” means that each pixel in the image represents a 3×3 meter area on the ground. This level of detail allows for detailed analysis and monitoring of various features and changes on the Earth’s surface.

When it comes to management zones creation, Planet Imagery with daily 3m resolution can be highly beneficial for various industries and applications, such as:

  • Agriculture: High-resolution imagery can help in creating management zones in agriculture, where different areas of a field may require different treatments, like irrigation, fertilization, or pest control. By analyzing the imagery, farmers can identify patterns related to crop health, soil moisture, and other factors, enabling them to make better decisions about resource allocation.
  • Environmental management: Satellite imagery can be used to identify and monitor environmentally sensitive areas, such as wetlands, forests, and wildlife habitats. This information can be used to create management zones that protect these areas and ensure sustainable land use practices.
  • Urban planning: High-resolution imagery can help urban planners identify areas of growth, land use patterns, and infrastructure development. This information can be used to create management zones that guide future development and ensure efficient use of resources.
  • Disaster management: Satellite imagery can help in identifying and monitoring disaster-prone areas, such as floodplains or wildfire hotspots. Management zones can be created to establish evacuation routes, allocate resources for disaster response, and inform land use policies that minimize the risk of future disasters.
  • Natural resource management: High-resolution imagery can help in monitoring and managing resources like water, minerals, and forests. By identifying areas of high resource value or scarcity, management zones can be created to ensure the sustainable use and conservation of these resources.

In summary, Planet Imagery with daily 3m resolution is a valuable tool for creating management zones in various fields, providing up-to-date and detailed information that can help decision-makers optimize resource allocation and ensure sustainable land use practices.


Frequently Asked Questions


1. What can the use of imagery help establish?

The use of imagery can help establish a more efficient and effective farming system. By utilizing technologies like drones or satellite imaging, imagery can provide valuable insights into crop health, soil conditions, and irrigation needs.

It aids in identifying areas of concern, such as pest infestations or nutrient deficiencies, allowing farmers to take targeted actions. Furthermore, imagery helps in monitoring crop growth and development, enabling precise decision-making and maximizing yields. 

How satellite imagery helps in crop monitoring

Satellite imagery is one of the most versatile functions that can be implemented in agricultural production in order to improve the decision-making process. Making decisions, based on a large quantity of data, can help the farmers, agronomists, or advisors to comprehend the situation and the processes that are occurring in the agricultural fields that are subject to monitoring.

What is satellite imaging?

Satellite imaging, also known as satellite remote sensing, is the process of using satellite imagery to gather information about the Earth’s surface, atmosphere, and oceans. This technology involves the use of satellites equipped with specialized sensors and cameras that can capture high-resolution images of the Earth from space.

The images captured by the satellites can be used for a variety of applications, including monitoring weather patterns, tracking changes in the environment, mapping land use and vegetation, and assessing the impact of natural disasters. They can also be used for military and intelligence purposes.

Satellite imaging with its benefits can present situations that can not be seen with regular observation. Regular observations can be very demanding in the sense of the quantity of implemented workforce, finance, and time.

Even with regular observations made during the growth period of the crops, there are several things that can not be seen with the naked eye, such as the early progression of disease and damage induced by the pests that ultimately result in chlorophyll degradation on a cell level.

With the integration and calculation of spectral bands invisible to the human eye, the growers and the advisors can easily visualize chlorophyll degradation before the visible disease or pest damage symptoms on the plants.

Multispectral Satellite Imagery

These advantages in crop monitoring are beneficial with nowadays technologies, allowing implementation of such information to be integrated into geographic information systems, resulting in creating a prompt and quality set of data ready to be utilized in the decision-making processes regarding agricultural production systems.

Besides making information-based decisions, satellite imagery can be used for reporting, record-keeping, and integrating with different sets of data (disease and pest models, yield maps, pest monitoring, fertilization maps and etc,) in order to create an even more functional system of crop monitoring and the way how the farmer or other professionals see the progress of the crops during their growing period.

How are satellite imagery used in farming?

The images can be used to model and calculate spectral indices which later are equated to be used for visualization in the form of color synthesis, either in the visible part of the spectrum or by including other wavelengths. Properly selected color synthesis can reveal crop growth, stress or soil erosion displayed with different colors.

Spectral indices are combinations of spectral reflection of two or more wavelengths to show features of interest. Crop indices are most commonly used in agriculture, but the indices are used for the identification of burned areas, other artificial characteristics, water, and other geological features.

Hyperspectral Satellite Imagery

Useful spectral indices in crop production include:

  • NDVI (Normalized Difference Vegetation Index).
  • EVI (Enhanced Vegetation Index).
  • RENDVI or NDRE (Red Edge Normalized Difference Vegetation Index).
  • GNDVI (The Green Normalized Difference Vegetation Index).
  • MSI or NDWI (Moisture Stress Index).
  • LAI (Leaf Area Index).

NDVI is one of the most used indices and is frequently used to review the initial state of a crop. Other indexes work with certain characteristics, so the results are specific to related to specific agricultural sites, it is important to work with the history of land vegetation.

NDVI (Normalized Difference Vegetation Index)

This index is a measure of green vegetation and is generally the most widely used index. The leaves reflect infrared light (NIR) and use only visible light for photosynthesis. This means that a healthy plant with a good photosynthesis rate can be analyzed by comparing NIR with visible red light.

Unhealthy vegetation will reflect more visible light and lower NIR. Healthy vegetation will reduce some of the visible light that falls on it. However, NDVI is sensitive to the effects of soil (light and color), cloud cover, and shade. Also, the NDVI values can be incorrect in a situation with dense vegetation.

EVI (Enhanced Vegetation Index)

This index is the standard for the moderate resolution spectra – an instrument used on the Terra and Aqua satellites. EVI presents an alternative to NDVI which refers to some of its deficiencies, e.g., soil and atmospheric constraints, by optimizing the reflectivity of leaf vegetation.

It uses the blue part of the visible spectrum for signal correction, lowering the effects of the abovementioned constraints including the scattering of electromagnetic radiation by aerosols.

RENDVI or NDRE (Red Edge Normalized Difference Vegetation Index)

This index is based on the standard NDVI index, but with modifications. RENDVI is very useful in precision agriculture, forest monitoring, and the detection of crop stress.

Its effectiveness is due to the inclusion of wavelengths that fall into the red end band, rather than wavelengths that correspond to the value of reflection and absorption. It is especially convenient for detecting small changes in the vegetation condition.

GNDVI (The Green Normalized Difference Vegetation Index)

This index is similar to the NDVI index and measures the reflection of the light in the green part of the spectrum in the wavelength range of 540 to 570 nanometers, instead of the red part of the spectrum. This makes the index more sensitive to the chlorophyll content in the green parts of the crops.

MSI (Moisture Stress Index)

This index is sensitive to the increase in water content in the leaves. The MSI index is used to detect water scarcity stress and is a good indicator of crop conditions often used for crop modeling, fire analysis, and ecosystem physiology. High values ​​indicate water stress and lower water content.

LAI (Leaf Area Index)

This index is used to estimate leaf area and to predict plant growth and yield.

Types of crop satellite imagery

Satellites and technology providers Type of satellite imagery Repeat cycle Spatial resolution
Landsat4-9 RGB, MULTISPECTRAL, PANCHROMATIC 8 days 15, 30, 100 m
Sentinel-2, RGB, MULTISPECTRAL 5 days 10 m
Planet Scope RGB, MULTISPECTRAL Daily 3-4 m
Planet SkySat PANCHROMATIC, MULTISPECTRAL Daily 0.5, 0.71-0.82 m
Airbus Pleiades MULTISPECTRAL Daily 0.5 m
Pleades NEO PANCHROMATIC, MULTISPECTRAL 40 minutes after request 0.3 m
ICEEYE SYNTHETIC APERTURE RADAR Daily 0.25 m
Hyperion HYPERSPECTRAL N/A 30 m
Prism HYPERSPECTRAL N/A 0.3 m

Satellite imaging use-cases

Here are some important use of satellite images in crop monitoring:

Thermal Imagery

The heat emitted by ground-level objects can be seen in thermal photography taken from the air, which also reveals temperature variations that correspond to crop stress. The removal of unnecessary elements, such as pivot equipment, from the image through calibration and image correction prevents data skew.

Cooler regions show purple and warmer regions appear yellow in the final imagery. Thermal imaging is helpful for finding leaks, jams, and other irrigation problems since water cools vegetation. Thermal imaging aids growers in identifying pre-symptomatic disease and pest pressures and responding with more timely and focused interventions by revealing tiny changes in leaf surface temperature.

Soil moisture

Agriculture must take into account soil moisture. For precision farming applications (at the scale of individual fields) and with the anticipation of improving crop yield modeling, the availability of high-resolution soil moisture maps is especially crucial.

Due to the poor spatial resolution and shallow depth of the observations, soil moisture products generated from satellites have so far been employed sparingly in farm- or field-scale agricultural decision support. However, if it can deliver pertinent data on acceptable temporal and spatial dimensions, satellite-derived soil moisture is anticipated to have much potential.

Resolution

High-resolution satellite imaging from low-orbit satellites has recently become more developed and accessible, providing another potential for phenotyping applications. This paper illustrates how satellite photography is used in crop phenotyping and agricultural production, and it identifies plant features that can be assessed using high-resolution satellite data.

The paper covers the benefits of using satellite-based phenotyping in crop breeding programs as well as the drawbacks, such as cloud blockage. It also explores potential uses for high-resolution satellite imaging as a phenotyping tool in the future.

In order to help plant breeders choose high-yielding, stress-tolerant varieties that can help meet global food demand while coping with climate change, high-resolution satellite imagery can be used as a phenotyping tool for the evaluation of crop varieties.

Satellite monitoring

Applications of satellite imagery

GeoPard capabilities and satellite imaging applications offer the users to visualize, normalize, analyze and derive insights directly from the agricultural plots in order to improve crop production. This data utilization can be done with the help of ready-to-use GeoPard algorithms or by creating your own algorithms to make them useful for agronomy.

These algorithms allow evaluation of crop growth, stress, etc. (see photo) or even create prescription maps: for example Nitrogen VR application maps, Crop Protection spraying application maps.


Frequently Asked Questions


1. How to get satellite imagery for farm?

To get it for your farm, research providers, sign up, and access their database or portal. Specify your farm’s location and desired parameters to retrieve relevant images for agricultural monitoring.

2. Why is satellite imagery helpful to understanding food webs?

It is helpful in understanding food webs due to its ability to provide a broad and comprehensive view of ecosystems. By capturing large-scale images of land and water bodies, it allows scientists to observe and analyze the spatial distribution of various habitats and resources.

This, in turn, aids in studying the interactions between different species, identifying key feeding relationships, and comprehending the flow of energy through food webs.

It helps unravel complex ecological dynamics, contributing to a deeper understanding of ecosystem functioning and conservation efforts.

3. How expensive is satellite imagery?

Its cost varies depending on several factors. These include the provider, resolution, frequency of acquisition, and extent of coverage needed. Prices can range from affordable options for low-resolution imagery to more expensive options for high-resolution and real-time monitoring.

Additionally, specialized services or customized data requests may incur additional costs. It is advisable to explore different providers and their pricing models to find a satellite imaging solution that aligns with your specific requirements and budget.

4. What is infrared satellite imagery? How to read it?

It captures the infrared radiation emitted by objects and surfaces on the Earth’s surface. It provides valuable insights into temperature variations and thermal patterns.

To read infrared satellite imaging, one must understand that warmer objects appear brighter in the image, while cooler objects appear darker. By analyzing these temperature variations, one can assess cloud formations, identify land and water temperature disparities, detect wildfires, and even monitor ocean currents.

Understanding the color scale and interpreting the brightness levels on the imagery helps in extracting meaningful information from infrared satellite images.

Hyperspectral imagery for Agriculture. Grant from the state of North Rhine-Westphalia.

We are glad to announce that the “Artificial intelligence framework for quantitative estimation of soil properties using hyperspectral satellite imagery” project was selected for partial funding by the Ministry of the Environment of North Rhine-Westphalia and the European Union under the REACT-EU InnovationUmweltwirtschaft.NRW program. The grant is funded by the European Regional Development Fund / Europäischen Fonds für regionale Entwicklung (EFRE).

the European Regional Development Fund

The use of artificial intelligence and statistics in this project made it possible to determine the correlation between hyperspectral and soil data (e.g., N, pH), facilitating a more precise and scalable approach to soil analysis. The forthcoming launch of hyperspectral satellites with frequent revisit intervals and seamless access to new imagery without delays presents several advantages, particularly in nutrient management for sustainable agriculture. The technology helps assess nutrient content and availability in the soil, allowing farmers to tailor fertilisation strategies. This leads to better nutrient uptake by plants, reduced environmental impact, and cost savings.

What is Hyperspectral imagery?

Hyperspectral imagery is a powerful remote sensing technique that captures the electromagnetic spectrum with high spectral resolution.

Unlike traditional satellite imagery, which typically consists of three to four bands (red, green, blue, and sometimes near-infrared), hyperspectral imagery collects hundreds to thousands of narrow spectral bands across the visible, near-infrared, and shortwave infrared regions. Each band provides unique information about the surface properties of the imaged area.

It is acquired using sensors mounted on airborne or spaceborne platforms. These sensors use spectrometers to measure the intensity of reflected or emitted radiation across multiple narrow bands.

By collecting a wide range of spectral data, hyperspectral sensors can detect subtle differences in the spectral signatures of various materials, allowing for highly detailed and precise analysis.

Applications of Hyperspectral Imagery

  • Environmental Monitoring: It plays a vital role in monitoring and assessing the health of ecosystems. It helps identify vegetation stress, monitor land cover changes, detect invasive species, and measure water quality parameters like chlorophyll concentration or turbidity in lakes and rivers.
  • Agriculture: It aids in precision agriculture by providing detailed information about crop health, nutrient content, moisture levels, and disease detection. Farmers can make data-driven decisions regarding irrigation, fertilization, and pest management, resulting in optimized crop yields and reduced environmental impact.
  • Geology and Mineral Exploration: It is instrumental in mapping geological formations, identifying mineral deposits, and characterizing rock types. It helps geologists detect alterations in mineral composition and map potential areas for exploration, contributing to more efficient and targeted mining activities.
  • Forestry: It assists in forest management and monitoring. It enables the identification of tree species, quantification of forest biomass, detection of tree stress, and assessment of wildfire damage. This information aids in sustainable forest management, biodiversity conservation, and early warning systems for forest fires.

Benefits of Hyperspectral Imagery

Its main advantage lies in its ability to provide detailed spectral information, enabling the discrimination of materials with high accuracy.

This leads to improved classification and mapping of land cover types, enhanced identification of specific substances, and better understanding of environmental processes.

Hyperspectral data can also be analyzed using advanced algorithms and machine learning techniques to extract valuable insights and automate image interpretation.

wpChatIcon
wpChatIcon

    Request Free GeoPard Demo / Consultation


    By clicking the button you agree our Privacy Policy. We need it to reply to your request.

      Subscribe


      By clicking the button you agree our Privacy Policy

        Send us information


        By clicking the button you agree our Privacy Policy