管理区域作成のための惑星画像(日次、解像度3m)

Access to Planet imagery became simpler, faster, and more affordable with GeoPard Agriculture. Since August 2022 GeoPard has released the capabilities to search and analyze only requested Planet images from the user’s preferred date range.

So a GeoPard user requests only preferred Planet images and can use them in GeoPard analytical toolbox.

Planet images extend Sentinel and Landsat coverages (provided by default) and can be mixed with other data layers (harvesting/spraying/seeding machinery datasets, topography profile) via existing Multi-Layer, Multi-Year, 、 そして Equation tools


管理区域作成のための惑星画像


Planet is the largest earth observation satellite network delivering a near-daily global dataset and enables its high-resolution and high-frequency satellite imagery data.

Management Zones Based on Planet Scope (3.5m resolution) imagery.

Read more about GeoPard / Planet Partnership.

What is Planet Imagery And Its Use for Management Zones Creation?

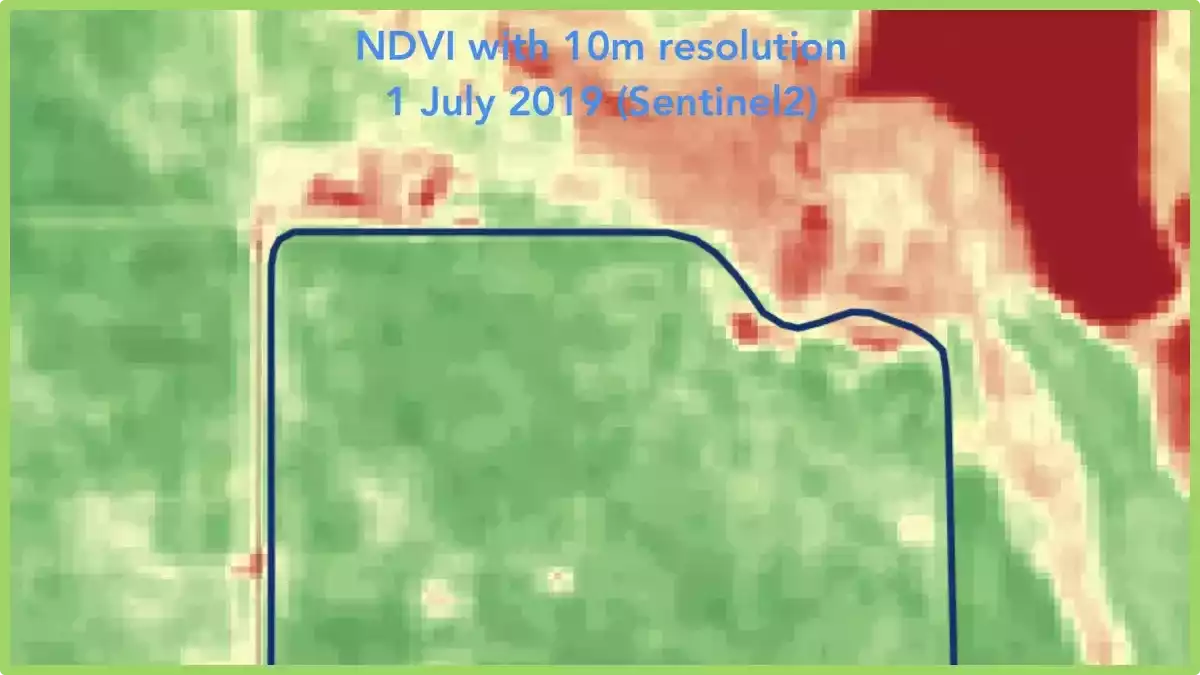
It refers to the satellite imagery provided by Planet Labs, a private company that operates a fleet of small satellites called Doves. These satellites capture high-resolution images of Earth’s surface on a daily basis. The term “3m resolution” means that each pixel in the image represents a 3×3 meter area on the ground. This level of detail allows for detailed analysis and monitoring of various features and changes on the Earth’s surface.

When it comes to management zones creation, Planet Imagery with daily 3m resolution can be highly beneficial for various industries and applications, such as:

  • Agriculture: High-resolution imagery can help in creating management zones in agriculture, where different areas of a field may require different treatments, like irrigation, fertilization, or pest control. By analyzing the imagery, farmers can identify patterns related to crop health, soil moisture, and other factors, enabling them to make better decisions about resource allocation.
  • 環境管理: Satellite imagery can be used to identify and monitor environmentally sensitive areas, such as wetlands, forests, and wildlife habitats. This information can be used to create management zones that protect these areas and ensure sustainable land use practices.
  • Urban planning: High-resolution imagery can help urban planners identify areas of growth, land use patterns, and infrastructure development. This information can be used to create management zones that guide future development and ensure efficient use of resources.
  • 災害管理: Satellite imagery can help in identifying and monitoring disaster-prone areas, such as floodplains or wildfire hotspots. Management zones can be created to establish evacuation routes, allocate resources for disaster response, and inform land use policies that minimize the risk of future disasters.
  • Natural resource management: High-resolution imagery can help in monitoring and managing resources like water, minerals, and forests. By identifying areas of high resource value or scarcity, management zones can be created to ensure the sustainable use and conservation of these resources.

In summary, Planet Imagery with daily 3m resolution is a valuable tool for creating management zones in various fields, providing up-to-date and detailed information that can help decision-makers optimize resource allocation and ensure sustainable land use practices.


よくある質問


1. What can the use of imagery help establish?

The use of imagery can help establish a more efficient and effective farming system. By utilizing technologies like drones or satellite imaging, imagery can provide valuable insights into crop health, soil conditions, and irrigation needs.

It aids in identifying areas of concern, such as pest infestations or nutrient deficiencies, allowing farmers to take targeted actions. Furthermore, imagery helps in monitoring crop growth and development, enabling precise decision-making and maximizing yields. 

衛星画像が作物モニタリングにどのように役立つか

Satellite imagery is one of the most versatile functions that can be implemented in agricultural production in order to improve the decision-making process. Making decisions, based on a large quantity of data, can help the farmers, agronomists, or advisors to comprehend the situation and the processes that are occurring in the agricultural fields that are subject to monitoring.

What is satellite imaging?

Satellite imaging, also known as satellite remote sensing, is the process of using satellite imagery to gather information about the Earth’s surface, atmosphere, and oceans. This technology involves the use of satellites equipped with specialized sensors and cameras that can capture high-resolution images of the Earth from space.

The images captured by the satellites can be used for a variety of applications, including monitoring weather patterns, tracking changes in the environment, mapping land use and vegetation, and assessing the impact of natural disasters. They can also be used for military and intelligence purposes.

Satellite imaging with its benefits can present situations that can not be seen with regular observation. Regular observations can be very demanding in the sense of the quantity of implemented workforce, finance, and time.

Even with regular observations made during the growth period of the crops, there are several things that can not be seen with the naked eye, such as the early progression of 病気 and damage induced by the pests that ultimately result in chlorophyll degradation on a cell level.

With the integration and calculation of spectral bands invisible to the human eye, the growers and the advisors can easily visualize chlorophyll degradation before the visible disease or pest damage symptoms on the plants.

Multispectral Satellite Imagery

These advantages in crop monitoring are beneficial with nowadays technologies, allowing implementation of such information to be integrated into geographic information systems, resulting in creating a prompt and quality set of data ready to be utilized in the decision-making processes regarding agricultural production systems.

Besides making information-based decisions, satellite imagery can be used for reporting, record-keeping, and integrating with different sets of data (disease and pest models, yield maps, pest monitoring, fertilization maps and etc,) in order to create an even more functional system of crop monitoring and the way how the farmer or other professionals see the progress of the crops during their growing period.

How are satellite imagery used in farming?

The images can be used to model and calculate spectral indices which later are equated to be used for visualization in the form of color synthesis, either in the visible part of the spectrum or by including other wavelengths. Properly selected color synthesis can reveal crop growth, stress or soil 侵食 displayed with different colors.

Spectral indices are combinations of spectral reflection of two or more wavelengths to show features of interest. Crop indices are most commonly used in agriculture, but the indices are used for the identification of burned areas, other artificial characteristics, water, and other geological features.

Hyperspectral Satellite Imagery

Useful spectral indices in crop production include:

  • NDVI (Normalized Difference Vegetation Index).
  • EVI (Enhanced Vegetation Index).
  • RENDVI or NDRE (Red Edge Normalized Difference Vegetation Index).
  • GNDVI (The Green Normalized Difference Vegetation Index).
  • MSI or NDWI (Moisture Stress Index).
  • LAI (Leaf Area Index).

NDVI is one of the most used indices and is frequently used to review the initial state of a crop. Other indexes work with certain characteristics, so the results are specific to related to specific agricultural sites, it is important to work with the history of land vegetation.

NDVI(正規化植生指数)

This index is a measure of green vegetation and is generally the most widely used index. The leaves reflect infrared light (NIR) and use only visible light for photosynthesis. This means that a healthy plant with a good photosynthesis rate can be analyzed by comparing NIR with visible red light.

Unhealthy vegetation will reflect more visible light and lower NIR. Healthy vegetation will reduce some of the visible light that falls on it. However, NDVI is sensitive to the effects of soil (light and color), cloud cover, and shade. Also, the NDVI values can be incorrect in a situation with dense vegetation.

EVI (Enhanced Vegetation Index)

This index is the standard for the moderate resolution spectra – an instrument used on the Terra and Aqua satellites. EVI presents an alternative to NDVI which refers to some of its deficiencies, e.g., soil and atmospheric constraints, by optimizing the reflectivity of leaf vegetation.

It uses the blue part of the visible spectrum for signal correction, lowering the effects of the abovementioned constraints including the scattering of electromagnetic radiation by aerosols.

RENDVI or NDRE (Red Edge Normalized Difference Vegetation Index)

This index is based on the standard NDVI index, but with modifications. RENDVI is very useful in precision agriculture, forest monitoring, and the detection of crop stress.

Its effectiveness is due to the inclusion of wavelengths that fall into the red end band, rather than wavelengths that correspond to the value of reflection and absorption. It is especially convenient for detecting small changes in the vegetation condition.

GNDVI (The Green Normalized Difference Vegetation Index)

This index is similar to the NDVI index and measures the reflection of the light in the green part of the spectrum in the wavelength range of 540 to 570 nanometers, instead of the red part of the spectrum. This makes the index more sensitive to the chlorophyll content in the green parts of the crops.

MSI (Moisture Stress Index)

This index is sensitive to the increase in water content in the leaves. The MSI index is used to detect water scarcity stress and is a good indicator of crop conditions often used for crop modeling, fire analysis, and ecosystem physiology. High values ​​indicate water stress and lower water content.

LAI (Leaf Area Index)

This index is used to estimate leaf area and to predict plant growth and yield.

Types of crop satellite imagery

Satellites and technology providers Type of satellite imagery Repeat cycle Spatial resolution
Landsat4-9 RGB, MULTISPECTRAL, PANCHROMATIC 8 days 15, 30, 100 m
Sentinel-2, RGB, MULTISPECTRAL 5 days 10 m
Planet Scope RGB, MULTISPECTRAL Daily 3-4 m
Planet SkySat PANCHROMATIC, MULTISPECTRAL Daily 0.5, 0.71-0.82 m
Airbus Pleiades MULTISPECTRAL Daily 0.5 m
Pleades NEO PANCHROMATIC, MULTISPECTRAL 40 minutes after request 0.3 m
ICEEYE SYNTHETIC APERTURE RADAR Daily 0.25 m
Hyperion HYPERSPECTRAL N/A 30 m
Prism HYPERSPECTRAL N/A 0.3 m

Satellite imaging use-cases

Here are some important use of satellite images in crop monitoring:

Thermal Imagery

The heat emitted by ground-level objects can be seen in thermal photography taken from the air, which also reveals temperature variations that correspond to crop stress. The removal of unnecessary elements, such as pivot equipment, from the image through calibration and image correction prevents data skew.

Cooler regions show purple and warmer regions appear yellow in the final imagery. Thermal imaging is helpful for finding leaks, jams, and other irrigation problems since water cools vegetation. Thermal imaging aids growers in identifying pre-symptomatic disease and pest pressures and responding with more timely and focused interventions by revealing tiny changes in leaf surface temperature.

Soil moisture

Agriculture must take into account soil moisture. For precision farming applications (at the scale of individual fields) and with the anticipation of improving crop yield modeling, the availability of high-resolution soil moisture maps is especially crucial.

Due to the poor spatial resolution and shallow depth of the observations, soil moisture products generated from satellites have so far been employed sparingly in farm- or field-scale agricultural decision support. However, if it can deliver pertinent data on acceptable temporal and spatial dimensions, satellite-derived soil moisture is anticipated to have much potential.

Resolution

High-resolution satellite imaging from low-orbit satellites has recently become more developed and accessible, providing another potential for phenotyping applications. This paper illustrates how satellite photography is used in crop phenotyping and agricultural production, and it identifies plant features that can be assessed using high-resolution satellite data.

The paper covers the benefits of using satellite-based phenotyping in crop breeding programs as well as the drawbacks, such as cloud blockage. It also explores potential uses for high-resolution satellite imaging as a phenotyping tool in the future.

In order to help plant breeders choose high-yielding, stress-tolerant varieties that can help meet global food demand while coping with climate change, high-resolution satellite imagery can be used as a phenotyping tool for the evaluation of crop varieties.

Satellite monitoring

Applications of satellite imagery

ジオパード capabilities and satellite imaging applications offer the users to visualize, normalize, analyze and derive insights directly from the agricultural plots in order to improve crop production. This data utilization can be done with the help of ready-to-use GeoPard algorithms or by creating your own algorithms to make them useful for agronomy.

These algorithms allow evaluation of crop growth, stress, etc. (see photo) or even create prescription maps: for example Nitrogen VR application maps, Crop Protection spraying application maps.


よくある質問


1. 農場用の衛星画像を入手するにはどうすればいいですか?

To get it for your farm, research providers, sign up, and access their database or portal. Specify your farm’s location and desired parameters to retrieve relevant images for agricultural monitoring.

2. 衛星画像は食物網の理解に役立つのはなぜですか?

It is helpful in understanding food webs due to its ability to provide a broad and comprehensive view of ecosystems. By capturing large-scale images of land and water bodies, it allows scientists to observe and analyze the spatial distribution of various habitats and resources.

This, in turn, aids in studying the interactions between different species, identifying key feeding relationships, and comprehending the flow of energy through food webs.

It helps unravel complex ecological dynamics, contributing to a deeper understanding of ecosystem functioning and conservation efforts.

3. How expensive is satellite imagery?

Its cost varies depending on several factors. These include the provider, resolution, frequency of acquisition, and extent of coverage needed. Prices can range from affordable options for low-resolution imagery to more expensive options for high-resolution and real-time monitoring.

Additionally, specialized services or customized data requests may incur additional costs. It is advisable to explore different providers and their pricing models to find a satellite imaging solution that aligns with your specific requirements and budget.

4. What is infrared satellite imagery? How to read it?

It captures the infrared radiation emitted by objects and surfaces on the Earth’s surface. It provides valuable insights into temperature variations and thermal patterns.

To read infrared satellite imaging, one must understand that warmer objects appear brighter in the image, while cooler objects appear darker. By analyzing these temperature variations, one can assess cloud formations, identify land and water temperature disparities, detect wildfires, and even monitor ocean currents.

Understanding the color scale and interpreting the brightness levels on the imagery helps in extracting meaningful information from infrared satellite images.

精密農業におけるリモートセンシングデータを用いた作物収量予測

作物の収穫量を予測するには、植物が受ける日光の量と必要な水の量を理解する必要があります。植物の成長はこれら2つの要因に依存しますが、温度、湿度、水など、植物の成長に影響を与える他の多くの要因もあります。 土壌の種類.

世界の農作物生産量と品質は、食料安全保障に影響を与える主要な要因である。これは、農業が依然として経済の重要な部分を占める開発途上国において特に重要である。.

リモートセンシング データは、植物が受ける光量を推定し、作物の収穫量を予測するために使用できます。リモートセンシングデータは、作物の収穫量を推定するための強力なツールです。生育中の作物とその環境に関する情報を提供し、作物の生産量を推定することを可能にします。.

リモートセンシングデータは、農業におけるデータ分析の一形態であり、収穫前に収量を予測するために利用できます。この記事では、リモートセンシングデータについて知っておくべきすべてのことを解説します。.

農業における作物収量データとは何ですか?

作物収量データとは、農家または農家グループが生産した作物の量に関する情報です。これには、1ヘクタール当たりの収穫量が含まれます。収穫量は、作物に応じてトン、ブッシェル、またはその他の単位で測定できます。.

農作物の収穫量データは、農家が来シーズンにどれだけの作物を植えるべきかを判断する上で重要です。さらに、収穫量データによって、作物に何らかの問題があり、対処が必要かどうかを判断することもできます。.

収量データは、政府、非政府組織、その他の利害関係者によって設定された世界的目標の達成状況を監視するためにも利用できる。.

さらに、収量データは農業慣行の長所と短所を特定し、この情報に基づいて推奨事項を作成するために使用されます。収量データは、次のような農業の多くの側面について情報に基づいた意思決定を行うのに役立ちます。

精密農業におけるデータ分析

種子の選定: 収量データに基づいて品種や交配種を選択することで、最も収益性の高い種子を畑に植えることを確実にすることができる。.

害虫駆除: 植物の成長を監視することで、収量データは農家がいつ導入するかを判断するのに役立ちます。 害虫駆除 対策。これにより、農薬の使用量を減らし、利益を増やすことができる。.

灌漑スケジュール: 収量モニターからの情報を用いることで、農家は灌漑スケジュールを微調整することができ、高い収量を維持しながら水と費用を節約するのに役立つ。.

リモートセンシングデータとは何ですか?

リモートセンシングとは、対象物に直接接触することなく、つまり非侵襲的な方法で、対象物や現象に関する情報を取得する科学である。農業分野では、作物、土壌、水分状態を監視するために利用されている。.

リモートセンシングは、電波、マイクロ波、赤外線、可視光線、紫外線などによって放出される電磁波(EMR)を利用する。.

作物のリモートセンシングは、作物の生育状況を時系列で測定する手段を提供する。また、特定の時間と場所における作物の状態に関する情報も提供する。この情報は、作物の収穫量を推定したり、収穫時期を予測したりするために利用できる。.

リモートセンシングデータは、土地利用の変化の測定、作物の生育状況や農作物の収穫量の監視、土壌水分量や塩分濃度の検出、害虫の発生レベルの判定、環境汚染レベルの監視などに利用できます。.

例えば、畑を歩きながら植物を観察している場合、植物に関するデータを収集していることになります。ヘリコプターや飛行機で上空から植物を観察している場合は、リモートセンシングデータを収集していることになります。.

このデータを収集するために用いられるリモートセンシング技術や装置には、衛星画像、航空写真、レーダーシステム、ライダーなど、さまざまな種類がある。.

作物の収穫量予測とは何ですか?

作物収量予測とは、特定の地域と生育期間における特定の作物の潜在的な、あるいは予想される収量を推定するプロセスである。.

これは、気象条件、土壌特性、作物の遺伝的特性、管理方法など、さまざまな要因を分析し、収穫量の見込みについて十分な情報に基づいた予測を行うことを含みます。.

農業システムの複雑さや、害虫、病気、異常気象などの予測不可能な要因の影響により、作物の収穫量予測には不確実性が伴うことに留意することが重要です。.

予測モデルは貴重な洞察を提供するものの、絶対的な確実性を与えるものではなく、意思決定を支援するツールとして機能する。.

どのように機能するのですか?

以下のデータソースを組み合わせることで、各地域の現在の作付け状況に基づき、収量予測値に様々な重み付けを行う。.

Farmers Edgeのデータサイエンティストは、これらのデータソースと最新の機械学習技術を組み合わせ、主要な収量構成要素に障害が発生した場合に、収量予測を更新します。.

1. プレシーズンデータ

作物の収量予測の基礎を築くためには、作付け前のデータが正確でなければなりません。この情報は作物の植え付け前に入手可能であり、最初の収量予測値を算出するための土台となります。.

圃場の位置、現在および過去の作物、植え付けまたは播種前の圃場固有の気象月、土壌検査情報およびデータ、過去10年間の地域的な気象傾向などのデータをすべて組み合わせることで、正確な収量予測に基づいてシーズンを開始する方法に関する洞察が得られます。.

2. シーズン中のデータ

作付け期間中のデータは、基礎工事が完了した後、生育期間全体を通して農作物の収穫量に影響を与える様々な要因についての洞察を与えてくれる。.

Farmers Edgeの農場設置型気象観測所は、現場中心のデータを提供し、期待値と予測値を提供することでこれらのデータセットを強化します。これらの値は保存され、毎日データが届くたびにリセットされるため、モデルの精度が向上します。.

肥料散布などのその他の生育期間中のデータも、計画的か否かにかかわらず、圃場診断の精度向上や収量予測値の提供のために、生育期間中に考慮されます。.

3. 作物別データ

ファーマーズエッジの広範な地域農業専門家ネットワークは、生育期間中に作物ごとのデータを提供することも可能だ。.

Farmers Edgeの農学者たちは、収量予測の対象となる主要5作物(トウモロコシ、キャノーラ、レンズ豆、大豆、小麦)について、生育期間中の収量に影響を与える作物固有のデータを特定しました。これには、主要な生育段階における水分含有量や、収量を決定する重要な期間における作物の適温を超える時間などが含まれます。.

4. 作物と畑の画像

高解像度の衛星画像を用いることで、圃場におけるNDVI(正規化植生指数)の作物健全性値を迅速かつ正確に設定することが可能となり、研究者は収量に影響を与える可能性のある作物に関する誤った結果や地域的な問題点を調査することができる。.

これらの地域的な傾向を利用することで、各地域が予測通りに進んでいるかどうか、あるいは環境要因によって作物の収量予測値が歪められているかどうかを判断することができる。.

5. ヒストグラムデータ

Farmers Edgeの収量予測モデルは、ビッグ統計を用いて、時間の経過に伴う圃場画像の分布の変化を検出します。そして、この変化を畳み込みニューラルネットワークに伝え、これらの変化を利用して、米国やカナダなどの広大な地域における収量を予測します。.

農業におけるリモートセンシングデータとは何ですか?

収穫機が畑に入る前に生産量を予測するのは容易ではありませんが、ファーマーズエッジのチームは、完全かつ正確な統計データに基づいた農作物の収穫量予測を生産者の皆様に提供できることを大変嬉しく思っています。.

各データソースは作物収量予測において重み付けされており、その重み付けはモデルパラメータに基づいて変更可能です。.

精密技術を用いて農作物の収穫量を増やすにはどうすればよいでしょうか?

農場主たちは何世代にもわたって、農作物の収穫量を増やす方法について議論し、努力を重ねてきた。発見された方法の中には効果的なものもあれば、効果のないものもあった。.

農業は、先代の農家が培ってきた貴重な経験に加え、現代の科学技術の進歩からも恩恵を受けることができる。.

農家が収穫量を増やすための最も一般的な方法と、過去の経験や新しい技術をどのように活用して農業生産性を向上させることができるかを見ていきましょう。.

1. 適切な灌漑

農地の単位面積当たりの平均収穫量を増やしたい農家にとって、適切に設計された灌漑システムは不可欠です。植物に適切な量の水を与えることは、植物の生育に直接影響を与え、結果として農作物の収穫量にも繋がります。.

農地の効果的な灌漑には、天気予報が不可欠です。今日の技術のおかげで、農家向けにカスタマイズされたプログラムやソフトウェアなど、超局地的な天気予報が可能になりました。.

それは 精密灌漑 これは、農家が事前に準備をし、作物の灌漑を可能な限り正確かつ効率的に計画できるようにすることで可能になる。.

2. 土壌検査とその品質

作物の収穫量に影響を与える最も重要な要因の一つは、土壌の質、つまり肥沃度です。農業生産以外にも、土壌の質は農家が特定の植物を栽培するのにかかる費用にも影響します。なぜなら、植物によっては、土壌中の特定の要素(鉱物粒子、有機物、水、空気など)の比率が一定である必要があるからです。.

農家は、より高い農作物の収穫量を達成するために、自分の農地の土壌の状態を定期的に監視する必要がある。. 輪作 これは、とりわけ土壌を健康に保つための最も効果的な技術の一つです。.

特定の圃場における輪作は、土壌の疲弊を防ぎ、害虫の発生サイクルを中断させるため、農業生産量の増加につながり、結果として1エーカーあたりの平均収量の増加をもたらす。.

3. 種子の品質

農家が畑に種をまく際に使用する種子の品質は、農業生産に影響を与えます。そのため、農業従事者は、農作物の収穫量を増やすために、必要な品質管理をすべてクリアした認証済みの種子のみを農地に播種することが推奨されます。.

認証種子は非認証種子よりも高価かもしれませんが、種子の品質は作物の生産性に影響を与える最も重要な要素の一つであるため、その価値は十分にあります。.

それ以外にも、高品質の種子のみを使用することは、作物の生産性を向上させるための最も環境に配慮した方法の一つです。農家は、関連する種子会社に連絡を取り、必要に応じて特定の区画でカスタマイズされた試験栽培を手配することで、特定の種子の品質を調べることができます。.

それとは別に、種子の品質は永続的ではなく、影響を受けないわけではないことを理解することが重要です。種子は土に蒔かれた瞬間から保護を必要とします。そのための種子処理方法の一つが、種子コーティングです。.

これは、種子を外部材料で包むことで、その特性(重量、サイズ)を向上させたり、植物病害から保護し、成長を促進するために活性化学物質(微量栄養素、微生物接種剤、成長調節剤など)を与えたりする技術である。.

4.肥料の賢明な施用

肥料 肥料は様々な種類の土壌を養い、植物の生育を促進し、収穫量を増やすように設計されていますが、その使用はバランスよく、慎重に行う必要があります。肥料の過剰使用は土壌の質に深刻な影響を与え、結果として農業生産性を低下させる可能性があります。.

圃場内の様々な場所では、必要な土壌施肥量が異なる場合があるため、圃場の各区域のニーズに応じて肥料を選択的に施用するのが最善策です。このように圃場施肥を適切に行うことで土壌を健全に保ち、結果として単位面積当たりの平均収量を向上させることができます。.

A 作物モニタリングソフトウェア これは、この文脈における技術オプションの1つです。衛星写真に基づいて農地を2~7つのゾーンに分割し、他の場所よりも注意が必要な場所を特定する圃場ゾーニングツールが含まれています。.

栽培者は、環境に優しい方法で収穫量を増やすために、精密技術を頻繁に利用している。.

5. 作物保護方法

収穫量を増やしたい農家は、作物の生育期間全体を通して、そして栽培期間の終わりまで、作物の手入れを怠ってはなりません。農家は状況に応じて、雑草、害虫、病気が作物の生産性に及ぼす影響を軽減するために、さまざまな薬剤を使用します。.

除草剤、殺虫剤、乾燥剤、植物成長調整剤、殺菌剤、補助剤、その他の化学物質は、一般的な例です。作物の保護はさまざまな方法で行うことができます。雑草・害虫防除と植物病害防除は、最も重要なものの2つです。.

6. 植物病害の予防と管理

植物の病害感染は、栽培農家の農業生産性にとって重大な脅威の一つです。農家は、栽培する植物の種類に応じて、耐病性または耐病性の品種を選んだり、種子を殺菌剤で処理したり、生育中の植物に殺虫剤などの薬剤を散布したりするなど、さまざまな植物病害予防・管理方法を用いることができます。.

農業従事者は、これらの対策やその他の戦術をいつ実施するかを特に注意深く検討し、最大限の効果が得られるようにする必要があります。適時な病害虫防除は、農地の収量指標にとって極めて重要であることを念頭に置いておく必要があります。問題が早期に発見されればされるほど、解決は迅速かつ容易になり、影響を受ける農地面積も少なくて済みます。.

7. 雑草および害虫管理

生育期において、農家にとって最大の課題は雑草防除と害虫管理です。例えば、1本の雑草から1000万個以上の種子が生産されることがあり、これを速やかに防除しなければ、特定の畑の収穫量が大幅に減少し、長年にわたって問題を引き起こす可能性があります。また、農業従事者は害虫の蔓延に対しても総合的な対応を取る必要があります。.

害虫は適応力が高く繁殖力も強いため、特定の農地の農作物に被害を与える可能性があり、農家は常に害虫の発生問題に迅速に対応できる体制を整えておく必要がある。.

作物の収穫量予測は、農家の利益率に直接影響するため、農家にとって非常に重要な課題です。農家は自分の土地からどれくらいの収穫量が見込めるかを把握していれば、それに応じて作付け計画を立て、利益率を高めることができます。そのため、特定の土地に作物を植える前に、農作物の収穫量を正確に予測することが重要なのです。.

GeoPard農業ツールによる作物収量予測

これは古代から農業における重要な課題であり、特に干ばつ、洪水、その他の自然災害時には、食料安全保障にとって極めて重要である。.

作物の収穫量予測は、土壌水分量、害虫の発生状況、気象条件や肥料の必要量などの要因に基づいて、作物の植え付け時期や収穫時期を決定する際に農家によっても利用される。.

農場収量データを活用して、より情報に基づいた意思決定を行い、栽培効率を向上させるために、, ここをクリック 今すぐデモをリクエストしてください。.


よくある質問


1. 農家はどのようにして作物の収穫量を増やすのでしょうか?

農家は、土壌管理、効率的な灌漑、輪作、害虫・雑草防除などを通じて作物の収穫量を増やしています。これらの手法は、土壌の肥沃度と水分の利用可能性を最適化し、害虫や病気を最小限に抑えることで、作物の生産性向上につながります。.

2. 1ヘクタール/区画あたりの作物収量を計算する方法は?

収穫量は、さまざまな方法や要素を用いて測定できます。一般的な方法の一つは、特定の地域から代表的な作物サンプルを実際に収穫し、その重量を測定することです。この重量を基に、畑全体または農場全体の総収穫量を推定します。.

例えば、サンプルの重量が100キログラムで、畑の面積が2ヘクタールの場合、1ヘクタールあたりの収穫量は50キログラムになります。.

さらに、リモートセンシングや衛星画像などの高度な技術を用いることで、作物の健康状態、植生指数、バイオマスなどを評価し、貴重な知見を得ることができる。.

穀物の品質、大きさ、市場価格などの他の要素も、測定時に考慮されます。例えば、サンプルが100キログラムで、畑の面積が2ヘクタールの場合、1ヘクタールあたりの収穫量は50キログラムになります。.

3. 収穫前に作物の収穫量をどのように予測しますか?

収穫前に作物の収量を推定するには、複数の方法を組み合わせることができる。.

一つのアプローチは、播種時期、気象条件、作物の健康状態などの要因を考慮した作物固有の成長モデルを使用して、潜在的な収量を予測することです。

別の方法としては、衛星画像やドローンなどのリモートセンシング技術を用いて、作物の生育状況やバイオマスを評価する方法がある。.

4. どのタイプの農業システムがより健康的な穀物を生産しますか?

有機農業は、より健康的な穀物と関連付けられることが多い。有機農業では、合成殺虫剤、除草剤、遺伝子組み換え作物(GMO)の使用を避け、代わりに天然肥料、輪作、生物的害虫防除法を用いる。.

これらの手法は、化学物質残留物のない、必須栄養素の含有量が高く、農薬汚染レベルが低い穀物の生産に貢献する。.

しかし、穀物の具体的な健康効果は、土壌の質、作物の品種、収穫後の取り扱い方法などの要因によって異なる場合があることに留意することが重要です。.

5. 農薬はどのようにして作物の収穫量を増やすのでしょうか?

農薬は、様々な害虫、病気、雑草から植物を守ることで、収量を増加させる効果があります。農薬は、作物に被害を与えたり、枯らしたりする可能性のある有害な昆虫、真菌、細菌、その他の生物を抑制または駆除するのに役立ちます。.

殺虫剤は害虫の影響を軽減することで、植物がより旺盛に成長し、栄養素を効率的に利用し、より多くの資源を生産的な成長に配分することを可能にする。

農業向けハイパースペクトル画像。ノルトライン=ヴェストファーレン州からの助成金。.

We are glad to announce that the “Artificial intelligence framework for quantitative estimation of soil properties using hyperspectral satellite imagery” project was selected for partial funding by the Ministry of the Environment of North Rhine-Westphalia and the European Union under the REACT-EU InnovationUmweltwirtschaft.NRW program. The grant is funded by the European Regional Development Fund / Europäischen Fonds für regionale Entwicklung (EFRE).

the European Regional Development Fund

The use of artificial intelligence and statistics in this project made it possible to determine the correlation between hyperspectral and soil data (e.g., N, pH), facilitating a more precise and scalable approach to soil analysis. The forthcoming launch of hyperspectral satellites with frequent revisit intervals and seamless access to new imagery without delays presents several advantages, particularly in nutrient management for sustainable agriculture. The technology helps assess nutrient content and availability in the soil, allowing farmers to tailor fertilisation strategies. This leads to better nutrient uptake by plants, reduced environmental impact, and cost savings.

What is Hyperspectral imagery?

Hyperspectral imagery is a powerful remote sensing technique that captures the electromagnetic spectrum with high spectral resolution.

Unlike traditional satellite imagery, which typically consists of three to four bands (red, green, blue, and sometimes near-infrared), hyperspectral imagery collects hundreds to thousands of narrow spectral bands across the visible, near-infrared, and shortwave infrared regions. Each band provides unique information about the surface properties of the imaged area.

It is acquired using sensors mounted on airborne or spaceborne platforms. These sensors use spectrometers to measure the intensity of reflected or emitted radiation across multiple narrow bands.

By collecting a wide range of spectral data, hyperspectral sensors can detect subtle differences in the spectral signatures of various materials, allowing for highly detailed and precise analysis.

Applications of Hyperspectral Imagery

  • Environmental Monitoring: It plays a vital role in monitoring and assessing the health of ecosystems. It helps identify vegetation stress, monitor land cover changes, detect invasive species, and measure water quality parameters like chlorophyll concentration or turbidity in lakes and rivers.
  • Agriculture: It aids in precision agriculture by providing detailed information about crop health, nutrient content, moisture levels, and disease detection. Farmers can make data-driven decisions regarding irrigation, fertilization, and pest management, resulting in optimized crop yields and reduced environmental impact.
  • Geology and Mineral Exploration: It is instrumental in mapping geological formations, identifying mineral deposits, and characterizing rock types. It helps geologists detect alterations in mineral composition and map potential areas for exploration, contributing to more efficient and targeted mining activities.
  • Forestry: It assists in forest management and monitoring. It enables the identification of tree species, quantification of forest biomass, detection of tree stress, and assessment of wildfire damage. This information aids in sustainable forest management, biodiversity conservation, and early warning systems for forest fires.

Benefits of Hyperspectral Imagery

Its main advantage lies in its ability to provide detailed spectral information, enabling the discrimination of materials with high accuracy.

This leads to improved classification and mapping of land cover types, enhanced identification of specific substances, and better understanding of environmental processes.

Hyperspectral data can also be analyzed using advanced algorithms and machine learning techniques to extract valuable insights and automate image interpretation.

Remote crop monitoring system: How does it work?

A remote crop monitoring system in precision agriculture refers to the use of various technologies and tools to monitor and manage crops from a distance. This approach leverages data collection, analysis, and communication technologies to make informed decisions about crop health, irrigation, fertilization, and overall farm management.

Farming is not left behind in the 21st century where everything is going digital. As you read this article, several farmers spread across the globe are already using tech to perform several tasks in their fields such as monitoring plant humidity, soil conditions, general health, temperatures, and even many more the use of sensors.

By embracing technology, farmers are enjoying the benefits of having accurate statistics as compared to the old days when they used guesses works and intuitions to make choices. This helps them in making better judgments that result in increased harvests.

What is crop monitoring system?

Crop monitoring refers to the process of systematically observing, assessing, and collecting data about crops throughout their growth cycle.

It involves regular and systematic observation of crops to gather information about their health, growth, and development.

Its goal is to make informed decisions regarding crop management practices, optimize resource utilization, and maximize yields. It typically involves the following activities:

  • Visual Inspection
  • Phenological Observations
  • Soil Monitoring
  • Weather Monitoring
  • Sensor-Based Monitoring
  • Data Analysis

By monitoring crops, farmers can proactively address problems, optimize resource allocation, and make informed decisions to improve overall crop health, yield, and profitability. It is an essential component of precision agriculture, enabling farmers to practice targeted and sustainable crop management.

Smart crop monitoring system: How does it work?

Its main goal is to ensure that farming becomes easier and more profitable as compared to traditional methods. From displaying data about the fields all the way to weather forecasts, below is all that you may want to know about remote crop monitoring and related topics.

A smart crop monitoring system incorporates various technologies to collect, analyze, and utilize data for efficient crop management. Here’s a breakdown of how it typically works:

1. Sensor Deployment

The system begins by deploying sensors in the field. These sensors can measure parameters such as soil moisture, temperature, humidity, nutrient levels, and light intensity.

They may also include weather sensors to capture data on rainfall, wind speed, and solar radiation. The sensors are strategically placed throughout the field to gather representative data.

2. Data Collection

The deployed sensors continuously collect data from the field. This can be done using wired or wireless connections.

Wireless sensors are commonly used as they provide flexibility and ease of deployment. The collected data is sent to a central system for further processing and analysis.

3. Data Transmission

Wireless sensors transmit the collected data to a central hub or gateway. This can be done using various wireless communication technologies such as cellular networks, Wi-Fi, or dedicated radio systems. The data transmission can be in real-time or at regular intervals depending on the system’s configuration.

4. Data Storage and Processing

The collected data is stored in a database for further analysis. Advanced data processing techniques, including machine learning algorithms and statistical models, are applied to the data to extract meaningful insights and patterns. This analysis helps identify correlations, trends, and anomalies in the crop conditions.

5. Decision Support and Alerts

Based on the analyzed data, the system provides decision support to farmers or agronomists. It generates alerts and notifications regarding critical events, such as soil moisture levels dropping below a threshold or the presence of pests or diseases.

These alerts are delivered through web-based dashboards, mobile applications, or email/SMS notifications, enabling timely interventions.

6. Visualization and Reporting

The system presents the analyzed data in a user-friendly manner through visualizations and reports. Graphs, charts, and maps are often used to convey information about crop health, growth patterns, and environmental conditions. This helps farmers interpret the data easily and make informed decisions.

7. Automation and Control

In some cases, it can be integrated with automated irrigation systems, fertigation systems, or machinery.

Based on the collected data and analysis, the system can automatically control irrigation schedules, adjust nutrient application rates, or activate pest management measures.

This integration allows for real-time, data-driven decision-making and precise control over crop management practices.

The ultimate goal of a smart crop monitoring system is to optimize resource utilization, improve crop productivity, and reduce costs by providing farmers with accurate and timely information for decision-making. By leveraging technology, such systems enable more efficient and sustainable crop management practices in modern agriculture.

The importance of a remote crop monitoring system

Among the most important tasks that are always done for good yields is the monitoring of crops. Since plants are constantly monitored, it ensures that they grow in the best conditions, and in case of any anomalies, it is corrected on time hence reducing the devastating impending impact.

As a farmer or agriculture enthusiast, it is worth noting that it is currently a must-do for one to expect better massive harvests and those that are of higher quality since most of the drawbacks are settled early enough.

Since monitoring crops is one of the pillar requirements for a good harvest, one needs to go for special training. Special training doesn’t mean one needs to hold a master’s or bachelor’s degree but only needs to understand how to coordinate, monitor and even weigh the obtained results. Through this, you will be able to make better decisions based on accurate diagnosis and later best quality yields.

When choosing to monitor your crops, you need to know that apart from prevention of infestations and spread of pests, diseases and even weeds are always under control hence no devastating effects that lower the performance and even the quality of the final products.

Are you aware that crops are always exposed to strange threats yearly due to mutations and transformations in the biological components of the pests hence usually choosing one similar method of treating them means you are mistaken and need to change tactics every time?

For that reason, monitoring crops is perceived as a serious task that needs more responsibility and one that should not be degraded.

Whenever one is monitoring fruit crops such as pears and even apples, when using an Integrated Pest Management Programme, it is advisable not only to track changes in trees but also to check on the weather in the area that affects them.

This enables you to have a list of possible pests that may pose a threat to the growth of trees. Using systematic visual monitoring of the orchard block will work whenever you want to reduce the cost and your time from planting season to the harvesting season.

Climate and pests

The questionable part when analyzing the influence of climate is simply that some pests can feed on it and later be toxic to agents to crops so fast. Basically in agriculture, many farmers always lack awareness hence noticing when it is too late when their crops are already massively infested by pests.

The better part of this is that pests always do react predictably to the climate hence a perfect strategy can be hatched to avoid another pest attack and also prevent them in the future.

Despite monitoring being done more frequently, vegetable and fruit farmers always get to know the presence of pests or any threat a little late. This shows how important it is to monitor climatic factors that eventually turn out to be earlier signs of the emergence and pest infestation.

Block crop monitoring

Many ways can be used to monitor crops, and one of them is through visual monitoring using blocks that enable you to analyze trees that have similar characteristics based on their variety, age, and, even physical condition.

The idea behind visual monitoring is to have blocks that act as signs and those that can be studied like they were a unit and not separately since it is a way that is used by several farmers across the globe and that horticultural experts always have limited time for them to review each of the blocks arranged in the field.

importance of a remote crop monitoring system

Certain attention needs to be paid during the selection of the most appropriate block. This is because the block that is chosen needs to have all the history of the pests so that the best treatment and prevention can be applied to protect the growth of other trees.

You do not have to have large equipment, tools, and even complex methods to monitor your crops. One of the best ways to go is simply to do a meticulous and extensive visual examination that enables you to notice the different types of 害虫 present in the trees.

This can be always completed using a common lens, however, experts will always use more complex equipment such as a binocular microscope. This enables them to count and even identify mites and thrips.

Temperature of crops

For one to accurately measure the temperature when monitoring crops, he or she can choose to use a simple thermometer after finding out about simple information. Besides that, you may also choose to use a maximum to a minimum thermometer that is very common among rural suppliers and record extra information.

It is also worth noting that the thermometer needs to be placed on the orchard and ensure that it is not exposed to direct sunlight. You may also add a data logger to record more accurate weather information.

For data loggers, you may also choose to use those that have the potential of measuring the temperature, rain, humidity, and even the humidity of the leaves.

For you to put aside trees that will not be studied with those in the blocks that will act as indicators, for you to be able to differentiate them, you simply need to mark them using acrylic paint or even adhesive tape.

Application of an Integrated Pest Management vouches for selecting and marking flowers, buds, and fruits randomly to monitor each one of the trees.

After about the duration of one to two weeks, at the time that the fruit is developing, farmers need to spend ten to twenty minutes for every two and a half acres strictly managing the fruits, flowers, and buds that are marked searching for any signs that may show the presence of one or even more pests in the crop.

Whenever a pest is found in the crops, it needs to be recorded fast and also in a detailed way in the log made exactly for this kind of data.

結論

All our expert team of agronomists are professionals in a range of branches of agriculture and are also capable of providing monitoring services through merging field visits with quantitative and qualitative assessment and agriculture remote crop monitoring system.

All these innovative systems are assessments that are focused on a wide range of activities that carefully monitor crop developments, gathering data and information that is related to the area.

This data is then carefully analyzed by our professional team and then noted in a final report that enables them to mention and evaluate major factors and factors that are capable of affecting the productivity of the crops.

Based on these results GeoPard is then able to give you an estimated time for harvesting, and also crop yield. This enables clients to smoothly monitor their crops through the recent satellite imagery. Weight data layers in a given place without using a given facility.

農業におけるリモートセンシングの種類

近年、農業分野においてリモートセンシングなどの先端技術システムの利用が増加している。今日の農業手法は、従来の農業手法と比べて、はるかに効率的で、一貫性があり、合理化されている。.

例えば、栽培過程のあらゆる側面において作物収量予測などの高度な手法を用いることで、理想的な収量とより良い収穫を実現できる。.

収穫量を増やすためには、農家は作物の健康状態を良好に保つ必要がある。従来のシステムでは、農民が土地の隅々まで実際に訪れることが期待されていたため、より広い地域を観察する必要があった。.

最新の技術革新により、農家はより広い地域で作物の品質を容易に検査できる様々な方法が提供されるようになった。.

リモートセンシングとは何ですか?

定義するリモートセンシングとは、地球の表面やその他の物体に関する情報を遠隔から収集する研究分野および技術です。衛星、航空機、ドローンなどの様々な装置やセンサーを用いて、対象物に物理的に接触することなくデータを収集します。.

簡単に言うと、これは高度な機器を用いて遠距離から土地を調査する作業です。調査対象には、土地の物理的特性が含まれます。.

このプロセスは、土地から発生する放射線と反射される放射線を推定することによって機能し、それによって土地の全体像を把握し、専門家が土地の特定の部分について判断を下すのに役立ちます。.

これらの電磁波には、可視光線、赤外線、マイクロ波放射が含まれます。科学者は、これらの放射の特性を分析することで、地球の特徴やプロセスに関する貴重な情報を得ることができます。.

環境モニタリング、農業、都市計画、災害管理など、さまざまな分野で幅広い応用が可能です。直接アクセスすることが困難または不可能な地球表面の広範囲を観測・研究する手段を提供します。.

リモートセンシングは何に使われるのですか?

増強するために 作物開発 厳しい市場環境下で収穫量を増やすため、生産者は利用可能な最新技術を積極的に活用する傾向がある。最高の収穫量を確保するには、農家は作物を最適な状態で維持する必要がある。.

農業におけるリモートセンシングの活用により、広大な地域における収穫量の状況を把握することが格段に容易になる。.

このプロセスから収集されたデータは精密栽培を支援し、農家が収穫量を増やすことを可能にする。. 一般的なリモートセンシングの応用例には以下のようなものがあります。

  • 土地被覆と土地利用のマッピング: このシステムは、森林、農地、水域、都市部など、さまざまな種類の土地被覆を識別・分類することができます。この情報は、土地利用の変化の監視、森林破壊の評価、天然資源の管理、都市開発計画に役立ちます。.
  • 環境モニタリング: これにより、植生の状態、水質、大気汚染、気候変動指標といった環境パラメータの観測と分析が可能になります。また、山火事、干ばつ、極地の氷冠の融解といった自然現象の監視と理解にも役立ちます。.
  • 農業と作物管理: 農業用リモートセンシングは、作物の健康状態を評価し、収穫量を推定し、害虫や病気の影響を受けている地域を特定することができます。この情報は、農家が灌漑、施肥、害虫防除について十分な情報に基づいた意思決定を行うのに役立ち、作物の生産性向上と資源管理の改善につながります。.
  • 災害管理: これは災害対応と復旧活動において極めて重要な役割を果たします。ハリケーン、洪水、地震などの自然災害の被害範囲を把握するのに役立ち、資源の効率的な配分と援助物資の配布を可能にします。また、災害後の被害状況の評価や復興活動の計画にも役立ちます。.
  • 地質学と鉱物探査: ハイパースペクトル画像処理やレーダーなどの技術を用いることで、地質学的特徴や鉱床を検出・分析することができる。これらの情報は、地質図作成、鉱物探査、資源評価に役立つ。.

リモートセンシング技術は、センサー技術、画像処理アルゴリズム、データ分析手法の進歩に伴い、進化を続けている。.

高解像度衛星画像の入手可能性の向上と、リモートセンシングデータと地理情報システム(GIS)の統合に伴い、その応用範囲と可能性は拡大しており、地球への理解を深め、情報に基づいた意思決定プロセスを促進することに貢献している。.

リモートセンシングはどのように機能するのか?

リモートセンシングは、地球上の物体や表面から放出または反射される電磁波を遠くから捉えて分析することで機能します。以下に、リモートセンシングの仕組みを簡略化して説明します。

リモートセンシングはどのように機能するのか?

  • エネルギー源: エネルギー源は、自然エネルギー(太陽光など)または人工エネルギー(レーダーなどのアクティブセンサーなど)から始まる。エネルギー源は、地球表面に向けて電磁波を放射する。.
  • ターゲットとの相互作用: 放出されたエネルギーは、標的となる物体や表面と相互作用する。エネルギーの一部は吸収され、一部は反射され、一部は標的を透過する。この相互作用は、標的の組成、質感、水分含有量などの特性によって異なる。.
  • センサー検出衛星、航空機、ドローンなどに搭載されたセンサーは、対象物から反射または放出されるエネルギーを検出します。これらのセンサーは、可視光線、赤外線、マイクロ波など、幅広い波長を捉えることができます。.
  • データ取得: センサーは、デジタル画像または測定値の形でデータを収集します。取得されるデータには、異なる波長における反射または放射エネルギーの強度などが含まれる場合があります。.
  • データ伝送と保存: 収集されたデータは、地上局に送信されるか、センサープラットフォームに保存されます。その後、処理され、さらなる分析に利用できるようになります。.
  • データ処理と分析: リモートセンシングデータは、特殊なアルゴリズムと技術を用いて処理されます。これには、大気干渉、幾何学的歪み、放射測定校正の補正が含まれます。処理されたデータは、地球表面に関する有意義な情報を抽出するために分析されます。.
  • 解釈と適用: 分析されたデータは、科学者、地理学者、農学者などの専門家によって解釈されます。彼らは対象物を識別・分類し、土地被覆の種類を地図化し、変化を監視し、さまざまな用途に関連する情報を抽出します。.
  • 視覚化とコミュニケーション: 最終結果は、地図、画像、その他の図表などを用いて視覚化されることが多い。こうした視覚的な出力によって、意思決定者、科学者、そして一般の人々が情報を理解し、解釈しやすくなる。.

重要な点として、このシステムは受動型センシング技術と能動型センシング技術の両方を利用できる。受動型センサーは、地球表面から反射または放射される自然エネルギー(太陽光など)を検出する。一方、能動型センサーは、自らエネルギー(レーダーパルスなど)を放射し、反射されたエネルギーを測定する。.

農業分野ではどのように機能するのか?

農業におけるリモートセンシングのプロセスは、一定期間にわたって様々な機器によって収集された情報に基づいて行われます。収集されたデータは、作物や収穫量の様々な側面を分析するために使用できます。.

この分析は、収穫量を最大化するために作物の改良を行う際に用いられます。このプロセスは、様々な分析を実施し、それに応じて対策を講じるために活用できます。農家が直面する一般的な脅威は、害虫の蔓延と作物の雑草です。.

農業分野では、病害を早期に発見し、農家が必要な対策を講じて作物の健全性を確保できるよう警告するのに役立ちます。規模や収穫物の種類が異なる様々な土地でこのプロセスを実行するために、様々な種類の装置やセンサーが利用されます。.

農業におけるリモートセンシングの種類

農業分野におけるリモートセンシング技術は、作物や農地の景観に関するデータを収集・分析するための様々な手法を包含しています。以下に、農業で一般的に用いられるリモートセンシングの種類をいくつか紹介します。

1. 光学的センシング: 光学センサーは、電磁スペクトルの可視光、近赤外線(NIR)、熱赤外線(TIR)領域の電磁波を捉えます。これらは、作物の健康状態、植生指数、土地被覆に関する貴重な情報を提供します。光学センシングデータは、一般的に衛星画像や航空写真によって取得されます。.

2. マルチスペクトルセンシング: マルチスペクトルセンサーは、電磁スペクトル内の複数の離散的な帯域でデータを取得します。これにより、植生の状態や作物のモニタリングに関連する特定の波長を分析することが可能になります。マルチスペクトルデータは、作物の状態を評価するために、NDVI(正規化植生指数)やEVI(強化植生指数)などの植生指数を計算する際によく使用されます。.

3. ハイパースペクトルセンシング: ハイパースペクトルセンサーは、電磁スペクトル全体にわたる数百もの狭く連続したスペクトル帯域でデータを取得します。この高いスペクトル分解能により、特定の物質や植物の特徴を詳細に分析・識別することが可能です。ハイパースペクトルデータは、病害検出、栄養状態の評価、作物の詳細な分類などに非常に役立ちます。.

4. 温度感知: 熱センサーは、電磁スペクトルのTIR領域でデータを取得します。作物や土壌などの物体から放出される放射線を測定し、その放射線は物体の温度と関連しています。熱センシングは、水分ストレスの評価、灌漑効率の検出、温度変化に基づく作物の健康状態のモニタリングに役立ちます。.

5. レーダー探知: レーダーセンサーはマイクロ波放射を利用して雲、植生、土壌を透過するため、天候に関係なくデータを取得できます。レーダーセンサーは後方散乱信号を測定し、作物の構造や水分含有量、地形に関する情報を提供します。レーダーデータは、地形図の作成、土壌水分のモニタリング、作物の生育段階の評価に役立ちます。.

6. LiDARセンシングLiDAR(光検出・測距)センサーはレーザーパルスを発射し、反射光が戻ってくるまでの時間を測定します。LiDARデータは、作物の高さ、樹冠構造、地形の標高に関する高精度な三次元情報を提供します。作物の高さ推定、地形モデリング、樹冠特性評価など、精密農業の様々な用途に役立ちます。.

7.無人航空機(UAV)RGBカメラ、マルチスペクトルセンサー、サーマルセンサーなど、さまざまなセンサーを搭載した無人航空機(UAV)は、局所的な規模で高解像度かつ柔軟なデータ収集を可能にします。UAVは、作物のモニタリング、病害の検出、精密農業の実践に、詳細かつタイムリーな情報を提供します。.

これらの異なるタイプのリモートセンシング技術は、互いに補完的なデータソースと機能を提供し、農業システムを包括的に理解することを可能にする。.

農家、農学者、研究者は、複数の情報源からのデータを統合・分析することで、作物の健康状態、生育状況、栄養状態、水管理、その他効果的な農業管理に貢献する重要な要素に関する知見を得ることができる。.

センサーの種類

様々な種類のセンサーが連携して、様々な規模の地上から多様な情報を収集するために利用されます。センサーは基本的に、その運用形態によって分類されます。衛星センサー、航空センサー、地上センサーなどがあります。.

これらのセンサーはさらに分類することができ、例えば地中センサーなどがあり、様々な構成で存在します。手持ち式の地中センサー、トラクターなどに搭載される車両搭載型の地中センサー、そして支柱や大きな木などに取り付けられる自立型の地中センサーなどがあります。.

地上設置型センサー これらは、土壌の栄養レベル、水分含有量、天候などを確認するためによく使用されます。これらを活用することで、肥料や灌漑に関する様々な変更を行い、高い収量を維持することができます。.

次のカテゴリーのセンサーは空中センサーです。ドローンの普及により、空中センサーは非常に手頃な価格で入手しやすくなりました。.

これら 空中センサー 作物の上空を低高度で長時間飛行することで、高解像度の土地写真を撮影できるだけでなく、その他のセンサーデータも収集できる。. これらのセンサーを通して収集されたデータは、雑草の検出、収量の推定、土壌の塩分濃度やクロロフィル含有量の測定といった詳細な分析に役立ちます。.

入手しやすく手頃な価格になったとはいえ、強風や曇天時には作動しなくなるという欠点があり、それが利用上のデメリットとなっている。.

イメージング用のセンサープラットフォームの中で最も遠いのは 衛星センサー. 従来、衛星を用いたあらゆる種類の画像撮影は、政府や軍隊によって行われてきた。農業分野で衛星画像を利用することで、広大な土地をカバーし、作物の生育状況を確認するのに役立つ。.

自然災害発生後には、被害額の算出や作物の収穫量の推定に役立ちます。衛星センサーデータの利用には多くの利点がありますが、多くの注意点もあります。まず、費用が高額であること、そして費用を考慮しないとしても、通常は数か月前に特定の期間の画像データをリクエストする必要があることです。.

指定された時間帯に指定された地域が雲に覆われていた場合、これまでの努力はすべて無駄になってしまう可能性があります。世界各国の政府は衛星画像を一般公開し始めており、将来的にはこのプロセスがはるかに容易になるかもしれません。.

センサーの動作

センサーは作物畑の色を識別することで、植物の健康状態を推測するのに役立つ情報を伝達します。センサーから得られる精密なデータを通して植物の色を観察することで、植物のクロロフィルレベルを測定することができ、農家はそれによって栄養不足や植物の健康上の問題を判断することができます。.

単純なデータは一般的なカラーセンサーで抽出できるが、複雑な情報を取得するには赤外線センサーや短波長センサーが使用される。.

農業におけるセンサーの働き

葉の内部が損傷している場合、葉からの光の反射は赤外線スペクトルで変化し、これは水分含有量が不足しているかどうかを示す指標にもなります。農業リモートセンシングにおいて最も信頼性の高いモデルの一つは、正規化植生指数(NDVI)として知られています。.

赤外線センサーとレッドエッジセンサーを使用することで、NDVIモデルは被害を受けた作物を容易に特定でき、農家は作物を救うための効果的な対策を講じるためのより多くの時間を確保できる。.

これらのセンサーは、土壌の健康状態をチェックしたり、土壌の塩分濃度を測定したりするためにも利用できます。過剰な塩分を含む土壌は赤外線領域で明るく見える傾向があるため、より多くの水やりや処理が必要な土壌を特定するのに役立ちます。.

熱センサーを利用することで、灌漑システムの最適化に役立ちます。あらゆる発生源から放出される熱は、赤外線領域において明るい色調として表示されます。.

灌漑後、農家は長周波赤外線(LWIR)センサーを搭載した航空機を畑に送り込み、水供給システムの不備によって熱が放射されている地域を確認することで、灌漑システムの問題点を修正することができる。.

衛星センサーは、幅広い用途に対応できます。気候条件の影響を受けにくいため、園芸観測に最適です。レーダーセンサーやマイクロ波センサーに加え、衛星からのGPSは正確な位置情報を提供し、これは自動運転農業機械や自動運転農業車両といった新しい農業技術革新に不可欠です。.

農業におけるリモートセンシングとGISの役割と利点

リモートセンシングは、作物管理の改善、生産性の向上、持続可能な農業慣行に貢献する貴重な情報と知見を提供することで、農業において重要な役割を果たしています。以下に、農業におけるリモートセンシングの重要性を示す主な例をいくつか挙げます。

作物の作付面積推定

園芸におけるリモートセンシングの重要な用途の一つは、作物の播種地域の評価です。航空機や衛星センサーからのデータは、植栽地域の正確な分析を提供し、災害や大惨事が発生した場合のリスク評価に役立ちます。.

農業におけるリモートセンシングとGISの役割と利点

作物の健康状態評価

このシステムにより、農家や農学者は広範囲にわたる作物の健康状態や生育状況を監視できます。衛星画像や航空画像を分析することで、ストレス、栄養不足、病害の発生、害虫の蔓延といった初期兆候を検知することが可能です。この早期警戒システムによって、タイムリーな介入と的を絞った治療が可能になり、作物の損失を減らし、資源配分を最適化できます。.

収益推定と予測

このデータは、統計モデルと組み合わせることで、作物の収穫量を推定・予測するのに役立ちます。植生指数を分析し、樹冠被覆率やバイオマスなどの要素を監視することで、農家は収穫量の変動を予測し、収穫、貯蔵、販売に関して情報に基づいた意思決定を行うことができます。.

作物の病害識別

農業におけるGISリモートセンシングは、広大な地域にわたる作物の汚染や害虫被害を初期段階で容易に特定することを可能にします。これにより、生産者は収穫物を甚大な損失から守るための対策を講じる十分な機会を得ることができます。これは衛星画像と分析によって実現されます。.

土壌特性

おそらく、健全な収穫量を確保する上で最も重要な要素は、土壌の適切なサポートです。それは収穫に直接影響します。 農場経営 あるいは、農業システムが土壌の変化を引き起こし、それが土壌の生産能力に影響を与える。.

例えば、土壌の塩分濃度、pH値、有機物レベル、土壌の質感といった特性は、リモートセンシングによって認識することができ、そのデータを分析することで、重要な土壌処理を実施することができる。.

土壌水分マッピングは、土壌中の水分量を正確に評価することができ、灌漑システムの構造改良を行う際に役立ちます。.

灌漑管理

水は農業において極めて重要な資源であり、その利用を最適化する上で重要な役割を果たします。植物の水分量と蒸発散量を評価することで、農家は作物の正確な水分必要量を把握することができます。.

この情報により、効率的な灌漑戦略を実施し、水の無駄を削減し、作物が最適な生育に必要な十分な水分を確実に得られるようにすることができる。.

洪水の影響

衛星搭載センサーと地上センサーで収集されたデータを組み合わせることで、正確な損害評価を行うための膨大な量の確実な情報を提供することができる。.

過剰な降雨による洪水が発生した場合、排水設備が不十分な土地は浸水のリスクにさらされ、収穫物や収量の大幅な損失につながる。.

損失評価は、損害を最小限に抑えるための損害抑制策や対策の計画策定に役立ちます。.

NATCATモデリング

農業におけるリモートセンシングは、自然災害の危険性を評価し、予測するのに役立ちます。センサーから伝達される情報と、通常の危険の挙動を利用します。.

Tこれには、リスクマッピングと、PCシミュレーションによる災害モデルを用いてハザードを推定することによるハザードの計算が必要となる。.

過去の情報と様々なセンサーから収集された現在の情報を活用して作成されたリモートセンシングマップは、洪水発生の可能性が高い地域に高い危険度を割り当てるのに役立ちます。.

これは農業にとって有益であり、リスク評価の高い地域では作付けを行わず、翌シーズンの洪水対策を強化するための処理を行う。.

ドローン画像解析による農作物被害評価

ドローン画像解析は、雹害による作物被害の評価、樹木の計数、外来種の侵入などに利用されています。ドローン画像の精度は入力空間解像度に依存し、必要に応じて解像度を上げることができます。.

栄養管理

これは、栄養不足の評価や施肥方法の管理に役立ちます。分光反射パターンを分析することで、農家は圃場内の栄養レベルが異なる領域を特定できます。.

これにより、肥料を的確に散布することが可能になり、過剰使用や環境汚染の可能性を最小限に抑えつつ、作物の栄養吸収と生産性を最大限に高めることができます。.

環境影響評価

これは、農業活動が環境に与える影響を評価する手段を提供する。土壌浸食の監視、保全対策の効果評価、過剰な肥料流出や農薬飛散といった潜在的な汚染地域の特定に役立つ。.

この情報は、持続可能な農業慣行の実施を支援し、環境への悪影響を最小限に抑え、長期的な農業の持続可能性を促進するものです。.

リモートセンシング技術の力を活用することで、農家や農業専門家はより的確な意思決定を行い、資源配分を最適化し、持続可能な農業慣行を実施できるようになります。これにより、生産性の向上、環境負荷の低減、食料安全保障の強化が実現し、最終的には農家と消費者の双方に利益をもたらします。.

農業における雲と影の検出

Cloud and Shadow detection is one of the most important tasks in analytical remote sensing solutions.

If the whole satellite image is 90% clean, there is still a 10% chance that your field will be under clouds/shadows area. The reverse is also true – many systems do not process images with clouds above 70% – although the remaining 30% can help the agronomist or farmer to make the right decision during the season.

At GeoPard, we solve this problem with the help of several machine learning algorithms that work with very high accuracy.

The determination of clouds and cloud shadows


We define a cloud mask and a shadow mask at the level of the whole image, and for each field-image pair, we consider what percentage of the field is covered by clouds or shadows from the clouds.

In automatic analytics, we take only completely cloudless images for a specific field, which allows the user to be confident in making decisions based on multi-year analytics.

The GeoPard user has the opportunity to view and even run the analytics himself, even on partially cloudy images.

define a cloud mask and a shadow mask


This can still be very useful, for example, during the season to apply Variable Rate spraying with crop protection products based on the latest satellite image, in which 10% of the field’s area is under the clouds. This means that for 90% of the field’s area, the decision will be based on verified data.

Also, users of GeoPard can easily check source images on a regional level in Near-Infrared view, which helps to distinguish clear land from clouds and shadows (see picture attached).

On UI cloud filter is located in the top menu of “Satellite monitoring” module, see screenshots attached.

geopard detected that field is partially located under clouds and shadows


Keep in mind that digital ag companies can still struggle with the correct detection of clouds and shadows. In the attached screenshot one such a company creates VR fertilizer map based on clouds and shadows data. So the wrong map leads to wrong agronomic decisions and wrong outcomes in the end.

GeoPard detects clouds and shadows with a high level of accuracy and doesn’t propose to make your Variable Rate decision based on clouds. You can always look at the source images in different views and indices and zoom out to see the picture around.

created VR fertilizer map based on clouds and shadows data


Not every solution is the same, choose the best options available on the market!


different spectral indices

What is Cloud Detection in Precision Agriculture?

Cloud detection in precision agriculture refers to the process of identifying and monitoring cloud cover in agricultural areas using remote sensing technologies. Clouds can significantly impact agricultural practices and crop productivity, making their detection and analysis crucial for effective farm management.

It involves the use of various sensors, such as satellites, drones, or ground-based instruments, to capture imagery of agricultural fields. These sensors capture data in the form of visible and infrared light, which can be analyzed to determine cloud presence and characteristics.

Its primary purpose in precision agriculture is to assess the spatial and temporal distribution of clouds over agricultural areas.

This information helps farmers and agronomists make informed decisions regarding irrigation, fertilization, pest control, and other farming practices. By understanding cloud cover patterns, farmers can optimize resource allocation and minimize the risk of crop damage or yield reduction.

Cloud detection algorithms analyze the captured imagery to differentiate between cloud pixels and non-cloud pixels.

These algorithms utilize various techniques, such as thresholding, spectral analysis, and machine learning, to identify and classify cloud formations accurately.

The output of algorithms typically includes cloud coverage percentage, cloud type classification, and cloud movement patterns.

Once clouds are detected and their characteristics are determined, farmers can utilize this information to implement precision agriculture techniques.

For example, if a cloud is detected over a specific area of a field, farmers may delay irrigation or pesticide application in that region until the cloud passes. By synchronizing agricultural activities with cloud movements, farmers can optimize resource utilization and minimize unnecessary inputs.

It is particularly beneficial in regions with high cloud cover or where weather patterns change rapidly. By continuously monitoring cloud cover, farmers can adapt their farming practices in real-time, making adjustments based on current weather conditions.

In summary, cloud detection in precision agriculture plays a crucial role in optimizing farming practices and resource management. By accurately identifying and monitoring cloud cover, farmers can make informed decisions to enhance crop productivity, reduce input wastage, and mitigate the risks associated with changing weather conditions.

Raster Analytics

Satellite imagery resolution may vary and the most popular free providers have 10m (Sentinel2) and 30m (Landsat). From time to time such quality is not enough.

Therefore, the GeoPard team adjusts comprehensive scientific algorithms (e.g. also used in medical diagnostic) for agricultural fields to improve the quality of GeoPard raster and vector analytics.

It helps to increase the accuracy of the GeoPard maps to 3-10 times comparing to the original resolution of a source satellite image. For example, the spatial resolution of the GeoPard management zones map is ~3m.

If you are a crop grower or ag consultant, start to utilize https://geopard.tech/ cutting edge analytics for your fields for an affordable price.

If you are a service provider, integrate https://geopard.tech/ analytics via API into your platform and start to give value to your customers right away.

How to read NDVI imagery?

Reading NDVI imagery involves a few key steps. First, understand that NDVI measures the health and vigor of vegetation. High NDVI values indicate healthy and dense vegetation, while low values suggest stressed or sparse vegetation.

To interpret NDVI imagery, compare the color scale provided with the image, where green or dark green represents healthy vegetation, and yellow or red indicates stressed or non-vegetated areas.

By analyzing the patterns and variations in NDVI values across an area, you can gain insights into the health and distribution of vegetation, helping with tasks like crop monitoring and land management.

ジオパード・アグリカルチャー

wpChatIcon
wpChatIcon

    無料GeoPardデモ・コンサルテーションをリクエスト


    ボタンをクリックすると、弊社の プライバシーポリシー. そのリクエストに返信するために必要です。.

      登録


      ボタンをクリックすると、弊社の プライバシーポリシー

        情報をお送りください


        ボタンをクリックすると、弊社の プライバシーポリシー