
Precision agriculture is capable of generating vast amounts of data in the form of yield data, satellite imagery, and soil fertility, among others.
The lack of easy-to-use cloud precision software toolkits that assist crop producers in converting field data layers into useful knowledge and actionable recommendations limits the application of precision agricultural technologies.
In precision agriculture, management zones are areas within a field that have similar yield potential based on soil type, slope position, soil chemistry, microclimate, and/or other factors that influence crop production.
Сайт producer’s knowledge of a field is a very important piece of the process. Management zones are thought of as a mechanism to optimize crop inputs and yield potential.


Maps generated with a single data layer and several data layers.
The big challenge is to build management zones that perfectly reflect field variability. A combination of different layers like satellite imagery, soil fertility, topography derivatives, and yield monitor data is the next logical step to generating more responsive management zones.
Multi layer analytics (also known as integrated analysis) is becoming a part of the GeoPard geospatial analytics engine.
Classic combinations of integrated analysis parameters include one or more yield data, NDVI map, elevation, and soil sensor physicochemical characteristics.
GeoPard supports these parameters and in addition, allows the inclusion of other field data layers either already available in the system or uploaded directly by the user (soil sampling, yield datasets, etc.).
As a result, you are free to operate with the complete set of parameters doing integrated analytics:
Multi layer yield data analytics
Данные дистанционного зондирования:
- Potential productivity map (single-year and multi-year)
- Stability/variation map
- Vegetation indices NDVI, EVI2, WDRVI, LAI, SAVI, OSAVI, GCI, GNDVI
Topography:
- Digital elevation
- Slope
- Curvature
- Wetness index
- Hillshades
Soil data:
- pH
- CEC (cation exchange capacity)
- SOM (soil organic matter)
- K (potassium)
- Thin topsoil depth, lower available water holding capacity (drought-prone soil)
- EC (electrical conductivity)
- and other chemical attributes available in the uploaded dataset
It’s important to emphasize that custom factors are configured on top of every data layer to assign the desired layer weight. You are very welcome to share your integrated analytics use cases, and build management zone maps based on your knowledge of the field while selecting data sources and their weights in GeoPard.
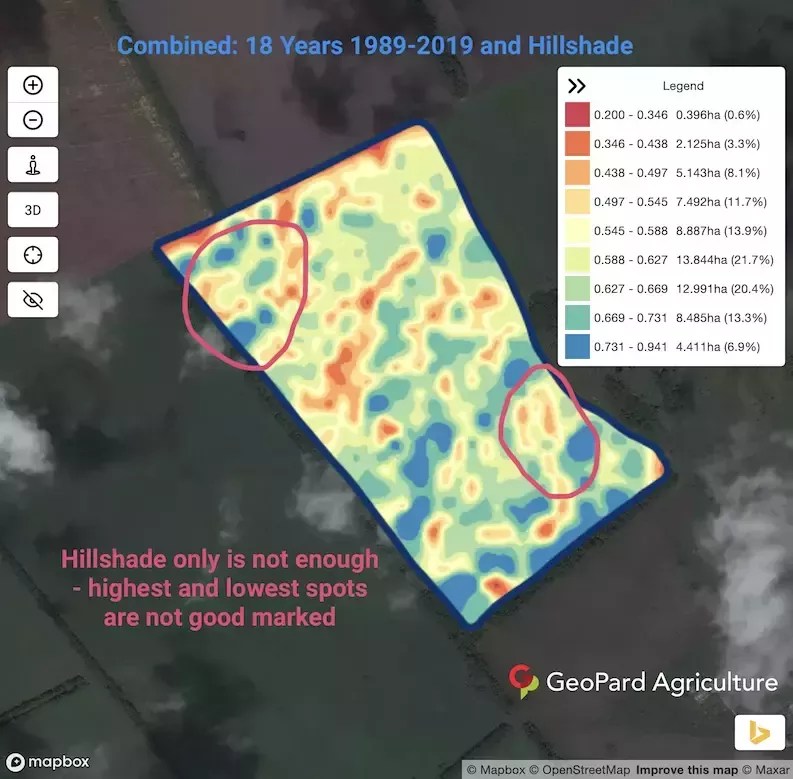
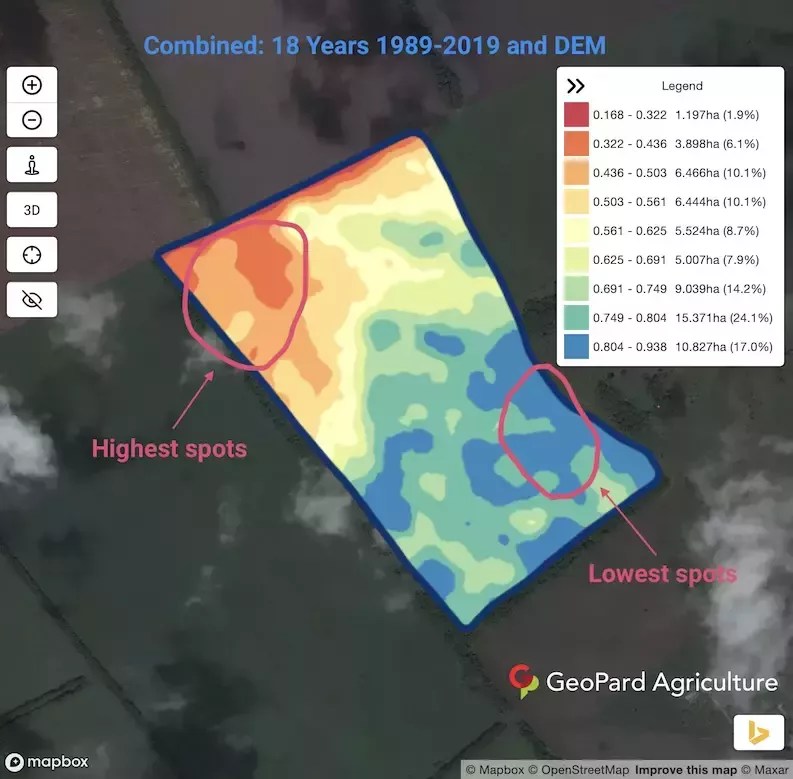
Pictures in this blog contain a sample field with data layers (like a productivity map covering 18 years, digital elevation model, slope, hillshade, 2019 yield data) and various combinations of integration analytics maps.
You can follow the steps of the evolution of management zones while extending integration analytics with an additional data layer.
Часто задаваемые вопросы
1. What is data layers?
Data layers refer to the individual components or elements of data that are organized and stacked together to create a comprehensive representation of a specific area or subject.
Each layer represents a specific aspect of the data, such as geographical features, land use, population density, or environmental factors. These layers can be combined and analyzed collectively to gain insights, visualize patterns, and make informed decisions.
Data layers are commonly used in geographic information systems (GIS) and spatial analysis to better understand and represent complex data in a visual and interpretable manner.
2. What is integrated analysis?
Integrated analysis refers to the process of combining and analyzing data from multiple sources or disciplines to gain a more comprehensive and holistic understanding of a particular problem or phenomenon.
It involves merging data sets, applying statistical techniques, and exploring relationships across different variables or domains.
Integrated analysis allows for a more nuanced and interconnected view of complex systems, facilitating the identification of patterns, trends, and causal relationships that may not be evident when analyzing data in isolation.
This approach enables researchers and decision-makers to make more informed and effective decisions based on a broader range of information.


