Ukrainian agricultural leader VitAgro implements GeoPard precision farming software for integrated farm management across 85,000 hectares

COLOGNE, GERMANY and KYIV, UKRAINE, July, 2025

VitAgro, one of Ukraine’s leading agricultural producers farming 85,000 hectares (210,000 acres), has implemented GeoPard precision agriculture software as an end-to-end decision support system for the entire growing season. The platform supports workflows from pre-season preparation, including planning and soil analytics, through in-field operations across the full vegetation period.

As a top-15 agricultural company in Ukraine, VitAgro integrated GeoPard into its operations to improve soil management, implement variable rate (VRA) fertilizer strategies, and quantify the financial impact of precision ag practices through data-driven field trials.

“GeoPard has transformed how fields are managed by turning complex data into practical, actionable recommendations. The platform helps build targeted soil sampling strategies that pinpoint specific field zones requiring attention, enabling zone-specific management instead of uniform application across entire fields.” said Oleh Bilan, Chief Technologist at VitAgro.

Карта потенціалу зон на основі глибоких історичних даних, які демонструють неоднорідність у межах поля

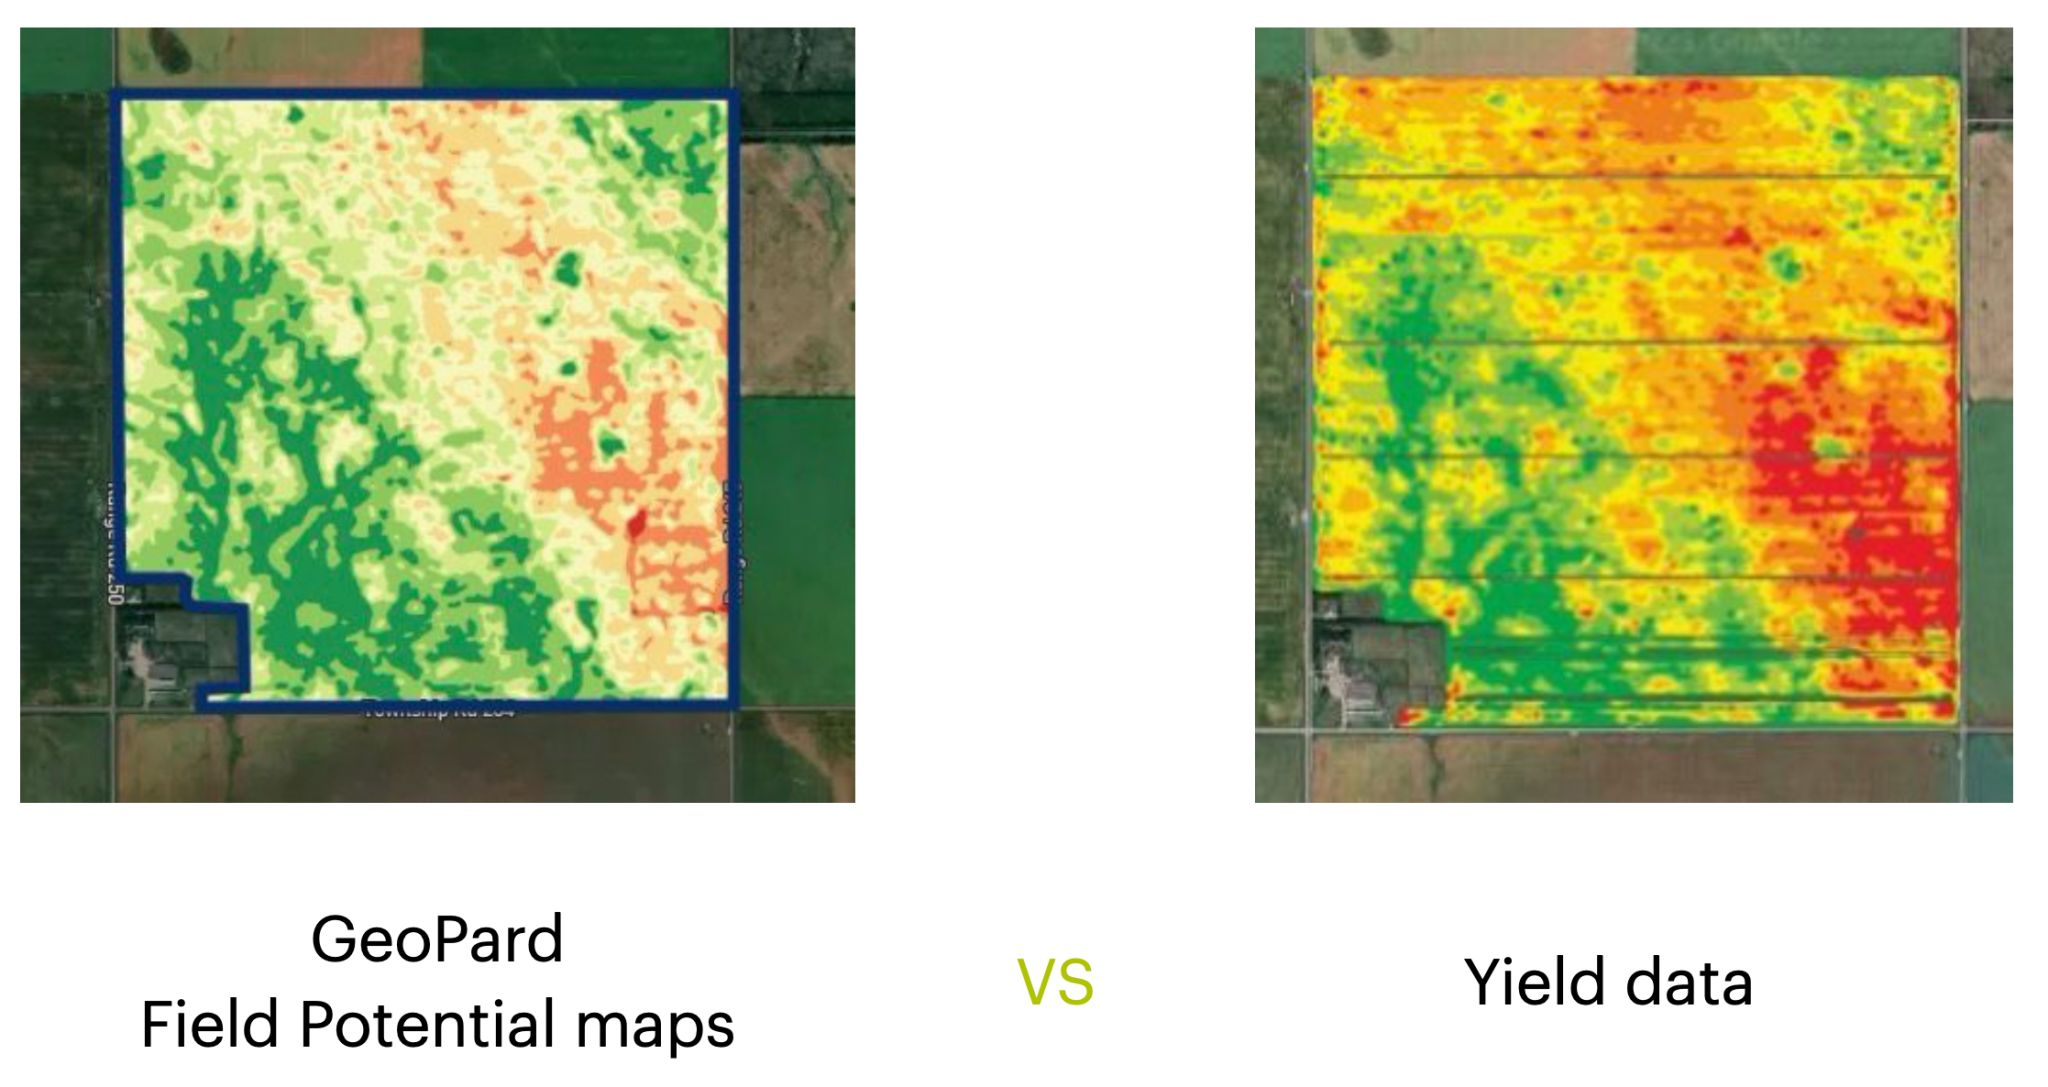
Field potential zoning map based on deep historical data, showing within-field variability

With GeoPard in place, VitAgro can systematically:

  • Create accurate soil sampling plans based on field variability
  • Generate zone-specific application maps for fertilizers and crop protection products
  • Monitor actual applied rates versus planned prescriptions
  • Calculate clear ROI metrics for precision ag initiatives
  • Make data-backed decisions for future yield and input management strategies

“GeoPard continues to be an important tool for crop producers in Ukraine,” said Dmitry Dementiev, CEO of GeoPard. “Precision agriculture is no longer optional for businesses planning for the future. It enables higher-quality grain production with optimized costs and more sustainable practices, strengthening food security.”

Implementation was supported in collaboration with Agrismart, an agricultural consulting company working with both VitAgro and GeoPard to align agronomic methodology and rollout across operations.

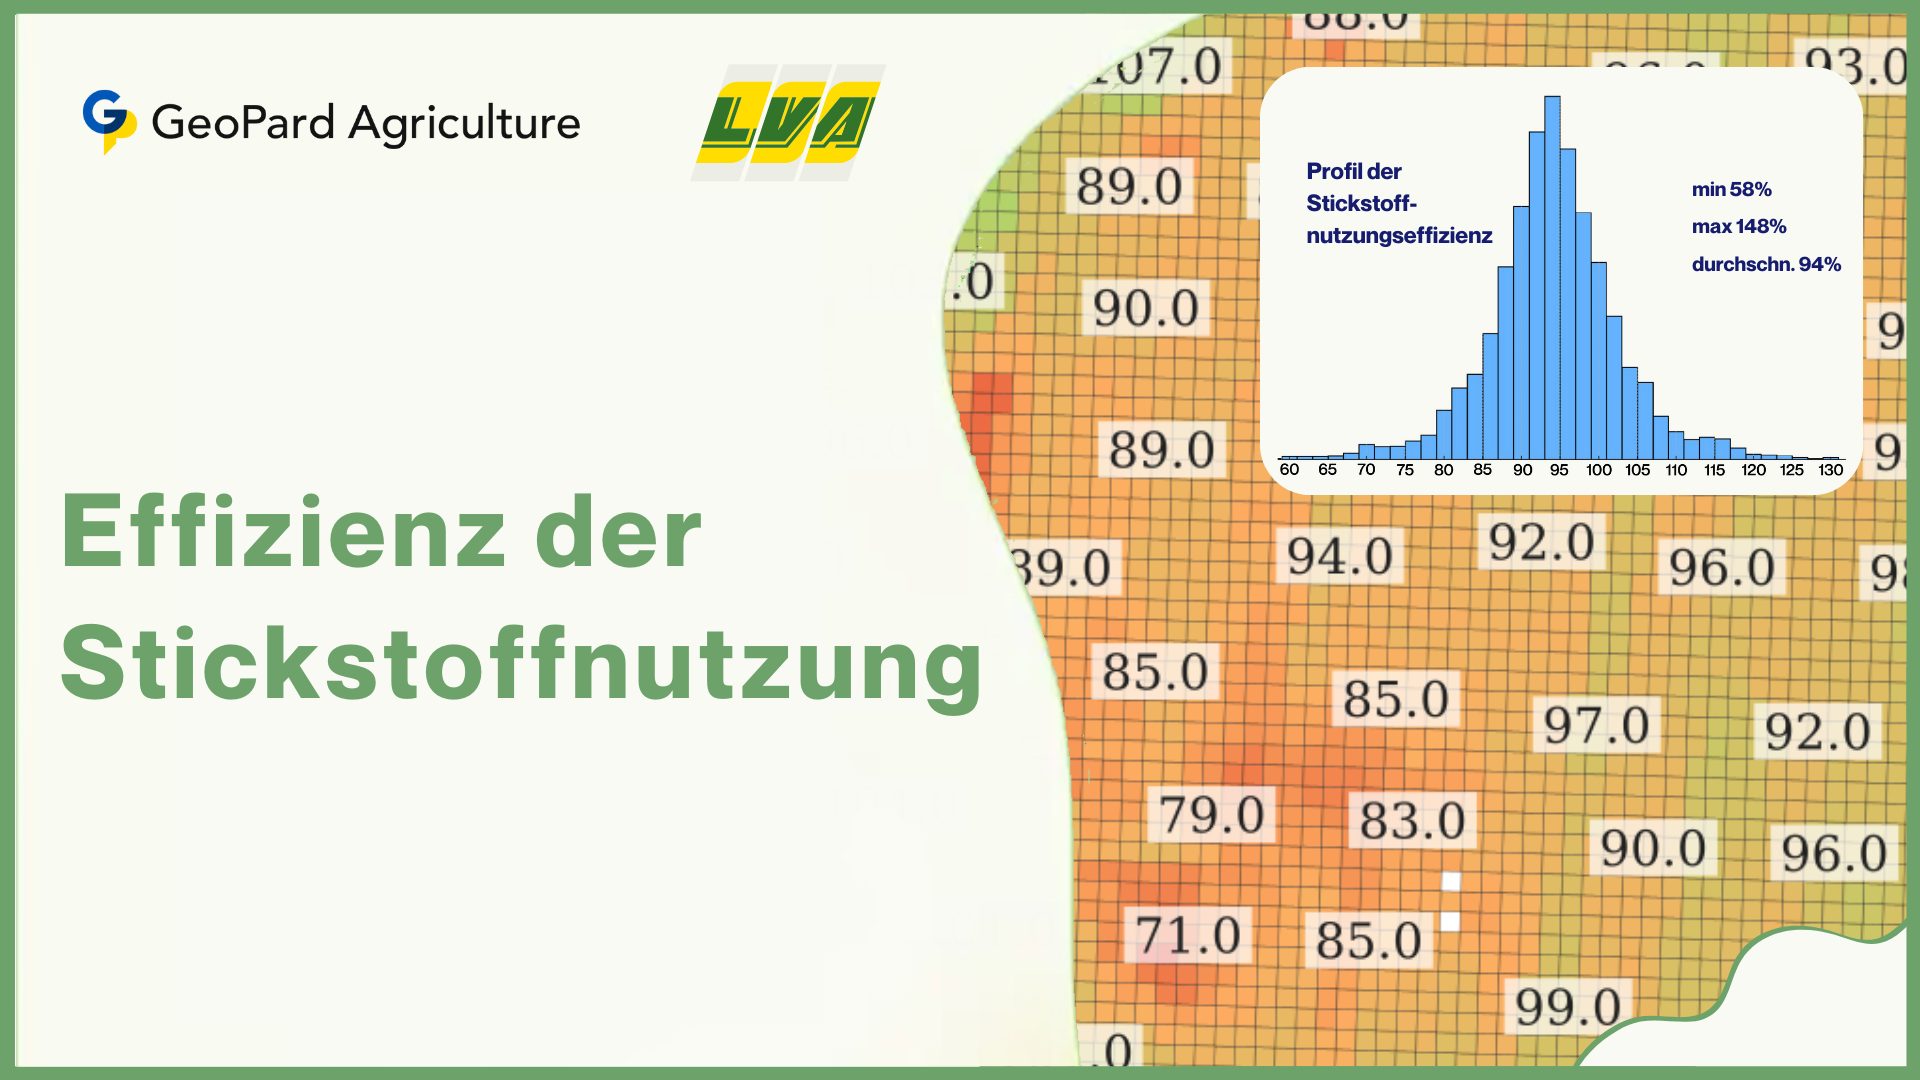
The partnership highlights how digital agronomy can improve productivity while supporting environmental responsibility. By building VRA recommendations from field potential zones, VitAgro applies inputs only where needed and at appropriate rates, reducing losses and environmental impact.

WHY MEASURE WITHIN-FIELD VARIABILITY

Productivity zones created in GeoPard make it easy to see performance differences within a single field, often driven by soil type variability. GeoPard automatically generates both management zones and sampling points for an agrochemical plan.

План відбору проб ґрунту, що показує точки відбору проб на основі зон поля

Soil sampling plan showing sampling points based on field zones

Відбор проб ґрунту на основі на основі рекомендацій GeoPard

Soil sampling based on GeoPard recommendations

SOIL SAMPLING AND ZONE-BASED RECOMMENDATIONS

VitAgro collects soil samples at the recommended points and sends them to laboratories. Based on multi-layer analytics and validated scientific formulas, the team then generates VRA maps for variable seeding and fertilizer application per zone.

After analyzing each zone, distinct agronomic indicators become visible, enabling more accurate and cost-effective input use that reflects real field heterogeneity.

Зоны продуктивности от GeoPard - При візуальному огляду  ділянок одного поля  з різними зонами в основі якого лежать різни Типи грунтів - Після проведення Аналізу в кожній зоні продуктивності отримуємо різні показники.

Productivity Zones from GeoPard – When visually inspecting sections of the same field with different zones based on different soil types – After conducting the analysis in each productivity zone, we obtain different indicators.

“Thanks to the wide range of options in GeoPard, which fully meets our needs, soil agrochemical work within our company has become much more efficient and the results are more accurate,” said Oleksandr Perederiy, Agrochemist at VitAgro. “Technology is moving fast, and it is important to keep up. Belief remains that the effort to move forward and improve, even in a difficult time for the country, will bring good results. Those who sow through hardship will later harvest with joy.” (Psalm 126:5-6)

INTEGRATION WITH JOHN DEERE OPS CENTER

An automated integration with John Deere Ops Center allows VitAgro to:

  • Build smart VRA recommendations in GeoPard using field potential maps, soil lab analytics, and equation-based calculations
  • Send prescriptions to John Deere as Work Plans, including different zone geometries for seeding and fertilizer application
  • Pull actual as-applied data back into GeoPard for seasonal performance analytics

After each field operation, data returns automatically to GeoPard, making it possible to evaluate execution accuracy and the effectiveness of each agronomic action.

PRACTICAL VARIABLE RATE EXECUTION IN THE FIELD

Field execution is supported through seamless equipment integration. Operators access GeoPard-generated prescription maps directly in the cab displays, enabling accurate implementation of agronomic plans.

VitAgro is also building its own soil sampling laboratory and plans to expand services by providing decision-support tools and fertilizer recommendations to other agricultural producers across Ukraine. This expansion is a meaningful step toward broader adoption of precision agriculture practices in the country.

Planning VRA rates using the Smart Doses tool, the system automatically allocates rates and immediately shows savings per product.

Вигляд із кабіни машини, де показано карту VRA, що відображається на моніторі. Розкидач: Amazone ZA-TS 4200. Розкидач, яким проводилось диференційоване внесення.

In-cab view of a VRA map on the display. Spreader: Amazone ZA-TS 4200, used for variable rate application.

INTEGRATION IMPACT

According to preliminary estimates, the integrated digital management model enables VitAgro to achieve already in the 2025 season:

  • 15-25% reduction in mineral fertilizer costs
  • 5-8% yield increase in key crops
  • Reduced carbon footprint of operations

The resulting data will serve as a foundation for scaling precision agriculture practices across all acreage and strengthening VitAgro’s internal expertise.

ABOUT THE COMPANIES

VitAgro is one of Ukraine’s leading agricultural producers, farming 85,000 hectares (210,000 acres). As a top-15 producer in Ukraine, VitAgro focuses on sustainable farming practices, technology innovation, and operational efficiency. The company grows a range of crops, including grains and oilseeds, combining productivity goals with environmental responsibility. In February 2025, VitAgro also completed the first export of Ukrainian biomethane to the EU, delivering a batch of 68,000 m³ (720 MWh) to Germany, becoming the first supplier of biomethane from Ukraine to the European market. vitagro.com.ua

GeoPard provides advanced precision agriculture software designed to optimize farm management and agricultural operations. The platform integrates soil data, satellite imagery, machine data, and agronomic expertise to deliver actionable recommendations for farmers and agribusinesses. geopard.tech

Український аграрний лідер Вітагро впроваджує програмне забезпечення точного землеробства GeoPard для комплексного управління фермою

Кельн, Німеччина, Київ, Україна – 22 липня 2025 рокуВітагро, одне з провідних сільськогосподарських підприємств України, яке обробляє 85 000 гектарів (210 000 акрів), впровадило програмне забезпечення точного землеробства GeoPard як комплексну систему підтримки прийняття рішень для всіх етапів аграрного сезону – від підготовки до сезону, включаючи планування та аналіз ґрунтів, до безпосередньо польових робіт протягом усього вегетаційного періоду.​

VitAgro входить до топ-15 в Україні, інтегрував технологію GeoPard у свої операції для оптимізації управління ґрунтами, впровадження диференційованого внесення добрив та кількісної оцінки фінансових переваг практик точного землеробства через обґрунтовані даними польові випробування.​

“GeoPard трансформував наш підхід до управління полями, надаючи практичні рекомендації на основі всебічного аналізу даних”, – сказав Білан Олег Миколайович, Головний технолог компанії. “Платформа дозволяє нам створювати цільові стратегії відбору проб ґрунту, які визначають конкретні зони поля, що потребують уваги, що дозволяє здійснювати індивідуальну обробку, а не рівномірне застосування на всіх полях”.​

Карта потенціалу зон на основі глибоких історичних даних, які демонструють неоднорідність у межах поля

Карта потенціалу зон на основі глибоких історичних даних, які демонструють неоднорідність у межах поля

Впровадження дозволило Вітагро систематично:​

  • Розробляти точні плани відбору проб ґрунту на основі варіабельності полів​
  • Генерувати зонально-специфічні карти внесення добрив та засобів захисту рослин​
  • Моніторити фактичні норми внесення у порівнянні з плановими призначеннями​
  • Розраховувати точні показники рентабельності для ініціатив точного землеробства​
  • Приймати обґрунтовані даними рішення для майбутніх стратегій управління врожаями​

“GeoPard продовжує бути важливим для виробників сільськогосподарських культур в Україні”, – сказав Дмитро Дементьєв, генеральний директор GeoPard. “Впровадження точного землеробства є необхідністю для будь-якого бізнесу, який дивиться в майбутнє, виробляючи не лише більше, але й якісні зернові з оптимізованими витратами та сталими практиками, забезпечуючи продовольчу безпеку”.​

Партнерство демонструє, як цифрові аграрні рішення можуть підвищити продуктивність, одночасно сприяючи екологічній відповідальності. Створюючи карти диференційованого внесення на основі потенційних зон поля, Вітагро застосовує ресурси лише там, де це необхідно, та у відповідних нормах, зменшуючи втрати та вплив на навколишнє середовище.​

Чому визначаємо неоднорідність? 

Зони продуктивності, створені за допомогою GeoPard, дозволяють візуально оцінити відмінності в межах одного поля, що зумовлені різними типами ґрунтів. GeoPard автоматично формує зони та точки для агрохімічного плану. 

План відбору проб ґрунту, що показує точки відбору проб на основі зон поля

План відбору проб ґрунту, що показує точки відбору проб на основі зон поля

Відбор проб ґрунту на основі на основі рекомендацій GeoPard

Відбор проб ґрунту на основі на основі рекомендацій GeoPard

Відбір ґрунтових зразків

Vitagro здійснює відбір ґрунтових зразків у цих точках, передає їх до лабораторій, а далі ‒ на основі багатошарового аналізу та валідованих наукових формул ‒ формує VRA-карти для диференційованого висіву насіння й внесення добрив у кожній зоні. Після детального аналізу кожної зони виявляються специфічні показники, що дозволяють точніше й економніше застосовувати ресурси, враховуючи неоднорідність полів.

Зоны продуктивности от GeoPard - При візуальному огляду  ділянок одного поля  з різними зонами в основі якого лежать різни Типи грунтів - Після проведення Аналізу в кожній зоні продуктивності отримуємо різні показники.

Зоны продуктивности от GeoPard – При візуальному огляду  ділянок одного поля  з різними зонами в основі якого лежать різни Типи грунтів – Після проведення Аналізу в кожній зоні продуктивності отримуємо різні показники.

“Завдяки широкій опційності програми Geopard, що цілком задовольняє наші потреби, ми маємо можливість працювати у сфері агрохімічного дослідження ґрунту нашої компанії набагато ефективніше та досягати кращих та більш точних результатів. Це обумовлено нашим бажанням йти в ногу з часом,який швидко йде,і технології лише пришвидшують цей незворотний процес. Віримо, що наші зусилля та зусилля тих, хто не залишився байдужим в такий не легкий для країни час, жити мирно, рухатися вперед, розвиватися та вдосконалюватися у сфері дослідження ґрунту при переведенні холдингу на повну диференціацію, принесуть добрі плоди. “Ті, що сіють зі сльозами, пожнуть з радістю. Хто з плачем ніс сіяти зерно своє, той повернеться веселий, несучи снопи свої.” (Псалом 126:5-6)” – Олександр Передерій, Агрохімік VitAgro

Інтеграція з John Deere Ops Center

Автоматизована інтеграція з John Deere Ops Center дає змогу Vitagro створювати в GeoPard розумні VRA-рекомендації (на основі карт потенціалу поля, агрохімічного аналізу та розрахункових рівнянь), надсилати їх до John Deere як WorkPlan із різними геометріями зон для посіву та внесення добрив, а також підтягувати фактичні карти для сезонної аналітики продуктивності. Після завершення кожної операції дані автоматично повертаються до GeoPard, що дозволяє оцінити точність виконання та ефективність кожної агротехнічної дії.

Практична реалізація VRA в полі

Практична реалізація в полі забезпечується через безперебійну інтеграцію з фермерським обладнанням. Оператори отримують доступ до призначених GeoPard карт безпосередньо в кабінах своїх машин, що дозволяє точно виконувати агрономічні плани.​

Примітно, що Вітагро наразі будує власну лабораторію для відбору проб ґрунту та планує розширити свої послуги, надаючи інструменти підтримки прийняття рішень та рекомендації щодо добрив іншим сільськогосподарським виробникам по всій Україні. Це розширення є значним кроком до більш широкого впровадження практик точного землеробства в аграрному секторі країни.​

Планування диференційованих норм (VRA) через інструмент Smart Дози: система автоматично розподіляє норми та відразу показує економію для кожного продукту.

Вигляд із кабіни машини, де показано карту VRA, що відображається на моніторі. Розкидач: Amazone ZA-TS 4200. Розкидач, яким проводилось диференційоване внесення.

Вигляд із кабіни машини, де показано карту VRA, що відображається на моніторі. Розкидач: Amazone ZA-TS 4200. Розкидач, яким проводилось диференційоване внесення.

Таким чином, за попередніми розрахунками, інтегрована цифрова модель управління дозволяє «Вітагро» вже у сезоні-2025 скоротити витрати на мінеральні добрива на 15–25%, підвищити врожайність основних культур на 5-8% та зменшити вуглецевий слід господарства. Отримані дані стануть базою для подальшого масштабування практик точного землеробства на всі площі та зміцнення внутрішньої експертизи компанії.

Про компанії:

ВітAгро – одне з провідних сільськогосподарських підприємств України, яке обробляє 85 000 гектарів (210 000 акрів) сільськогосподарських угідь. Як виробник, що входить до топ-15 у країні, Вітагро зосереджується на сталих сільськогосподарських практиках, технологічних інноваціях та операційній ефективності. Компанія виробляє різноманітні культури, включаючи зернові, олійні та інші сільськогосподарські товари, впроваджуючи передові методи ведення сільського господарства для забезпечення як продуктивності, так і екологічної відповідальності. У лютому 2025 року Вітагро також здійснила перший експорт українського біометану до ЄС (партія 68 000 м³ / 720 МВт·год до Німеччини), ставши першим постачальником біометану на європейський ринок. ​vitagro.com.ua

GeoPard – постачальник передових програмних рішень для точного землеробства, призначених для оптимізації управління фермерськими господарствами та сільськогосподарськими операціями. Платформа компанії інтегрує дані про ґрунт, супутникові зображення, дані машин та агрономічний досвід, щоб надавати практичні рекомендації для фермерів. geopard.tech

5G-Enabled Real-time Learning in Sustainable Farming: A Study on Sugar Beet

We are excited to announce the successful completion of the “5G Networks as an Enabler for Real-time Learning in Sustainable Farming” project, supported by partial funding from the Ministry of Economic Affairs, Industry, Climate Action, and Energy of the State of North Rhine-Westphalia.

This initiative represents a significant step forward in exploring the transformative potential of 5G technology in agriculture, specifically aimed at enhancing the ecological, economic, and sustainable aspects of sugar beet cultivation.

It leveraged the low latency of 5G to integrate advanced information technology systems in real-time, enabling immediate responses to sensor and positional data within predefined timeframes.

Picture from the final event of the project presentation at Hochschule Hamm-Lippstadt (HSHL)

Project Focus and Partnership

In collaboration with partners at HSHL and with the support of Pfeifer & Langen, the project focused on studying the entire lifecycle of sugar beet cultivation in fields belonging to the partners. It aimed to demonstrate how 5G could serve as a pivotal technology catalyst within North Rhine-Westphalia’s agricultural sector, showcasing its potential as an enabler for innovation and efficiency.

Role of GeoPard Agriculture

GeoPard Agriculture played a crucial role in defining and implementing key aspects of the project, including scenarios for plant detection, monitoring, and production prediction. We developed a prototype AI system tailored for the 5G agricultural environment, executed models within a cloud infrastructure, and created a mobile application for real-time interaction with cloud-based models.

Technological Integration

Artificial intelligence (AI) methods were deployed via a robust cloud infrastructure with high computing capabilities. AI algorithms categorized plants in real-time during each crossing and monitored their growth throughout their entire lifecycle, eliminating the need for unnecessary field visits solely for data collection purposes.

This advancement enabled the precise application of fertilizers and crop protection products, dynamically adjusting application rates during crossings through machine learning algorithms.

Deployment of Unmanned Vehicles

Furthermore, the project utilized the reduced latency of 5G to deploy unmanned vehicles for plant monitoring and data collection. These vehicles played a crucial role in gathering real-time insights, and further optimizing agricultural practices.

Project Outcomes: Enhancing Sugar Beet Production with 5G Technology

The project demonstrated how 5G technology could serve as a transformative enabler in North Rhine-Westphalia’s agricultural sector by analyzing the entire lifecycle of sugar beet cultivation, highlighting substantial improvements facilitated by 5G technology. However, to efficiently demonstrate the project outcomes, the researchers have used work packages containing different scenarios and infrastructures.

Sugar beet test field

Scenario Definition Considering Existing Geodata and ML Infrastructure

The project demonstrated how traditional processes within the sugar beet production lifecycle could be enhanced through the integration of 5G technology. Key objectives included:

  • Developed ready-to-implement scenarios for plant recognition, monitoring, and production prediction.
  • Established technical requirements necessary for the successful deployment of these scenarios.
  • Identified and assessed relevant ecological and economic indicators to evaluate the added value brought by the 5G network.

This phase underscored the project’s commitment to integrating cutting-edge technology with existing agricultural practices. This architecture leveraged the high-speed connectivity of the 5G network to facilitate real-time data collection and processing between edge devices and the cloud. The cloud infrastructure provided essential resources for training and deploying large-scale AI models, while the AI platform offered robust tools for model development and deployment. The application layer presented actionable insights derived from AI models to end-users, enhancing decision-making capabilities.

Machine Learning and AI in the Context of 5G

The focus of this part was to adapt existing machine learning and AI systems to align with the scenarios outlined above, optimizing them accordingly. Key objectives included:

  • Define system’s goals and develop the architecture of the system
  • Collected ground truth data for training and validating AI models.
  • Established and annotated a suitable database tailored for plant identification and monitoring.
  • Integrated AI models seamlessly into the 5G network infrastructure.

In this phase, edge devices equipped with mobile phone SIMs utilizing 5G technology played a crucial role. Key performance indicators (KPIs) such as latency or end-to-end (E2E) latency were monitored closely. Measurements included assessing the reliability and availability of data packets received accurately, along with analyzing user data rates and peak data rates.

Furthermore, assumptions were made based on streaming UHD resolution video in MP4 format, transmitted via Transmission Control Protocol (TCP). Potential solutions explored included optimizing with single images instead of continuous video streams, performing base optimizations directly on edge devices, and implementing model quantization techniques to enhance efficiency.

Cloud Infrastructure and AWS Services

The project relied heavily on cloud infrastructure leveraging AWS services such as Lambda, SageMaker, S3, CloudWatch, and RDS, which played a critical role in providing the necessary resources for training and deploying AI models.

AWS Lambda was employed for efficient instance management and application serving, while AWS SageMaker facilitated the construction of robust machine learning pipelines. Storage solutions such as S3, CloudWatch, and RDS were essential for storing datasets and logs crucial for the operation of machine learning models and neural networks.

AWS cloud infrastructure

Hence, this infrastructure supported the real-time data processing capabilities enabled by the 5G network.

5G Network Latency

5G networks were designed to achieve ultra-low latency, typically ranging from 1 to 10 milliseconds. This latency reflected the time taken for data to travel between mobile devices and AWS servers via the 5G network. Device-specific processing capabilities, such as the speed of capturing and processing photos on smartphones with high-performance processors, also influenced latency.

Data upload speeds on the 5G network and the size of the photo impacted data transfer times to AWS. AWS further contributed to latency with processing times for tasks like neural network-based detection and segmentation, which varied based on algorithm complexity and AWS service efficiency. After processing, results were downloaded back to mobile devices, influenced by the download speed of 5G and the size of the result data.

Plant Recognition Using AI

In the realm of plant recognition, AI-driven processes involved creating a comprehensive database of plant images for training algorithms based on the neural networks. These algorithms were trained to distinguish sugar beet species from other plants by recognizing features specific for that particular plant type such as leaf shapes, flower colors, etc.

Phenological development of sugar beet plants
Phenological development of sugar beet plants. Source: https://www.mdpi.com/2073-4395/11/7/1277

Here, by plant recognition we mean the task of weed detection and sugar beet plants segmentation.

  • Weed Detection

For weed detection, the project employed MobileNet-v3, which was trained with extensive data augmentations and weighted sampling. This model achieved an impressive accuracy of 0.984 and an AUC of 0.998.

  • Sugar Beet Segmentation

For segmentation tasks, models like YOLACT, ResNeSt, SOLO, and U-net were employed to precisely delineate individual sugar beet samples within images. Then the most efficient model was chosen based on the different criteria: speed, inference time, etc. Data for segmentation was sourced from drone-captured RGB images, which were resized and annotated for training and validation purposes.

Segmentation tasks involved creating masks that accurately delineated plant boundaries. This method reduced human annotation efforts while optimizing efficiency. By prioritizing the labeling of challenging samples, the model’s performance was significantly enhanced. Iterative retraining and uncertainty sampling strategies had proven effective, achieving segmentation accuracy rates exceeding 98% across various growth stages.

Example of input-output of segmentation
  • Model Evaluation

The model was trained with rigorous data augmentations. The model was evaluated using different metrics including Intersection over Union (IoU). Inference analysis for the built model, conducted on a subset from the ‘plant seedlings v2’ dataset, demonstrated an accuracy of 81%.Inference time took approximately 320 milliseconds to compute after a 7-second initialization period, necessary only once per session.

In plant monitoring powered by artificial intelligence (AI), cameras and sensors captured vital plant data, analyzed by machine learning and AI algorithms. This analysis played a crucial role in assessing plant health, pinpointing stress, diseases, or other factors impacting growth.

Applications extended from optimizing agricultural productivity to monitoring natural ecosystems like forests, aiding conservation efforts, and enhancing understanding of environmental impacts.

Object Detection in Plant Monitoring

The next phase after segmenting sugar beet plants is the object detection aimed to understand specifics of each plant in terms of health, growth and other factors. For object detection in plant monitoring, advanced models such as YOLOv4, MobileNetV2, and VGG-19 with attention mechanisms were deployed. These models analyzed segmented images of sugar beets to detect specific stress and disease areas, enabling precise and targeted interventions.

The project achieved significant milestones in disease detection, training ResNet-18 and ResNet-34 models pre-trained on ImageNet. These models demonstrated an impressive accuracy of 0.88 in identifying diseases affecting sugar beet plants, with an Area Under the ROC Curve (AUC) of 0.898. The models exhibited high prediction confidence, accurately distinguishing between diseased and healthy plants.

Example of input-output of object detection

The project employed a systematic approach to disease detection, segmenting images into standardized patches. These patches underwent meticulous annotation using interactive tools to pinpoint areas affected by diseases. Object detection further enhanced accuracy by outlining bounding boxes around plants, facilitating precise monitoring of plant health.

Plant Production Prediction

In the domain of plant production prediction, AI models leveraged environmental data such as weather conditions and soil parameters to forecast crop yields. Regression models like Isolation Forest, Linear Regression, and Ridge Regression were employed.

These models integrated numeric features extracted from bounding box regions along with soil data to optimize fertilizer application.

Sugar beet on test field

Model Deployment Considerations

Deployment strategies for the developed models were evaluated for both edge devices and cloud platforms. Deploying models on edge devices offered advantages such as reduced costs and lower latency.

However, this approach might trade off potential accuracy due to hardware constraints. On the other hand, cloud deployment offered faster inference times using high-performance GPUs but might incur additional costs and was reliant on internet connectivity, which could introduce communication latency.

Comparative Analysis with 5G Network

A comparative analysis demonstrated that utilizing a 5G network significantly enhanced sugar beet segmentation compared to traditional 4G/WiFi setups. This improvement was evidenced by reduced average setup and network times, highlighting the efficiency gains achieved through 5G technology.

  • Data Preparation Process

The data preparation process involved collecting datasets of healthy and diseased plants, detecting weeds, identifying growth stages, and extracting images from 4K raw video. Techniques like histogram equalization, image filtering, and HSV color space transformation were used to prepare the data for analysis.

Samples of healthy sugar beet leaves and diseased samples, such as corn leaves with Grey Leaf Spot, were collected. Disease feature extraction involved separating the leaf from the background, resizing, transforming, and merging images to create realistic samples for analysis.

Annotation process for segmentation
  • Active Learning Loop

An active learning loop was initiated with unlabeled data, utilized to train detection models. These models generated annotation queries that were addressed by human annotators, continually refining the model’s accuracy through iterative training and annotation cycles.

  • Data Annotation via Multimodal Foundation Model

Addressing the challenge of limited labeled data, the project leveraged robust foundation models to generate ground truth annotations. Notably, CLIP, a transformer-based model developed by OpenAI, trained on a vast dataset of over 400 million image-text pairs, played a pivotal role.

Utilizing Vision Transformers as its backbone, CLIP achieved a remarkable 95% accuracy on validation sets, proficiently categorizing images into distinct classes such as sugar beet and weed with high precision.

  • Drone Technology for Data Collection

One of the critical technologies employed in the project was the use of drones equipped with RGB cameras that captured 4K video. These drones provided detailed images (3840×2160 resolution) for analysis.

Pre-processing these images significantly boosted model accuracy, with notable improvements observed in models like VGGNet (+38.52%), ResNet50 (+21.14%), DenseNet121 (+7.53%), and MobileNet (+6.6%).

Techniques such as histogram equalization were used to enhance image contrast, while transformation into HSV color space helped emphasize plant areas and highlight relevant features.

  • Synthetic Data Generation

To address the challenge of limited image data, synthetic datasets were generated via machine learning and AI. Data collection was performed using drones flying at heights between 1m to 4m and speeds of 2m/s or more, utilizing RGB cameras.

Emulation environment

Other vehicles, such as tractors, were also employed for data collection. This synthetic data generation proved particularly beneficial for detecting sugar beet diseases.

Conclusion

The “5G Networks as an Enabler for Real-time Learning in Sustainable Farming” project successfully demonstrated how 5G technology can enhance the ecological, economic, and sustainable aspects of sugar beet cultivation. Through collaboration with HSHL and Pfeifer & Langen, the project integrated real-time data collection and AI-driven analysis, improving efficiency and reducing unnecessary field visits.

A dedicated 5G campus network enabled precise applications of fertilizers and crop protection products. Geopard Agriculture played a crucial role in developing plant detection and monitoring scenarios, and creating a prototype machine learning system for the 5G agricultural environment. The project’s success underscored the importance of advanced technologies in sustainable farming, highlighting 5G’s potential to drive innovation and efficiency.

Visualizing Economic Impacts of Sustainable Farming Using GeoPard in Precision Agriculture

Researchers from Bayerische Landesanstalt für Landwirtschaft (LfL) and GeoPard Agriculture teamed up to look into the economics of strip-intercropping systems for sustainable farming. They shared their findings at the University of Hohenheim’s event on “Promote Biodiversity through Digital Agriculture,” focusing on eco-friendly farming practices and their financial impacts.

Their project, “Future Crop Farming,” aimed to explore new ways of farming, with a special focus on strip-intercropping. This technique involves growing different crops side by side in strips within the same field, which could reduce the need for chemicals and increase biodiversity. The researchers wanted to find ways to make farming more eco-friendly while still being profitable for farmers.

Led by Olivia Spykman and Markus Gandorfer from LfL, along with Victoria Sorokina from GeoPard, this collaboration started during the EIT Food Accelerator program. Using their knowledge in farming, digital tools, and data analysis, they set out to study the economic side of sustainable farming practices.

While addressing the reduction of synthetic inputs and the increase of biodiversity they found that the ecological potential of strip-intercropping is well-researched. However, its mechanization and labor economics, especially with autonomous equipment, require further evaluation.

They found that farmers were unsure about its practicality, especially with new technology. To address this, they talked with farmers at a strip-intercropping field lab to understand their concerns and communicate better.

Furthermore, changes to the landscape can make farmers hesitant, so providing clear information upfront is important. Therefore, digital tools, like visualizations, can facilitate communication between farmers and their communities, generating acceptance and appreciation for ecologically beneficial landscape transformations.

For example, in New Zealand, farmers used virtual reality (VR) goggles to visualize suitable areas for afforestation, aiding farm-scale planning by illustrating impacts on farm profitability, landscape aesthetics, and rural communities. Such visualizations can enhance farmers’ understanding and interest in landscape changes, though successful implementation also depends on farmers’ self-confidence.

Similarly, in this research, the cloud-based program GeoPard was used to analyze a strip intercropping production system from multiple perspectives. GeoPard’s equations were parametrized with empirical data from the Future Crop Farming project. Initial results include visualizations of herbicide and nitrogen input and yield output, with more complex calculations planned.

Herbicide application map displaying

Furthermore, the system integrated various data sources, including:

  • Yield and applied-input datasets
  • Price information for crops and plant protection (provided by the user)
  • Satellite imagery (Sentinel-2, Landsat, Planet)
  • Topography data
  • Zone maps of historical data available in GeoPard

Meanwhile, the main techniques utilized involved spatial analysis and efficient handling of spatial data using the NumPy framework. Data was sourced from .xlsx and .shp files. However, the shape file lacked specific details about individual strips, necessitating the integration of various data formats.

GeoPard facilitated organizing data spatially to link strip-specific details with their respective locations in the field. Hence, the integrated dataset, displaying the strips, formed the basis for the descriptive trial analysis in GeoPard.

Although the research didn’t examine variable-rate application of inputs, GeoPard’s high-resolution mapping (pixel size: 3×3 meters) enabled detailed visualization at the pixel level, adding complexity. This detailed mapping is valuable for future applications, like combining multiple layers or integrating more spatially variable information such as ‘yield profiles’ based on small-scale yield data collected by plot combines in the research project.

Yield-per-crop map in full view and zoomed-in to show pixel-level details

Researchers have also discovered that although GeoPard has primarily served descriptive functions, it possesses the potential for more complex visualizations. For example, incorporating sub strip-level yield data and price information could help create profit maps, showing edge effects between neighboring crop strips.

Furthermore, integrating labor economic data could reveal the impacts of reducing economies of scale to promote biodiversity. Such data can aid scenario modeling, allowing exploration of various crop rotations, strip widths, and mechanization types, focusing on field-specific outcomes to improve agricultural management and decision-making.

Hence, the setup could function as a digital twin, with real-time data transfer from field machines and sensors to GeoPard, a capability already achievable with some commercial technologies and satellite data. However, farmers’ concerns about technology compatibility emphasize the need to integrate additional data sources for broader applicability.

GeoPard Boosts Precision Farming for MHP, Ukraine’s Leading Agriholding

Introduction

In a landmark move for agriculture in Ukraine, MHP, a major grain producer overseeing an impressive 350,000 hectares (almost 900,000 acres), has partnered with GeoPard. This collaboration signifies a major advancement in precision agriculture, incorporating GeoPard’s sophisticated geospatial analytics into MHP’s extensive farming operations.

MHP’s Commitment to Technological Innovation in Precision Agriculture

MHP’s dedication to technological innovation, especially in the realm of precision farming, is profoundly exemplified in its partnership with GeoPard Agriculture. This collaboration is central to MHP’s strategy of integrating cutting-edge technologies for more efficient and sustainable farming practices.

Pavlo Nesterenko, Head of the Precision Farming Service Group at MHP, delves into the transformative nature of their partnership with GeoPard Agriculture: “Working with GeoPard has been a game-changer. It’s shifted our approach from relying on gut feeling to making decisions based on hard data. Through GeoPard’s sophisticated technology, we’re implementing precise, sub-field agronomy recommendations that are specifically tailored for each plot’s unique requirements.”

This paradigm shift, facilitated by the integration with GeoPard Agriculture, has enabled MHP to leverage the full potential of data analytics and machine learning.

“This shift towards data-centric farming is crucial for MHP, keeping us at the cutting edge of the agricultural sector. We’re pioneering new standards in efficiency, sustainability, and productivity, grounded in quantifiable, number-based decision-making,” Nesterenko concludes.

MHP’s adoption of this advanced, data-driven methodology marks a significant advancement in agricultural practices, underscoring the growing importance of empirical data and precision in modern farming. This innovative approach positions MHP as a leader in the field, setting new benchmarks in agricultural efficiency and success.

GeoPard’s Integral Role in MHP’s Agricultural Strategy

GeoPard Agriculture’s integration with MHP goes beyond providing advanced tools; it’s about embedding geospatial data-driven precision and efficiency in MHP’s farming practices. By closely collaborating with MHP’s teams, GeoPard guarantees a wide range of sophisticated geospatial agronomic calculation options for MHP, aligning closely with their operational framework. This partnership focuses on measuring applied agronomy, ensuring that MHP’s decisions are data-driven and precisely tailored to their agricultural needs. The seamless data flow between MHP, GeoPard, and other platforms like John Deere and FieldView creates a connected ecosystem, optimizing MHP’s farming operations for the future.

Ensuring Agronomic Precision and Quality Assurance

In the realm of precision agriculture, GeoPard Agriculture’s RX vs. VRA Map Comparison stands as a testament to their commitment to agronomic precision and quality assurance. This tool highlights the effectiveness of GeoPard’s algorithms in identifying and addressing discrepancies in various agronomic operations such as seeding, fertilizing, or spraying. By accurately pinpointing issues on both a sub-field and machine level, GeoPard ensures that each agronomic operation adheres to the highest standards of quality and precision.

This map comparison is not just about identifying differences in planned and actual applications; it’s a crucial component in the quality assurance process of agronomic operations. By providing a detailed and accurate assessment of every aspect of field management, GeoPard’s technology ensures that operational practices meet the intended outcomes, maintaining the highest level of efficiency and accuracy.

Harvesting Analysis

For harvesting, GeoPard’s system slices yield datasets by day and by machine, segmenting data into Wet Mass, Moisture, and Speed. This facilitates a detailed performance analysis of each harvester, providing valuable insights into the harvesting process efficiency.


Merged Yield dataset, collected by several machines in different days

Merged Yield dataset, collected by several machines on different days

As-Applied & As-Planted Application Accuracy Calculations

In operations like spraying, seeding, and fertilizing, GeoPard’s technology segments datasets by day, machine, and application rate. It then compares the target versus actual applied rates, and clustering results to determine application accuracy. This feature is essential in understanding and improving the precision of these critical agricultural tasks.

Clusterization of factual As-Planted vs VRA prescription map

A key aspect of this technology is its ability to automatically merge machinery and agronomic operation data from various agronomic activities, such as seeding, fertilizing, or spraying. This automated integration of data is crucial for accurately identifying discrepancies between planned and actual applications at both a sub-field and machine level.

Operational Enhancements Led by GeoPard’s Technology

GeoPard Agriculture’s platform is renowned for its ability to translate agronomic knowledge into precise calculations using the EquationMap engine and a multi-layered data approach. This technical synergy has notably improved crop quality and sustainability, particularly for wheat, corn, and sunflower.


Oleksii Leontyev, Precision Agriculture Project Manager at MHP, emphasizes the dynamic nature of this integration: “Implementing GeoPard’s API into our systems has transformed our agricultural operations, allowing us to make data-driven decisions in real-time via converting every executed agronomic operation into measurable numbers from machine level to corporation level.”

GeoPard - MHP - 360° degree field analytics: Field Potential, Harvesting, Soil and GPS Topography GeoPard – MHP – 360° degree field analytics: Field Potential, Harvesting, Soil, and GPS Topography

GeoPard CTO on the Collaboration

Dzmitry Yablonski, CTO of GeoPard Agriculture, reflects on the project’s scale: “This collaboration with MHP is one of the most significant and technically complex in precision agriculture history. I share the vision of MHP to digitalize every operation and automate decision-making around agronomy with a purely data-driven approach. We’re honored to contribute to the success of Ukraine’s large-scale agribusiness.”

John Deere Ops Center Integration

The collaboration between GeoPard Agriculture and MHP is highlighted by the integration of GeoPard as the core analytics engine with John Deere Ops Center and MHP’s machinery. This bi-directional synchronization enables the efficient, automated processing of comprehensive datasets, covering as-applied, as-planted, and harvesting data. This integration plays a vital role in amending data, increasing data completeness, and providing value-added insights, significantly advancing precision farming practices.

The Digital Agro 360° Business Intelligence Farming Dashboard

The field potential map offers a comprehensive view of an agricultural field, showcasing zones with varying crop potentials. It reflects differences in soil quality levels, and overall crop health, emphasizing the field’s topography and spatial variability. This map is instrumental in demonstrating how GeoPard’s analytics can adeptly manage and optimize diverse agricultural conditions.

Through the Digital Agro 360° Business Intelligence Farming dashboard, MHP has unprecedented visibility into its operations. This robust platform allows MHP to track all data aggregated from their extensive farming activities, filtered per machine, crop, or day.

The dashboard serves as a nerve center for MHP’s precision farming operations, presenting a unified view of the various data streams flowing in from the fields. It enables a level of oversight that simplifies complex datasets into actionable insights, empowering MHP with the ability to make strategic decisions rapidly. The harvesting dashboard, for instance, provides near real-time data on yield, moisture content, and the operational pace of harvesting equipment per productivity zone.

The Digital Agro 360° Business Intelligence Farming Dashboard

The Digital Agro 360° Business Intelligence Farming Dashboard

The Way Forward: Integrating Comprehensive Data for Full-Cycle Precision Agriculture

Looking to the future, MHP, in collaboration with GeoPard Agriculture, is championing digitalization and data-driven management in crop production with precision agriculture, emphasizing innovation and sustainable practices. This forward-thinking approach is grounded in integrating comprehensive data layers, encompassing all farm operations, soil sampling information, and detailed analytics.

MHP is leveraging GeoPard’s technology to incorporate a wide array of data into their agricultural models. This includes detailed insights from every farming operation, resulting in advanced analytics such as subfield profit maps and efficiency assessments of agricultural inputs. This holistic approach not only enhances operational efficiency but also ensures sustainable farming practices.

Viktor Martseniuk, Head of the Scientific and Innovation Center at MHP, articulates the company’s vision: “At MHP, our commitment to innovation in agriculture goes hand in hand with our dedication to sustainability. By integrating comprehensive data, including soil analysis and farm operations, we can make more informed decisions that positively impact both our productivity and environmental footprint.”

This integrated strategy, combining MHP’s innovative approach with GeoPard’s advanced analytics, is set to redefine precision farming. It promises enhanced sustainability while maximizing economic returns, thereby establishing MHP and GeoPard Agriculture as leaders in the global arena of precision agriculture.

Universal Application of GeoPard’s Engine

Dmitry Dementiev, CEO of GeoPard Agriculture, emphasizes the broad applicability of their technology: “GeoPard’s engine is designed to bring tangible benefits to any crop farm business. Our platform is versatile and adaptable, capable of delivering advanced analytics and precision farming solutions to a wide range of agricultural contexts. Whether it’s a small family farm or a large agribusiness like MHP, GeoPard is poised to make a significant impact, driving efficiency, sustainability, and profitability in the agricultural sector globally.”

This statement from Dementiev underscores GeoPard’s commitment to providing universal solutions in precision agriculture, catering to diverse farming needs and scales across the globe.

Conclusion

The collaboration between GeoPard Agriculture and MHP marks a significant progression in the field of precision agriculture. By harnessing advanced geospatial analytics, this partnership sets a new benchmark in agricultural efficiency and sustainability, paving the way for a data-driven future in farming practices. This partnership between GeoPard Agriculture and MHP combines cutting-edge technology with extensive farming expertise, setting a new standard in precision agriculture and showcasing the potential of technology-driven farming solutions.

About the Companies

MHP: MHP is one of Ukraine’s leading agribusinesses, managing an extensive area of over 350,000 hectares. Renowned for its grain production, MHP integrates innovative agricultural practices and technologies, emphasizing sustainable and efficient farming. Their commitment to modernizing agriculture aligns with their goal of enhancing productivity while maintaining environmental stewardship.


GeoPard: GeoPard Agriculture is at the forefront of precision agriculture technology. Specializing in geospatial analytics, GeoPard provides solutions that transform complex agricultural data into actionable insights. Their technology focuses on optimizing various aspects of farming, from soil analysis to VRA maps, remote sensing, and ag equipment data analytics, contributing significantly to the advancement of smart farming practices.


References:

Stickstoff-Effizienz. Anwendungsfall von LVA – John Deere Händler aus Deutschland

In der dynamischen Welt der modernen Landwirtschaft stehen Landwirte vor zahlreichen Herausforderungen, darunter die Auswirkungen des Klimawandels, steigende Düngemittelkosten und die dringende Notwendigkeit umweltverträglicher Praktiken. Im Zentrum dieser Herausforderungen steht das Management von Stickstoff, einem entscheidenden Nährstoff, der bei falschem Umgang zu erheblichen Umweltfolgen führen kann.

Inmitten dieser Komplexität treten jedoch zwei Maßstäbe als Lösungen und Spielveränderer hervor: Stickstoffnutzungseffizienz (NUE) und Stickstoffaufnahme (NU). NUE und NU bieten ein neues Paradigma in landwirtschaftlichen Praktiken und wandeln Herausforderungen in Chancen für nachhaltige und effiziente Landwirtschaft um.

John Deere, ein führender Hersteller von Landmaschinen, spielt eine entscheidende Rolle bei der Bewältigung dieser Herausforderungen. Durch das HarvestLab GrainSensing System liefern sie entscheidende Daten über Rohprotein, was ein nuancierteres Verständnis der Stickstoffdynamik in Pflanzen ermöglicht.  Darüber hinaus unterstützt John Deere die Integration moderner Technologien, um die Landwirtschaft nachhaltiger zu gestalten.

In diesem Bestrebungen stehen John Deere-Händler wie LVA als entscheidende Partner zur Verfügung. LVA, ein innovativer John Deere-Händler in Deutschland, arbeitet eng mit Landwirten zusammen, um neue Technologien zu integrieren und fortgeschrittene agronomische Strategien umzusetzen.

Ihre Rolle ist wesentlich, um Landwirte dabei zu unterstützen, die Komplexität der modernen Landwirtschaft zu bewältigen und sicherzustellen, dass sie die verfügbaren Technologien optimal nutzen, um ihre Praktiken zu optimieren.

In den fruchtbaren Böden der Magdeburger Börde liegt die Baumgärtel GbR, ein Familienbetrieb mit 30 Jahren landwirtschaftlicher Tradition, wo Weizen eine der Hauptkulturen ist. Auf diesem Hof geht das präzise Stickstoffmanagement über die Optimierung des Ertrags hinaus: Es ist ein Engagement für nachhaltige Landwirtschaft angesichts globaler Umweltprobleme.

GeoPard, als führender Anbieter von Präzisionslandwirtschaftssoftware, fungiert als Bindeglied, das diese Säulen – John Deere, LVA und Landwirte, wie die Baumgärtel GbR – verbindet. GeoPard vereinfacht  das Datenmanagement und automatisiert analytische Prozesse, indem es Daten in handlungsrelevante Erkenntnisse verwandelt.

In diesem Fall bietet ihr Fokus auf Stickstoffnutzungseffizienz (NUE) Landwirten eine Perspektive, durch die sie ihre Praktiken betrachten und verbessern können, und gewährleistet Nachhaltigkeit und Effizienz in jedem Aspekt ihrer Tätigkeit.

Stickstoffmanagement auf dem Hof Baumgärtel

Die  Baumgärtel GbR unter der Leitung von Friedrich Baumgärtel nutzt das Potenzial der datengesteuerten Landwirtschaft, um ihre Düngestrategien zu verfeinern und neue Techniken einzuführen, alles mit dem Ziel, ihre agronomischen Praktiken zu verbessern.

Zentral für ihre Strategie ist das Stickstoffmanagement. Das Jahr 2023 brachte einen nassen Frühling und einen trockenen Frühsommer in die Magdeburger Börde, was zu durchschnittlichen Erträgen führte. Um diese Bedingungen zu bewältigen, nutzte die Familie Baumgärtel teilflächenspezifisch die Green Seeker-Technologie, um ihre Stickstoffanwendungen präzise anzupassen.

Zusätzlich setzten sie das HarvestLab GrainSensing System ein, um den Rohproteingehalt im geernteten Getreide zu messen. Anschließend wurde mit GeoPard der Stickstoffverbrauch der Pflanzen geschätzt, was die Berechnung der Stickstoffnutzungseffizienz (NUE) mit hoher Präzision ermöglichte.

Für die Familie Baumgärtel ist NUE zu einem wesentlichen Maßstab geworden. Es identifiziert Bereiche, in denen Anpassungen in ihrer Stickstoffanwendungsstrategie notwendig sind. In Zonen, in denen die NUE unter 80 % liegt, planen sie, die Stickstoffanwendung in der folgenden Saison zu reduzieren.

Im Gegensatz dazu erfordern Bereiche, in denen die NUE 100 % übersteigt, eine eingehende Analyse. Eine Herausforderung, von der sie erwarten, dass sie mehrere Saisons sorgfältiger Beobachtung und Lernens erfordern wird.

Zusammenarbeit zwischen LVA & GeoPard Agriculture

Im Jahr 2022 wurde eine strategische Allianz zwischen GeoPard und dem Landmaschinenunternehmen LVA Altenweddingen GmbH, dem innovativen John Deere-Händler in Deutschland, geschmiedet. Diese Zusammenarbeit entstand aus einer gemeinsamen Vision heraus, die umfangreichen Daten von John Deere in handlungsrelevante Felderkenntnisse umzusetzen.

Seitdem hat sich die Partnerschaft weiterentwickelt und konzentriert sich auf innovative Wege, die landwirtschaftlichen Praktiken durch datengesteuerte Entscheidungen zu verbessern. In den folgenden Abschnitten werden wir hervorheben, wie Landwirte ihren Stickstoffeinsatz optimal nutzen.

Michael Eckhardt, Leiter des Precision Ag Departments bei LVA, äußerte: “Die Synergie zwischen GeoPard und LVA ist mehr als nur eine Geschäftspartnerschaft; es ist ein Engagement, angewandte agronomische Praktiken durch datengesteuerte Entscheidungen zu revolutionieren. Diese Zusammenarbeit ist darauf ausgerichtet, Landwirten verbesserte agronomische Einsichten zu ermöglichen.

LVA nutzt mit seinen erweiterten agronomischen Dienstleistungen die Stärke von John Deere-Geräten, wie dem HarvestLab GrainSensor System, um entscheidende Daten zu sammeln. Auf der anderen Seite verarbeitet GeoPards Analyse-Engine diese Daten und liefert handlungsrelevante Erkenntnisse.

Gemeinsam bildet diese Partnerschaft eine Allianz, die darauf fokussiert ist, die Praktiken der Landwirte (wie etwa im Bereich des Stickstoffmanagements) zu verbessern, durch die Kombination des Besten aus Maschinen- und Softwarewelten.”

Datenerfassung und -aufbereitung

Im Zentrum dieser datengetriebenen landwirtschaftlichen Entwicklung steht die nahtlose Integration zwischen GeoPard und dem John Deere Operations Center. Diese Zusammenarbeit veranschaulicht die zentrale Rolle von John Deere bei der Bereitstellung von Datenzugang über ihre API, eine Maßnahme, die den Datenfluss aus den landwirtschaftlichen Feldern erheblich bereichert.

Die Integration stellt sicher, dass sobald Operationen im John Deere Operations Center dokumentiert werden, diese umgehend an GeoPard übertragen werden. Dieser sofortige Datenabrufprozess umfasst Erntevorgänge (mit Details wie Rohprotein- und Kraftstoffverbrauchsdaten) sowie Anwendungen wie Spritzen, Düngen, Säen und Bodenbearbeitung.

Diese reibungslose Verbindung ist nicht ausschließlich auf John Deere beschränkt; das grundlegende Prinzip der GeoPard-Plattform ist ihre Kompatibilität mit verschiedenen Anbietern von Maschinendaten, die über API-Anbindungen ermöglicht wird.

Durch einem nahtlosen Datenfluss in GeoPards System sind die Landwirte mit nahezu Echtzeitanalysen ausgestattet. Diese prompte Datenübertragung ist der Eckpfeiler für die Initiierung automatisierter Analyse-Suiten, wie der Analyse der Stickstoffnutzungseffizienz, und stellt sicher, dass die Landwirte zeitnahe und handlungsrelevante Einblicke zur Hand haben.

Feld

Im Jahr 2023 stand die Baumgärtel GbR vor der Herausforderung,  das Wachstum auf dem Feld zu optimieren. Dafür wurde viermal Stickstoff ausgebracht, beginnend mit SSA im Februar, gefolgt von drei Anwendungen von AHL im Frühjahr.

Um diese Anwendungen auf dem Feld teilflächenspezifisch fein abzustimmen, wurde die entsprechende Technologie eingesetzt. Zudem spielte das HarvestLab GrainSensing System eine entscheidende Rolle bei der Aufdeckung der Verteilung von Rohprotein im geernteten Getreide.

Ernte

Entdecken Sie die Feinheiten der neuesten Ernte vom 2023-08-08 anhand der folgenden Screenshots. Dieser entscheidende Datensatz, der nahtlos und automatisiert vom John Deere Operations Center durch GeoPard abgerufen wurde, zeigt das feine Gleichgewicht zwischen den Datenebenen Rohprotein und feuchter Masse, die während der Ernte erfasst wurden.

Rohprotein-Daten: Ernte 2023-08-08                               
Feuchtmasse-Daten: Ernte 2023-08-08

Obwohl Erntedaten gelegentlich Variationen aufweisen können, erhöht die Implementierung der Ertragskalibrierung die analytische Genauigkeit erheblich. Dies gewährleistet zuverlässige Erkenntnisse, auch bei außergewöhnlichen Werten wie 19 t/ha für Weizen. Die kalibrierte feuchte Masse ist unten dargestellt.

Kalibrierte Daten zur Feuchtmasse: Ernte 2023-08-08

Düngungsmaßnahmen mit angewendeten Stickstoffprodukten

Während der Saison 2023 wurde der Weizenbestand mit einem sorgfältig geplanten Stickstoffapplikationsregime behandelt, das vier unterschiedliche Behandlungen umfasste. Dazu gehörte eine Anwendung von SSA-Produkten am 2023-02-23, gefolgt von drei Stickstoffanwendungen im Frühjahr mit AHL am 2023-03-18, 2023-04-06 und 2023-05-13. Die genauen in jeder Behandlung angewendeten Mengen sind in den bereitgestellten Screenshots dokumentiert.

Stickstoffanwendung: 2023-02-23 SSA
Stickstoffanwendung: 2023-03-18 AHL
Stickstoffanwendung: 2023-04-06 AHL                          
Stickstoffanwendung: 2023-05-13 AHL

GeoPard spielte in diesem Prozess eine entscheidende Rolle, indem es nahtlos diese Datensätze vom John Deere Operations Center abrief. Diese effiziente Datenbeschaffung bereitete den Weg für eine umfassende Analyse der Stickstoffnutzungseffizienz (NUE) und der Stickstoffaufnahme (NU). Indem wir uns in diese Daten vertiefen, verwandeln wir rohe Informationen in wertvolle Erkenntnisse und ebnen den Weg für verbesserte agronomische Operationen und Strategien.

Gesamter angewendeter Stickstoff

Der gesamte angewendete Stickstoff (TAN) quantifiziert die kumulative Menge an Stickstoff, die auf das Feld aufgebracht wurde, dargestellt in absoluten Zahlen als kg/ha. Dieser Wert ergibt sich aus der Summe der tatsächlich während der Anbausaison aufgebrachten Stickstoffprodukte.

Um die höchste Genauigkeit in der Bewertung zu gewährleisten, wurden nur tatsächlich angewendete Daten verwendet und Ziel- und Planwerte ausgeschlossen. Ein solcher Ansatz berücksichtigt auch Stellen mit über- und unterdosiertem Stickstoff.

Um tiefer einzusteigen, haben wir jeden Quadratmeter untersucht, um den Landwirten ein detailliertes Verständnis für die pro Hektar aufgebrachten Stickstoffmengen zu bieten. Die Karte unten fasst die Informationen aus allen vier Stickstoffanwendungen zusammen und bietet einen einheitlichen Überblick über die Verteilung des während der Saison aufgebrachten Stickstoffs.

Alle präsentierten statistischen Daten sind in absoluten Zahlen angegeben, gemessen in kg/ha. Die farbkodierte Darstellung erleichtert die Interpretation: Rot kennzeichnet Bereiche mit dem geringsten aufgebrachten Stickstoff, während Grün Regionen mit dem höchsten aufgebrachten Stickstoff anzeigt.

Gesamtanwendung Stickstoff 2023

Stickstoffaufnahme

Stickstoffaufnahme (NU) gibt die Gesamtmenge an Stickstoff an, die Pflanzen während ihrer Wachstumsperiode aufnehmen. Um NU genau zu berechnen, werden zwei kritische Komponenten berücksichtigt: (1) die Rohproteinmessung, wie sie vom John  Deere GrainSensing System erfasst wird, und (2) die gesamte geerntete Ertragsmasse.

Bei Weizen wird die NU-Verteilung in absoluten Werten angegeben, gemessen in kg/ha. Eine detaillierte geografische und statistische Darstellung der NU im gesamten Feld ist im beigefügten Screenshot zu sehen.

Stickstoffaufnahme 2023
Statistische Verteilung des Stickstoffaufnahmens

Stickstoffnutzungseffizienz

Die Stickstoffnutzungseffizienz (NUE) quantifiziert das Verhältnis des verbrauchten Stickstoffs zum insgesamt aufgetragenen Stickstoff, ausgedrückt in Prozent. Abgeleitet von der zuvor beschriebenen Stickstoffaufnahme (NU) und dem gesamten angewendeten Stickstoff (TAN), ist ein NUE-Wert nahe 100% ideal. Dies zeigt, dass die Pflanzen fast den gesamten aufgetragenen Stickstoff verbraucht haben, was den Ertrag optimiert.

Jedoch deuten NUE-Werte um 50% auf eine Überanwendung mit übrig gebliebenem Stickstoff im Boden hin, während Werte über 100% eine Unteranwendung anzeigen, wobei die Pflanzen Stickstoffreserven aus früheren Jahren nutzen.

Beide Szenarien sind unerwünscht: Ersteres birgt das Risiko einer Überdüngung, während letzteres den Boden erschöpft. Diese Balance wird in der Karte unten visuell dargestellt, wobei Bereiche nahe 50% NUE in Rot und solche nahe 100% in Grün gefärbt sind.

Stickstoffnutzungseffizienz 2023
Clusterisierung der Stickstoffnutzungseffizienz 2023
Verteilung der Stickstoffnutzungseffizienz 2023

Stickstoffüberschuss

Der Stickstoffüberschuss (NS) misst die Differenz zwischen dem gesamten angewendeten Stickstoff (TAN) und der Stickstoffaufnahme (NU), die die Pflanzen während einer Saison verbrauchen, ausgedrückt in absoluten Werten als kg/ha. Im Wesentlichen zeigt er die Menge an Stickstoff an, die von den Pflanzen nicht genutzt wurde.

Dies spielt eine entscheidende Rolle bei der Planung der Stickstoffanwendung für die nachfolgende Saison. Die geografische und statistische Verteilung dieses ungenutzten Stickstoffs, verteilt über das Feld, kann in der unten bereitgestellten Karte eingesehen werden.

Stickstoff-Überschuss 2023

Vergleich von Erntemasse und Rohprotein

Das Verständnis von Rohproteindaten ist wesentlich bei der Messung der Ernte, da es Einblicke in die ernährungsphysiologische Qualität und den potenziellen Marktwert der Ernte bietet. Das HarvestLab GrainSensing System wird zur Messung von Rohprotein verwendet, und ein entsprechender Screenshot, der seine Verbindung zur Ernte zeigt, ist als Referenz angehängt.

Rohprotein-Daten: Ernte 2023-08-08               
Kalibrierte Feuchtmasse-Daten: Ernte 2023-08-08

Um die Daten zu kategorisieren und zu verstehen, haben wir spezifische Schwellenwerte festgelegt: einen Proteinschwellenwert von 12,5% und einen Schwellenwert für die Nassmasse der Ernte von 7,9 t/ha. Basierend auf diesen Schwellenwerten verwenden wir die Begriffe “höher” und “niedriger”, um zu beschreiben, wie die beobachteten Daten in Bezug auf diese festgelegten Standards stehen.

Durch den Vergleich und die Gegenüberstellung dieser Kennzahlen können wir wertvolle Ideen gewinnen, um agronomische Maßnahmen für die folgenden Saisons zu verfeinern und zu verbessern.

Durch die Kombination der Kennzahlen auf einer einzigen Karte wird die Beziehung zwischen Rohprotein und Nassmasse visualisiert. Diese umfassende Darstellung identifiziert vier unterschiedliche Szenarien:

  1. Ertrag höher als 7,9 t/ha mit Protein höher als 12,5%
  2. Ertrag höher als 7,9 t/ha mit Protein niedriger als 12,5%
  3. Ertrag niedriger als 7,9 t/ha mit Protein höher als 12,5%
  4. Ertrag niedriger als 7,9 t/ha mit Protein niedriger als 12,5%
Ertrag vs. Proteinverteilung 2023

Schlussfolgerung

  1. Daten: Durch die nahtlose Integration mit dem John Deere Operations Center stellt GeoPard eine Echtzeit- und genaue Datenerfassung sicher, die die Grundlage für alle nachfolgenden Analysen bildet. Die Einbeziehung von tatsächlich gemessenen Daten aus dem HarvestLab GrainSensing System und den tatsächlichen Anwendungsdaten ist von entscheidender Bedeutung. Zusammen gewährleisten sie eine beispiellose Genauigkeit bei den Berechnungen.
  2. Stickstoffaufnahme (NU) und gesamter angewendeter Stickstoff (TAN): Diese beiden Kennzahlen sind für Landwirte von größter Bedeutung, die das Gleichgewicht und die Dynamik von Stickstoff in ihren Feldern verstehen möchten. Gemeinsam bieten sie ein vollständiges Bild des Stickstoffkreislaufs über eine Saison hinweg.
  3. Stickstoffnutzungseffizienz (NUE): NUE dient als Schlüsselkennzahl zur Bewertung der Gesamteffizienz der Stickstoffnutzung auf einem Feld. Indem Bereiche mit unterschiedlichen NUE-Werten identifiziert werden, können Landwirte Möglichkeiten zur Verfeinerung ihrer Stickstoffanwendungsstrategien erkennen und die gesamten agronomischen Praktiken verbessern.
  4. Stickstoffüberschuss (NS): NS liefert entscheidende Erkenntnisse, die die Strategien für die variable Rate Application (VRA) für die kommende Saison beeinflussen können. Durch die Berücksichtigung des nicht genutzten Stickstoffs können Landwirte informierte Entscheidungen treffen, um ihre Anwendungspläne anzupassen.

Aus der Perspektive eines Landwirts ist die Verknüpfung von präziser Datenerfassung mit aufschlussreichen Analysen ein Wendepunkt. Es geht nicht nur darum, ein Gleichgewicht bei der Stickstoffanwendung zu erreichen.

Es geht darum, Feinheiten zu verstehen, um Kulturen nachhaltig anzubauen, die bestmöglichen Erträge sicherzustellen und die Gesundheit des Bodens für zukünftige Generationen zu erhalten.

Über die Unternehmen

GeoPard ist ein führender Anbieter von Software für die Präzisionslandwirtschaft. Das Unternehmen wurde 2019 in Köln, Deutschland, gegründet und ist weltweit vertreten. GeoPard bietet eine Reihe von Lösungen, die Landwirten helfen, ihre Betriebsabläufe zu optimieren und die Erträge zu steigern. Mit einem Fokus auf Nachhaltigkeit und regenerative Wirtschaft strebt GeoPard an, Präzisionslandwirtschaftspraktiken weltweit zu fördern.

Zu den Partnern des Unternehmens gehören bekannte Marken wie John Deere, Corteva Agriscience, Pfeifer & Langen, IOWA Soybean Association und viele andere.

LVA, Landmaschinen Vertrieb Altenweddingen, ist ein langjähriges mittelständisches Unternehmen mit Niederlassungen in Sachsen-Anhalt, Brandenburg und Niedersachsen. Der Schwerpunkt liegt auf Verkauf, Export, Vermietung, Händlerwerkstatt- und Ersatzteilservice für Landmaschinen sowie agronomischen Dienstleistungen. Seit über 30 Jahren gehört LVA zu den erfolgreichsten John Deere-Händlern in Europa.

Die agronomische Abteilung von LVA bietet Dienstleistungen wie Beratung im Bereich Präzisionslandwirtschaft, Bodenscannen und Datenanalyse sowie ein RTK-Netzwerk für GPS-Korrekturen an.

Heute arbeiten 100 Mitarbeiter am Standort Altenweddingen und weitere 220 Kollegen an den anderen Standorten in Niedersachsen, Brandenburg und Sachsen-Anhalt. Darunter befinden sich etwa 40 Auszubildende.

Nitrogen Use Efficiency. Use Case from LVA – John Deere Dealer from Germany

In the dynamic world of modern agriculture, farmers face multiple challenges, including the impacts of climate change, escalating fertilizer costs, and the pressing need for environmentally sustainable practices. Central to these challenges is the management of Nitrogen, a critical nutrient that, if mismanaged, can lead to significant environmental consequences.

However, amidst these complexities, two metrics emerge as solutions and game-changers: Nitrogen Use Efficiency (NUE) and Nitrogen Uptake (NU). NUE and NU offer a new paradigm in agricultural practices, turning challenges into opportunities for sustainable and efficient farming.

John Deere, a leading manufacturer of agricultural equipment plays a pivotal role in addressing these challenges. Through their HarvestLab GrainSensing System, they provide crucial data on Crude Protein, enabling a more nuanced understanding of Nitrogen dynamics in crops. Furthermore, John Deere supports the integration of modern technologies to make agriculture more sustainable.

In this quest, John Deere dealerships like LVA stand as crucial allies. LVA, an innovative John Deere dealership in Germany, works closely with farmers to integrate new technologies and implement advanced agronomic strategies. Their role is instrumental in helping farmers navigate the complexities of modern agriculture, ensuring that they make the most of available technologies to optimize their practices.

In the fertile soil of Magdeburger Börde lies the story of Baumgärtel GbR, a family farm with 30 years of agricultural heritage, where wheat is one of the primary crops. At this farm, the precise management of Nitrogen goes beyond optimizing crop yield: it’s about a commitment to sustainable agriculture in the face of global environmental challenges.

GeoPard, as a leading provider of precision farming software, acts as the glue that connects these pillars – John Deere, LVA, and farmers like those at Baumgärtel GbR. GeoPard simplifies data management and automates analytical processes, turning data into actionable insights. In this case, their focus on Nitrogen Use Efficiency offers a lens through which farmers can view and improve their practices, ensuring sustainability and efficiency in every aspect of their operations.

Nitrogen Management at Baumgärtel Farm

The Baumgärtel family, under the leadership of Friedrich Baumgärtel, embraces the potential of data-driven agriculture to refine their fertilizing strategies and introduce new techniques, all with the aim of improving their agronomic practices.

Central to their strategy is Nitrogen management. The year 2023 brought a wet spring and a dry early summer to Magdeburger Börde, resulting in average yields. To navigate these conditions, the Baumgärtels utilized used site-specific methods to precisely adjust their Nitrogen applications.

Additionally, they employed the HarvestLab GrainSensing System to measure Crude Protein in the harvested grain. Subsequently, using GeoPard, the crop’s Nitrogen consumption was estimated, enabling the calculation of Nitrogen Use Efficiency (NUE) with high precision.

For the Baumgärtels, NUE has become an essential metric. It identifies areas needing adjustments in their Nitrogen application strategies. In zones where NUE falls below 80%, they plan to reduce Nitrogen application in the following season. In contrast, areas where NUE exceeds 100% call for in-depth analysis, a challenge they expect will require multiple seasons of careful observation and learning.

Cooperation between LVA & GeoPard Agriculture

In 2022, a strategic alliance was forged between GeoPard and LVA agricultural machinery enterprise Altenweddingen, the innovative John Deere dealership in Germany. This collaboration was born out of a mutual vision to leverage John Deere’s extensive data into actionable field insights.

Since then, the partnership has grown, focused on innovative ways to improve farming practices through data-driven decisions. In the following sections, we’ll highlight how farmers make the most of their nitrogen use.

Michael Eckhardt, Head of the Precision Ag Department at LVA, mentioned, “The synergy between GeoPard and LVA is more than just a business partnership; it’s a commitment to revolutionizing applied agronomic practices through data-driven decisions.

This collaboration is dedicated to empowering farmers with enhanced agronomic insights. LVA, with its expanded agronomical services, leverages the strength of John Deere equipment, such as the HarvestLab GrainSensor System, to gather crucial data.

On the other side, GeoPard’s analytical engine processes this data, providing actionable intelligence. Together, this partnership forms an alliance, focusing on improving farmers’ practices (like around Nitrogen management) by combining the best of machinery and software worlds.”

Data Capturing and Preparation

At the heart of this data-driven agricultural evolution is the seamless integration between GeoPard and the John Deere Operations Center. This collaboration exemplifies the pivotal role of John Deere in providing data access via their API, a move that significantly enriches the data flow received from the agricultural fields.

The integration ensures that as soon as operations are documented in the John Deere Operations Center, GeoPard swiftly collects them. This immediate data retrieval process covers harvesting (with details like Crude Protein and Fuel consumption data) and applications like spraying, fertilizing, seeding, and tillage.

This streamlined connection is not exclusive to John Deere; the underlying principle of GeoPard’s platform is its compatibility with various machinery data providers, facilitating connections via API.

With data flowing seamlessly into GeoPard’s system, growers are empowered with near-real-time analytical insights. This prompt data transfer is the cornerstone of initiating automated analytical suites, such as the Nitrogen Use Efficiency analysis, ensuring that growers have timely and actionable insights at their fingertips.

Field

In 2023, Baumgärtel GbR faced the challenge of optimizing growth in the field. To achieve this, nitrogen was applied four times, starting with SSA in February, followed by three applications of AHL in the spring. These applications in the Field were fine-tuned using a site-specific method. Additionally, the HarvestLab GrainSensing System played a crucial role in revealing the distribution of crude protein in the harvested grain.

Harvest

Explore the intricacies of the latest harvest dated 2023-08-08 through the following screenshots provided. This crucial dataset, seamlessly fetched from the John Deere Operations Center by GeoPard in an automated manner, showcases the delicate balance between Crude Protein and WetMass data layers captured during the harvest.

Crude Protein Data: Harvest 2023-08-08
Wet Mass Data: Harvest 2023-08-08

While harvest data can occasionally exhibit variations, the implementation of Yield Calibration significantly enhances analytical accuracy. This ensures reliable insights, even in the face of exceptional values such as 19 t/ha for wheat. The calibrated WetMass is depicted below.

Calibrated Wet Mass Data: Harvest 2023-08-08

Fertilizing Operations with Applied Nitrogen Products

Throughout the 2023 season, the wheat crop was treated with a carefully planned nitrogen application regime, involving four distinct treatments. This included an application of SSA products on 2023-02-23, followed by three spring Nitrogen applications of AHL on 2023-03-18, 2023-04-06, and 2023-05-13. The precise quantities applied in each treatment are documented in the screenshots provided.

Nitrogen Application: 2023-02-23 SSA
Nitrogen Application: 2023-03-18 AHL
Nitrogen Application: 2023-04-06 AHL
Nitrogen Application: 2023-05-13 AHL

GeoPard played a crucial role in this process by seamlessly fetching these datasets from the John Deere Operations Center. This efficient data retrieval set the stage for a comprehensive analysis of Nitrogen Use Efficiency (NUE) and Nitrogen Uptake (NU). By delving into this data, we transform raw information into valuable insights, paving the way for enhanced agronomic operations and strategies.

Total Applied Nitrogen

Total Applied Nitrogen (TAN) quantifies the cumulative amount of nitrogen applied to the field, presented in absolute numbers as kg/ha. This metric is derived from the sum of the actual nitrogen products applied throughout the crop season.

To ensure the highest accuracy in the evaluation, only actual applied data was used, excluding Target and Planned figures. Such an approach also accounts for the spots with over-applied and under-applied nitrogen.

Delving deeper, we’ve examined each square meter to provide growers with a granular understanding of the nitrogen amounts applied per hectare. The map below consolidates information from all four nitrogen applications, offering a unified view of the season’s applied nitrogen distribution.

All statistical data presented are in absolute terms, measured in kg/ha. The color-coded representation helps in easy interpretation: red signifies areas with the least applied nitrogen, while green indicates regions with the highest applied.

Total Applied Nitrogen 2023

Nitrogen Uptake

Nitrogen Uptake (NU) represents the total amount of nitrogen consumed by plants throughout their growth season. To accurately calculate NU, two critical components are considered: (1) the crude protein measurement, as captured by the HarvestLab GrainSensing System, and (2) the total harvested yield mass.

For wheat, the NU distribution is presented in absolute terms, measured in kg/ha. A detailed geospatial and statistical representation of NU across the field can be seen in the accompanying screenshot.

Nitrogen Uptake 2023
Statistical Distribution of Nitrogen Uptake 2023

Nitrogen Use Efficiency

Nitrogen Use Efficiency (NUE) quantifies the ratio of Nitrogen consumed to the total Nitrogen applied, expressed in percentages. Derived from the earlier described Nitrogen Uptake (NU) and Total Applied Nitrogen (TAN), an NUE close to 100% is ideal, indicating that plants have consumed nearly all the applied Nitrogen, optimizing Yield.

However, NUE values around 50% suggest over-application with residual Nitrogen in the soil, while values exceeding 100% indicate under-application, with plants drawing from Nitrogen reserves of previous years.

Both scenarios are undesirable: the former risks excess fertilization, while the latter depletes the soil. This balance is visually represented in the map below, with areas near 50% NUE colored in red, and those nearing 100% in green.

Nitrogen Use Efficiency 2023
Clusterization of Nitrogen Use Efficiency 2023
Distribution of Nitrogen Use Efficiency 2023

Nitrogen Surplus

Nitrogen Surplus (NS) measures the difference between the Total Applied Nitrogen (TAN) and the Nitrogen Uptake (NU) that plants consume during a season, expressed in absolute terms as kg/ha. Essentially, it indicates the amount of Nitrogen left unused by plants, which plays a pivotal role in planning the Nitrogen application for the subsequent season.

The geospatial and statistical distribution of this unutilized Nitrogen, spread across the field, can be viewed in the map provided below.

Nitrogen Surplus 2023

YieldMass vs CrudeProtein Comparison

Understanding Crude Protein data is essential when measuring Yield, as it offers insights into the nutritional quality and potential market value of the crop. The HarvestLab GrainSensing System is employed to measure CrudeProtein, and a corresponding screenshot showcasing its link to Yield is attached for reference.

Crude Protein Data: Harvest 2023-08-08
Calibrated Wet Mass Data: Harvest 2023-08-08

To categorize and understand the data, we’ve set specific thresholds: a Protein Threshold at 12.5% and a Yield WetMass Threshold at 7.9t/ha. Based on these thresholds, we utilize the terms “higher” and “lower” to delineate how the observed data relates to these set standards. By comparing and contrasting these metrics, we can extract invaluable ideas to refine and enhance agronomic operations for subsequential seasons.

By combining the metrics on a single map, the relationship between CrudeProtein and WetMass are visualized. This comprehensive representation identifies four distinct scenarios:

  1. Higher 7.9t/ha Yield with Higher 12.5% Protein
  2. Higher 7.9t/ha Yield with Lower 12.5% Protein
  3. Lower 7.9t/ha Yield with Higher 12.5% Protein
  4. Lower 7.9t/ha Yield with Lower 12.5% Protein
Yield vs Protein Distribution 2023

Conclusion

1. Data: By seamlessly integrating with the John Deere Operations Center, GeoPard ensures real-time and accurate data capture, forming the foundation for all subsequent analytics. The incorporation of actual measured data from the HarvestLab GrainSensing System and the actual Applied Data is vital. Together, they ensure unparalleled accuracy in calculations.
2. Nitrogen Uptake (NU) and Total Applied Nitrogen (TAN): These two metrics are paramount for crop growers seeking to comprehend the balance and dynamics of nitrogen in their fields. Together, they offer a complete picture of the nitrogen lifecycle across a season.
3. Nitrogen Use Efficiency (NUE): NUE serves as a key metric to evaluate the overall effectiveness of nitrogen usage in a field. By pinpointing areas with varying NUE values, crop growers can identify opportunities to refine their nitrogen application strategies and improve overall agronomic practices.
4. Nitrogen Surplus (NS): NS provides critical insights that can influence Variable Rate Application (VRA) strategies for the upcoming season. By addressing the nitrogen left unutilized, farmers can make informed decisions to adjust their application plans.

From a farmer’s perspective, merging precise data collection with insightful analytics is a game-changer. It’s not just about achieving a balance in nitrogen application. It’s about understanding the intricacies of cultivating crops sustainably, ensuring the best possible yields, and maintaining the health of the land for future seasons.

About the Companies

GeoPard is a leading provider of precision farming software. The company was founded in 2019 in Cologne, Germany, and is represented globally. The company offers a range of solutions that help farmers optimize their operations and increase yields. With a focus on sustainability and regenerative economics, GeoPard aims to promote precision farming practices around the world.

The company’s partners include such well-known brands as John Deere, Corteva Agriscience, Pfeifer & Langen, IOWA Soybean Association, and many others.

LVA, agricultural machinery enterprise Altenweddingen, is a long-term midsize company with branches in Saxony- Anhalt, Brandenburg, and Lower Saxony. The focus lies on sales, export, rental, dealers workshop- and spare parts services for agricultural machinery and agronomic services. LVA has been one of the most successful John Deere dealers in Europe, for over 30 years.

The agronomic department of LVA provides services like precision farming consulting, soil scanning, and data analytics, RTK network for GPS correction.

Today, there are 100 employees at the Altenweddingen location and another 220 colleagues at the other locations in Lower Saxony, Brandenburg, and Saxony-Anhalt. Among them, there are about 40 trainees.

Introducing GeoPard’s Profit Maps: A Step Forward in Precision Agriculture

The profit map from the example in the screenshot takes into account the as-applied datasets of fertilization, seeding, two times of crop protection application, and harvesting. Other expenses can be added to the calculation, such as land preparation, miscellaneous activities as well.

Precision agriculture is a data-driven approach that seeks to increase efficiency and profitability. GeoPard, a leading provider of precision agriculture solutions, is enhancing its data analysis capabilities with the introduction of Profit Maps.

This feature provides a visual representation of profitability at the subfield level, enabling more informed decision-making and resource allocation. You’ll be able to see at a glance where your fields are making you money and where the costs of inputs and changes aren´t paying off.

Profit Maps are generated by integrating various data layers, including as-applied seeding, crop protection application, fertilizer usage, and harvesting data. This information is sourced directly from agricultural equipment and the John Deere Operations Center.

GeoPard then applies a custom equation, factoring in the cost of each input, to calculate zone-level profitability. These profit maps provide a comprehensive view of the profit spread across different field zones.

One of the key features of GeoPard’s Profit Maps is the ability to display the spread in profit across different zones of a field. This is calculated in dollars/euros/any currency and provides a clear indication of how much profit a farmer is making in each specific area.

By having this information at their fingertips, farmers can make more informed decisions about where and how to use their agricultural inputs.

For instance, they might choose to invest more in areas with higher profitability or reconsider their strategies in zones with lower returns. This granularity level in data analysis sets GeoPard’s Profit Maps apart.

Vladimir Klinkov, Managing Director of GeoPard, emphasizes the transformative potential of this tool, stating, “These maps allow farmers to make more informed decisions about resource distribution and costs on each hectare of the field and plan their business more effectively.”

The practical application of Profit Maps is already being demonstrated in real-world scenarios. Eurasia Group Kazakhstan, an official John Deere dealer, has been leveraging this feature to optimize its operations.

Evgeniy Chesnokov, Director of Agricultural Management at Eurasia Group Kazakhstan LLP, shares his experience: “With the help of GeoPard Agriculture’s Profit Map, we were able to gain a deeper understanding of the profitability of our partners’ fields.

This allowed our farmers to make more strategic decisions on the allocation of resources, which ultimately increased operational efficiency and improved bottom line indicators.”

GeoPard’s Profit Maps represent a significant advancement in precision agriculture, providing farmers with the insights they need to optimize their operations and maximize profitability. As the industry continues to evolve, tools like these will play an increasingly important role in shaping the future of farming.

For more insights into the development and application of profitability maps in precision agriculture, you can explore these resources: Kansas State University, ASPEXIT, Chilean Journal of Agricultural Research, USDA, and ResearchGate.

Stay tuned for more updates as GeoPard continues to innovate and push the boundaries of what’s possible in precision agriculture.

About the companies:

GeoPard is a leading provider of precision farming software. The company was founded in 2019 in Cologne, Germany, and is represented globally. The company offers a range of solutions that help farmers optimize their operations and increase yields.

With a focus on sustainability and regenerative economics, GeoPard aims to promote precision farming practices around the world.

The company’s partners include such well-known brands as John Deere, Corteva Agriscience, ICL, Pfeifer & Langen, IOWA Soybean Association, Kernel, MHP, SureGrowth, and many others.

Eurasia Group Kazakhstan is the Kazakh representative office of Swiss company Eurasia Group AG, an official dealer of John Deere in the Republic of Kazakhstan and Kyrgyzstan since 2002. The company delivers solutions for agriculture from leading world manufacturers like JCB, Väderstad, GRIMME, and Lindsay, covering all areas of crop and horticulture.

Eurasia Group Kazakhstan pays great attention during all its activity to the technologies of precise agriculture, completing the line of machinery with products of digitalization of agriculture.

Eurasia Group Kazakhstan has an extensive regional network – 14 regional offices in Kazakhstan and one in Kyrgyzstan, more than 550 employees, of which almost half – after-sales service employees, its own department of agricultural management and digitalization.

Over the years, more than 13,000 units of equipment have been supplied to Kazakhstan and 4.4 million hectares of land have been digitized. This year the company celebrates its 25th anniversary.

GeoPard Field Potential maps vs Yield data

GeoPard Field Potential maps very often look exactly like yield data.

We create them using multi-layer analytics of historical information, topography, and bare soil analysis.

The process of such synthetic Yield maps is automated (and patented) and it takes about 1 minute for any field in the world to generate it.


GeoPard Field Potential maps vs Yield data

Can be used as the basis for:

What are Field Potential maps?

Field potential maps, also known as yield potential maps or productivity potential maps, are visual representations of the spatial variability in potential crop yield or productivity within a field. These maps are created by analyzing various factors that influence crop growth, such as soil properties, topography, and historical yield data.

These maps can be used in precision agriculture to guide management decisions, such as variable-rate application of fertilizers, irrigation, and other inputs, as well as to identify areas that require specific attention or management practices.

Some key factors that are typically considered when creating field potential maps include:

  1. Soil properties: Soil characteristics such as texture, structure, organic matter content, and nutrient availability play a significant role in determining crop yield potential. By mapping soil properties across a field, farmers can identify areas of high or low productivity potential.
  2. Topography: Factors like elevation, slope, and aspect can influence crop growth and yield potential. For example, low-lying areas may be prone to waterlogging or have a higher risk of frost, while steep slopes may be more susceptible to erosion. Mapping these topographical features can help farmers understand how they affect productivity potential and adjust their management practices accordingly.
  3. Historical yield data: By analyzing historical yield data from previous years or seasons, farmers can identify trends and patterns in productivity across their fields. This information can be used to create these maps that highlight areas of consistently high or low yield potential.
  4. Remote sensing data: Satellite imagery, aerial photography, and other remote sensing data can be used to assess crop health, vigor, and growth stage. This information can be used to create these maps that reflect the spatial variability in crop productivity potential.
  5. Climate data: Climate variables such as temperature, precipitation, and solar radiation can also influence crop growth and yield potential. By incorporating climate data into these maps, farmers can better understand how environmental factors affect productivity potential in their fields.

They are valuable tools in precision agriculture, as they help farmers visualize the spatial variability in productivity potential within their fields. By using these maps to guide management decisions, farmers can optimize the use of resources, improve overall crop yields, and reduce the environmental impact of their agricultural operations.

Difference between Field Potential maps vs Yield data

Field potential maps and yield data are both used in precision agriculture to help farmers understand the spatial variability in their fields and make better-informed management decisions. However, there are some key differences between the two:

Data sources:

These maps are created by integrating data from various sources, such as soil properties, topography, historical yield data, remote sensing data, and climate data. However, this data is collected using yield monitors installed on harvesting equipment, which record the crop yield as it is harvested.

Temporal aspect:

These maps represent an estimation of the potential productivity of a field, which is generally static or changes slowly over time, barring significant changes in soil properties or other influencing factors. However, yield data is specific to a particular growing season or multiple seasons and can vary significantly from year to year based on factors like weather conditions, pest pressure, and management practices.

In summary, field potential maps and yield data are complementary tools in precision agriculture. These maps provide an estimate of the potential productivity of a field, helping farmers identify areas that may require different management practices. Yield data, on the other hand, documents the actual crop output and can be used to assess the effectiveness of management practices and inform future decision-making.

Automated Crop Scouting with Intersection of Data Layers

In GeoPard we have a module to create crop data scouting zones Automatically using flexible configuration of business and agronomic logic.

It allows to control huge amount of fields and do scouting only when emergency case happened.

Business/agronomic logic could be flexible. In this example – Tasks are created in the areas where we have High Historical Field Potential Zones and Low vegetation on the latest satellite imagery.

An example of another use-case: Low Yield zone (from yield file) Intersected with Low pH zones – to adjust lime fertility levels.


Automated Crop data Scouting zones with the Intersection of Data Layers
High Historical Field Productivity zones intersected with the latest Planet image low vegetation Zones -> Scouting tasks are created automatically in GeoPard

For crop trading companies and data modelers intersection between Historically most stable and High yield zones could be a good indicator to extrapolate Yield predictions.

If you’re a farmer, agronomist, or precision agriculture specialist, you know the importance of crop data scouting. It’s essential for monitoring the health of your crops and identifying any potential issues before they become major problems.

However, traditional crop scouting can be time-consuming and labor-intensive. That’s where automated scouting tasks come in.

GeoPard is a revolutionary automated precision agriculture software that uses advanced algorithms and satellite imagery to automatically monitor your crops. With GeoPard, you can easily set up automated scouting tasks that will alert you to any potential issues, such as pests, diseases, or nutrient deficiencies.

One of the key benefits of using automated scouting tasks is the ability to quickly and accurately identify issues in your crops. GeoPard uses advanced algorithms to analyze the satellite imagery of your fields, detecting even the smallest changes in your crops.

This means you can quickly identify any potential problems and take action to address them before they become more serious.

Another advantage of automated scouting tasks is the ability to monitor your crops on a regular basis. With traditional scouting, it can be difficult to regularly visit your fields and check for potential issues.

But with GeoPard, you can set up automated tasks that will monitor your crops on a daily or weekly basis, giving you a more comprehensive view of their health.

GeoPard’s automated scouting tasks are also customizable, allowing you to tailor them to your specific needs. You can set up tasks to monitor for specific issues, such as pests or diseases, or set up tasks to monitor specific areas of your field. This means you can get the information you need to make informed decisions about your crops.

In addition to its automated scouting tasks, GeoPard also offers a range of other features that can help you manage your precision agriculture operations. You can use GeoPard to plan your planting and fertilization, monitor soil moisture levels, and track your yield.

Overall, GeoPard’s automated scouting tasks are a powerful tool for farmers, agronomists, and precision agriculture specialists. With GeoPard, you can quickly and easily monitor your crops and identify potential issues, helping you make better decisions about your operations.

What is Crop Scouting?

Crop scouting is a practice in agriculture that involves systematically inspecting and monitoring crops to assess their health, growth, and potential issues. It typically involves physically walking through fields or utilizing technology such as drones or sensors to gather data.

Crop scouts observe and collect information on factors like pest infestations, disease outbreaks, nutrient deficiencies, and weed pressure.

This data helps farmers make informed decisions regarding crop management, such as implementing targeted treatments, adjusting fertilizer applications, or implementing pest control strategies. It plays a crucial role in maximizing crop yields and ensuring overall crop health.

What is Automated Crop Data Scouting?

Automated crop scouting refers to the application of cutting-edge technologies, including robotics, unmanned aerial vehicles (UAVs), various sensors, and artificial intelligence (AI), to observe and evaluate crop health and development in an agricultural environment.

The goal is to enhance effectiveness, lower expenses, and streamline crop management by automating tasks traditionally performed by human crop scouts.

The process of automated crop data scouting entails several stages, such as:

  • Gathering data: UAVs or terrestrial robots fitted with a range of sensors (e.g., cameras, multispectral sensors, LIDAR) acquire information on crop conditions, encompassing plant health, pest and disease occurrence, soil properties, and nutrient concentrations.
  • Analyzing data: The gathered data is subsequently processed and examined using AI and machine learning algorithms to detect patterns, irregularities, and tendencies related to crop health and development.
  • Making decisions: The data analysis results can be utilized to make informed choices about crop management, including optimizing watering, fertilization, pest management, and other interventions.
  • Taking action: Farmers can implement targeted measures based on the knowledge acquired from automated crop monitoring to address specific problems in the field, such as applying pesticides or nutrients solely where required, minimizing waste and environmental impact.

By providing farmers with real-time, accurate data, it can significantly enhance agricultural productivity and sustainability, allowing for better decision-making and the implementation of more precise management techniques.

How to Identify Scouting Zone?

Determining crop data scouting zones involve dividing a farm field into smaller, manageable sections based on aspects such as soil composition, terrain, historical crop outcomes, or other pertinent factors.

The objective is to establish uniform areas representing similar conditions, enabling more focused scouting, observation, and management practices. Here’s a step-by-step method to pinpoint crop scouting zone:

  • Collect historical information: Compile data on previous crop yields, soil analysis results, occurrences of pests and diseases, and any other significant information for the field. This data can help recognize areas with comparable conditions or performance.
  • Examine soil composition and terrain: Investigate the soil types and terrain of your field to comprehend natural variations. Different soil compositions and elevation levels can influence crop growth, nutrient absorption, and water accessibility, which in turn affects crop health.
  • Utilize remote sensing technology: Use satellite or drone-based imagery to obtain additional details on field conditions, such as vegetation indices, soil moisture levels, and temperature variations. This information can help fine-tune scouting zones by providing a more comprehensive view of the field.
  • Implement precision agriculture techniques: Use precision agriculture software to process and analyze the gathered data. These tools can help identify patterns and establish data-driven scouting areas, considering factors like crop health, soil variability, and terrain.
  • Establish scouting areas: Based on the data analysis, segment the field into smaller, uniform areas that display similar traits. These areas should be manageable in size and adapted to the specific requirements of your operation.
  • Update and adjust regularly: As circumstances change and new data becomes available, reassess and modify the scouting areas to ensure they remain relevant and precise. This may involve updating the areas based on new yield data, occurrences of pests and diseases, or other factors that influence crop performance.

Hence, by pinpointing and creating crop scouting zone, farmers can concentrate their monitoring efforts more efficiently and apply targeted management practices, resulting in better resource usage and improved crop health.

wpChatIcon
wpChatIcon

    Request Free GeoPard Demo / Consultation


    By clicking the button you agree our Privacy Policy. We need it to reply to your request.

      Subscribe


      By clicking the button you agree our Privacy Policy

        Send us information


        By clicking the button you agree our Privacy Policy