Introducing GeoPard’s Profit Maps: A Step Forward in Precision Agriculture

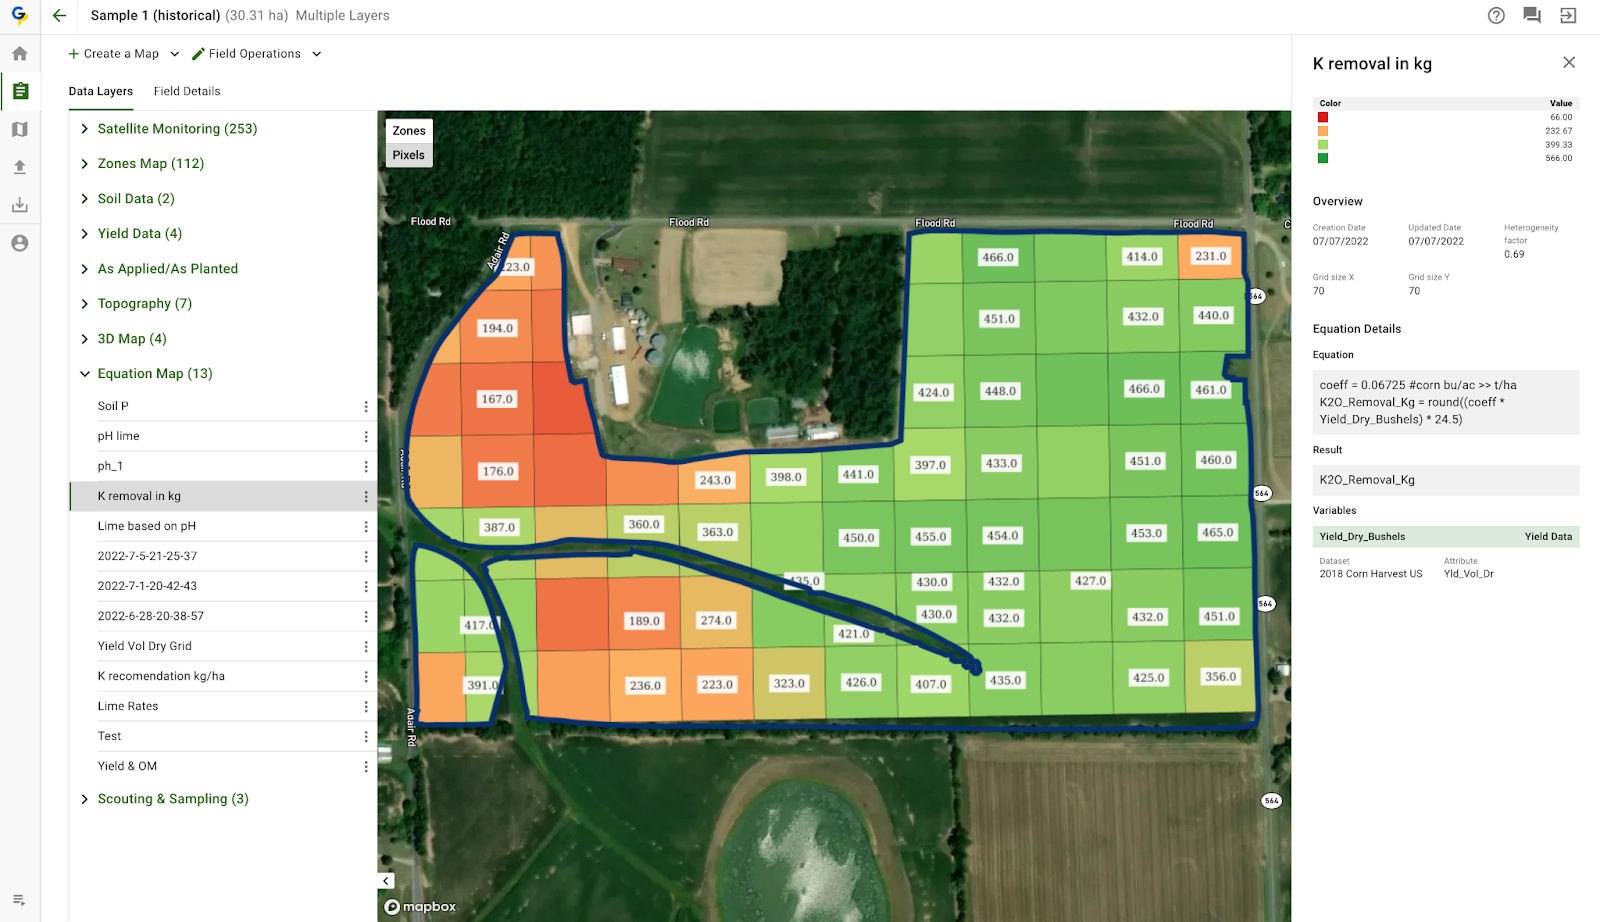
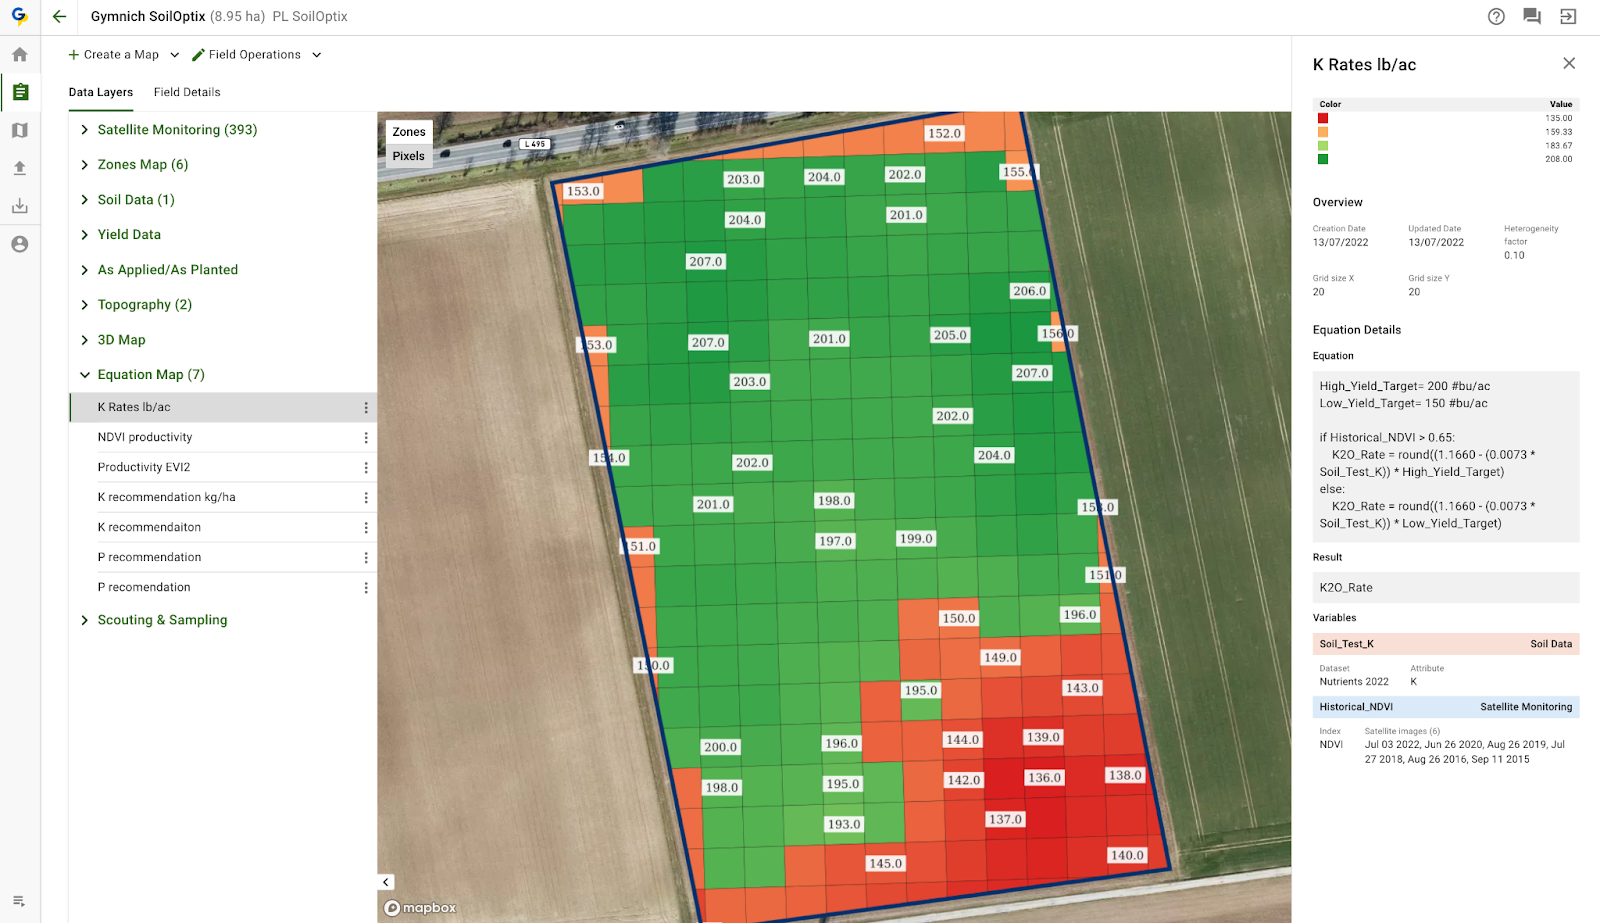
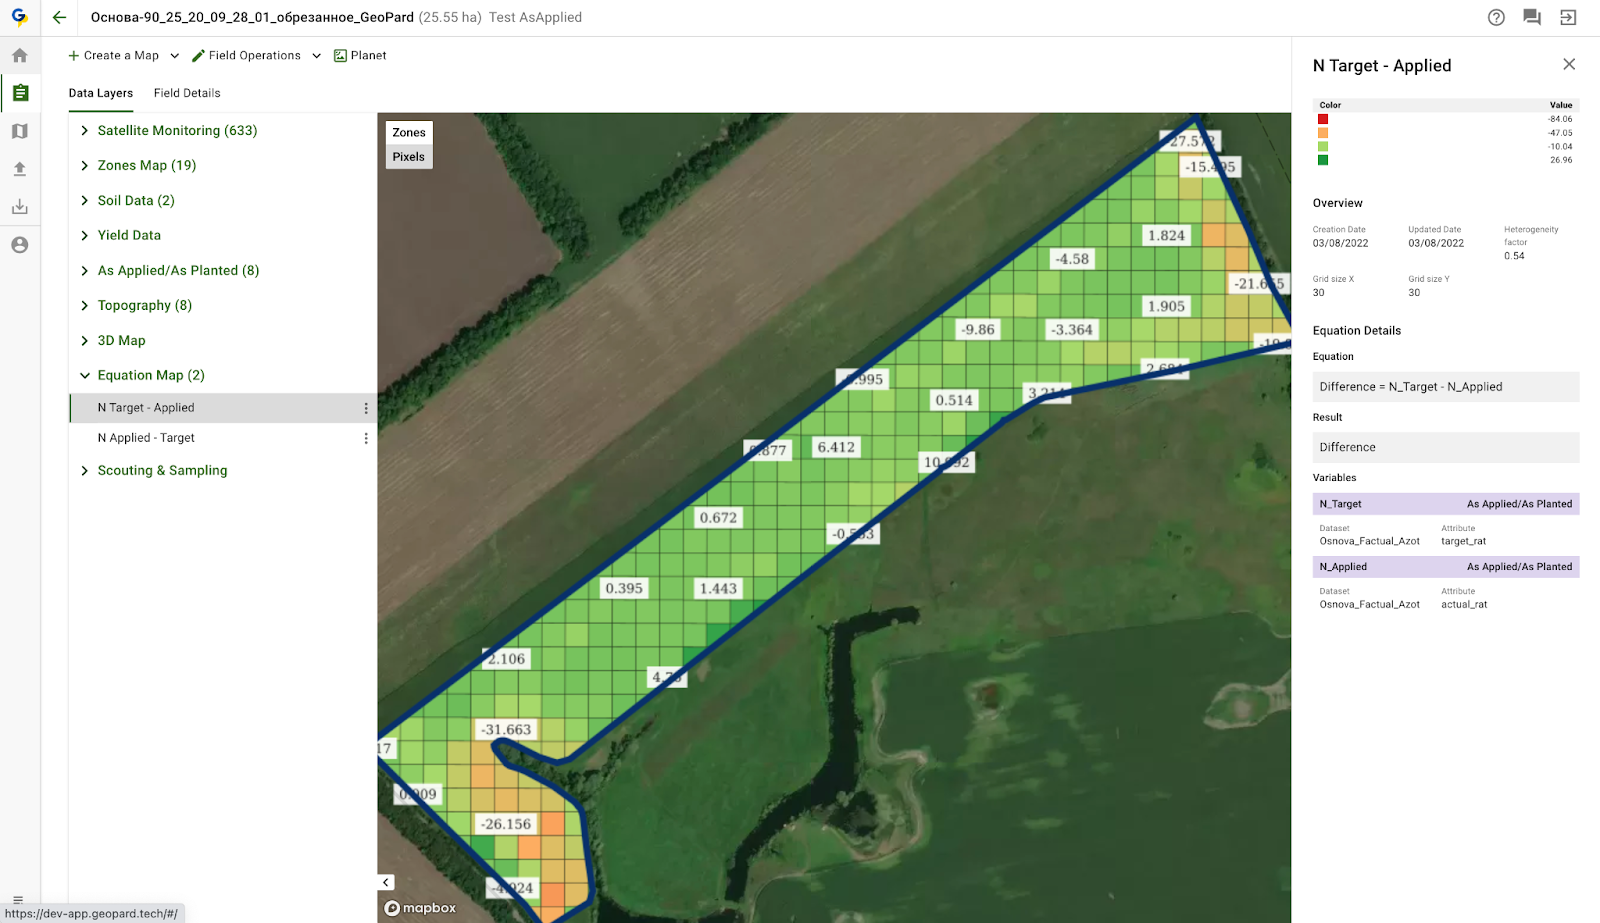
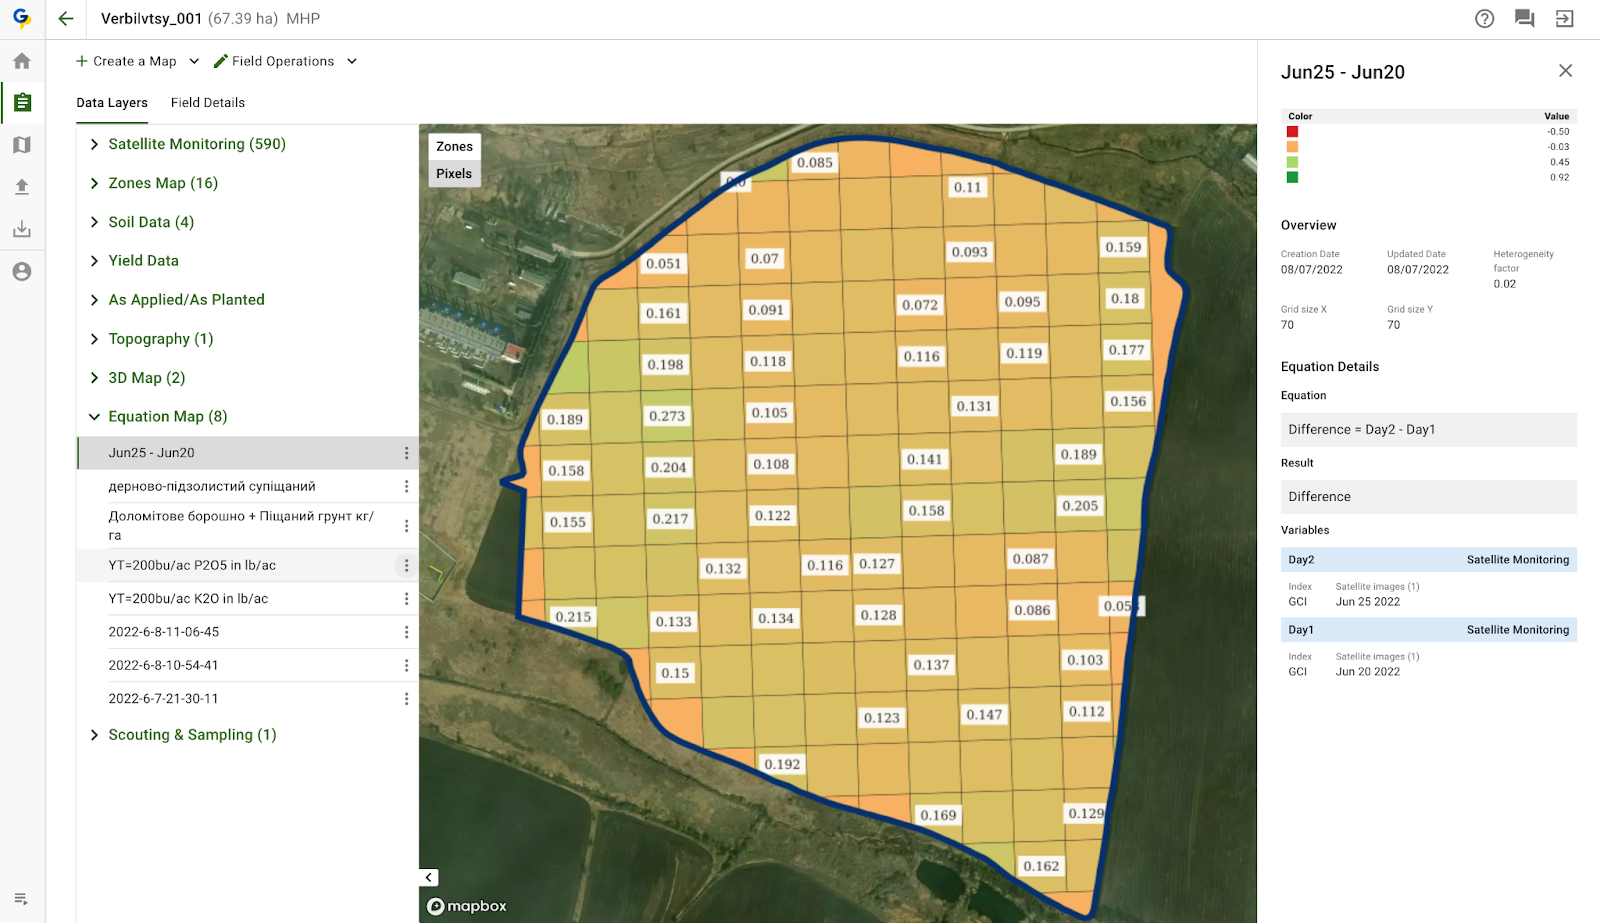
The profit map from the example in the screenshot takes into account the as-applied datasets of fertilization, seeding, two times of crop protection application, and harvesting. Other expenses can be added to the calculation, such as land preparation, miscellaneous activities as well.

Precision agriculture is a data-driven approach that seeks to increase efficiency and profitability. GeoPard, a leading provider of precision agriculture solutions, is enhancing its data analysis capabilities with the introduction of Profit Maps.

This feature provides a visual representation of profitability at the subfield level, enabling more informed decision-making and resource allocation. You’ll be able to see at a glance where your fields are making you money and where the costs of inputs and changes aren´t paying off.

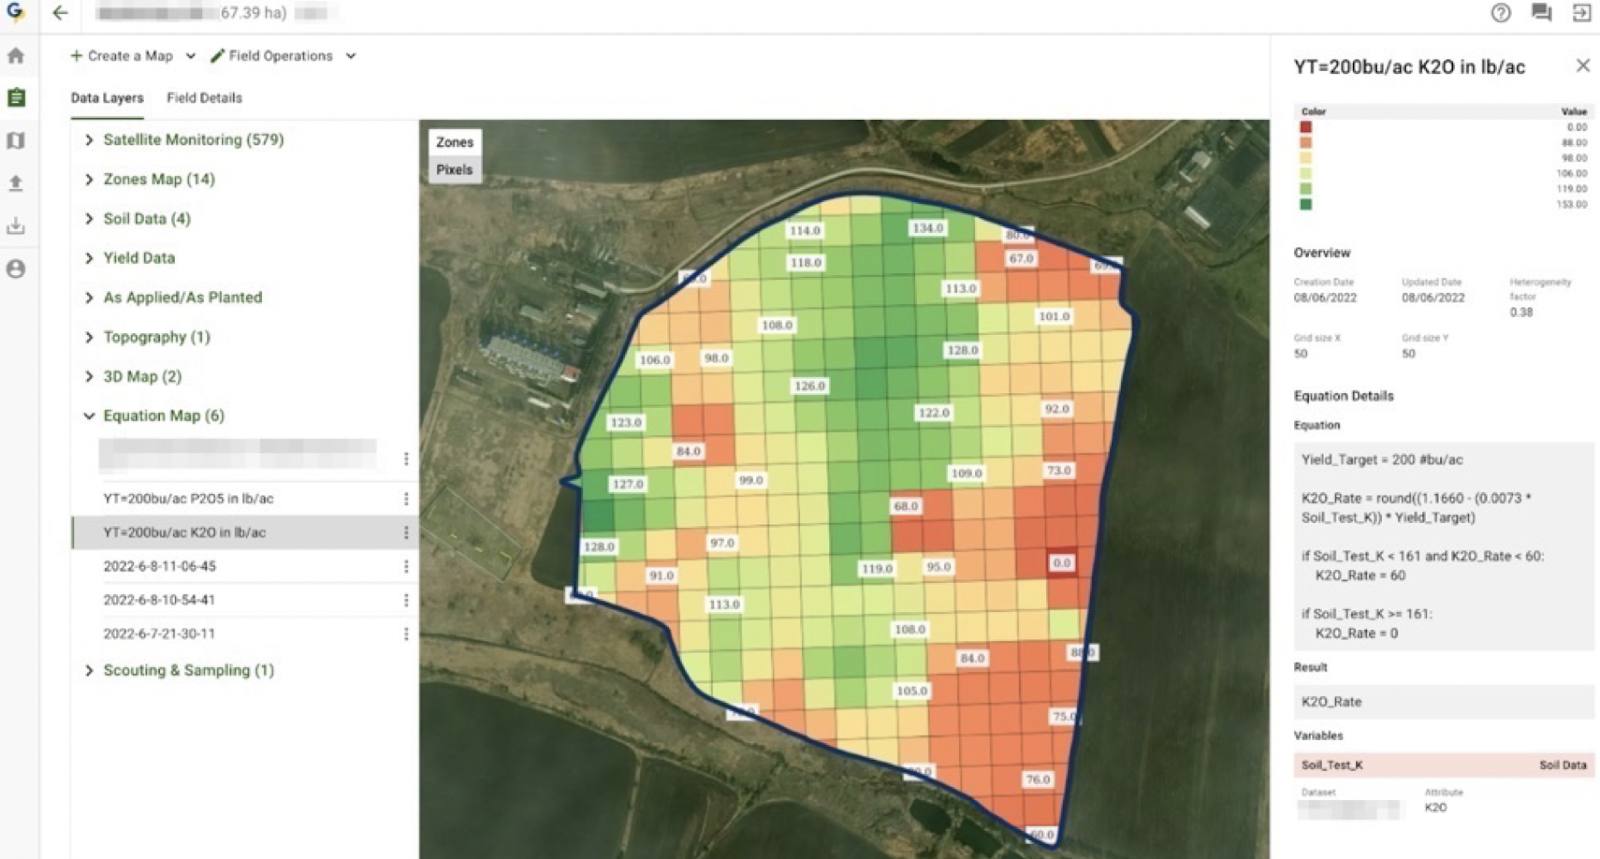
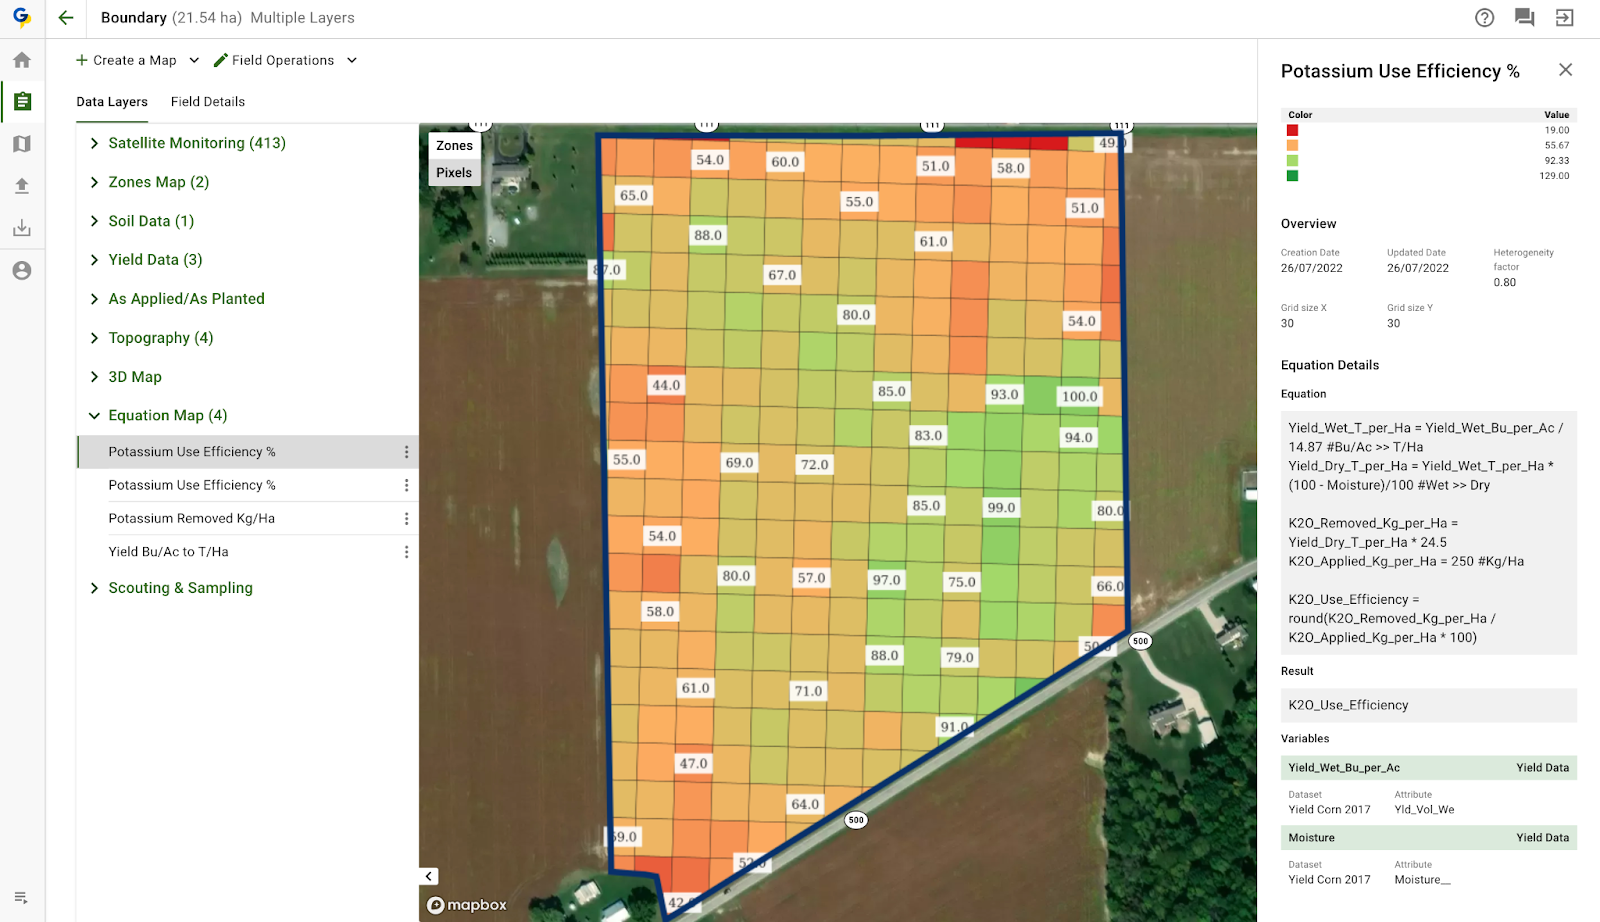
Profit Maps are generated by integrating various data layers, including as-applied seeding, crop protection application, fertilizer usage, and harvesting data. This information is sourced directly from agricultural equipment and the John Deere Operations Center.

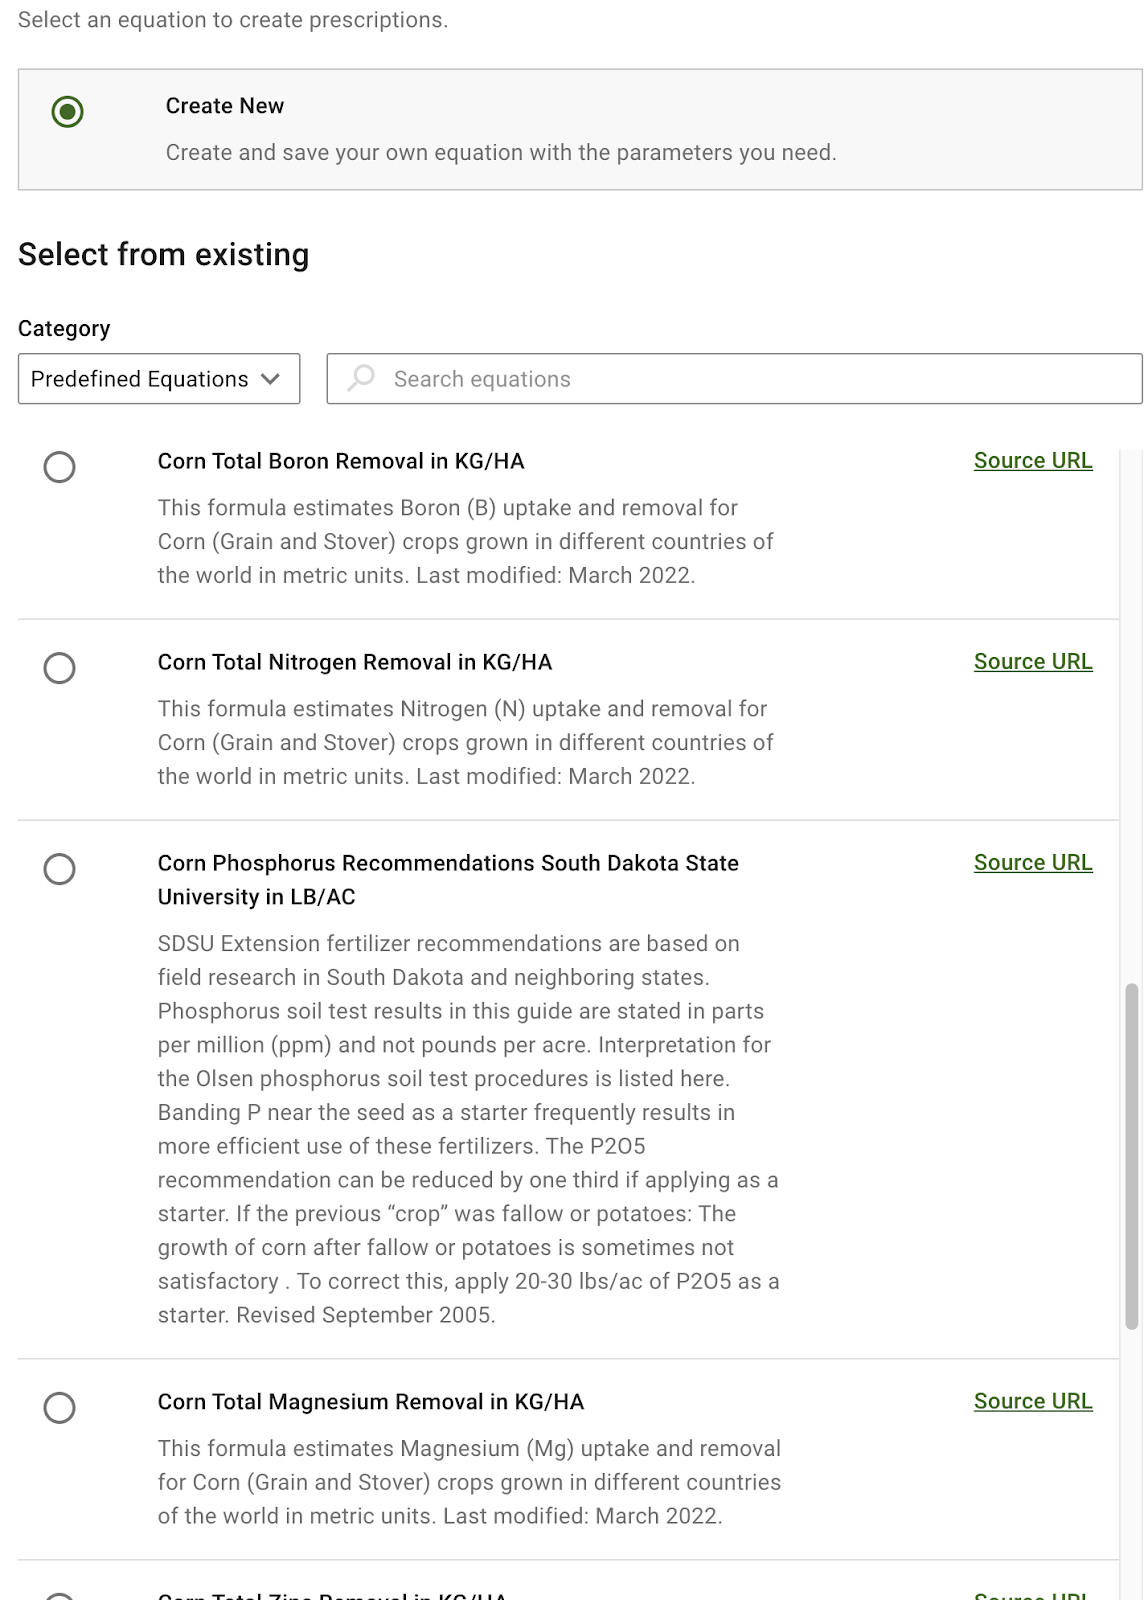
GeoPard then applies a custom equation, factoring in the cost of each input, to calculate zone-level profitability. These profit maps provide a comprehensive view of the profit spread across different field zones.

One of the key features of GeoPard’s Profit Maps is the ability to display the spread in profit across different zones of a field. This is calculated in dollars/euros/any currency and provides a clear indication of how much profit a farmer is making in each specific area.

By having this information at their fingertips, farmers can make more informed decisions about where and how to use their agricultural inputs.

For instance, they might choose to invest more in areas with higher profitability or reconsider their strategies in zones with lower returns. This granularity level in data analysis sets GeoPard’s Profit Maps apart.

Vladimir Klinkov, Managing Director of GeoPard, emphasizes the transformative potential of this tool, stating, “These maps allow farmers to make more informed decisions about resource distribution and costs on each hectare of the field and plan their business more effectively.”

The practical application of Profit Maps is already being demonstrated in real-world scenarios. Eurasia Group Kazakhstan, an official John Deere dealer, has been leveraging this feature to optimize its operations.

Evgeniy Chesnokov, Director of Agricultural Management at Eurasia Group Kazakhstan LLP, shares his experience: “With the help of GeoPard Agriculture’s Profit Map, we were able to gain a deeper understanding of the profitability of our partners’ fields.

This allowed our farmers to make more strategic decisions on the allocation of resources, which ultimately increased operational efficiency and improved bottom line indicators.”

GeoPard’s Profit Maps represent a significant advancement in precision agriculture, providing farmers with the insights they need to optimize their operations and maximize profitability. As the industry continues to evolve, tools like these will play an increasingly important role in shaping the future of farming.

For more insights into the development and application of profitability maps in precision agriculture, you can explore these resources: Kansas State University, ASPEXIT, Chilean Journal of Agricultural Research, USDA, and ResearchGate.

Stay tuned for more updates as GeoPard continues to innovate and push the boundaries of what’s possible in precision agriculture.

About the companies:

GeoPard is a leading provider of precision farming software. The company was founded in 2019 in Cologne, Germany, and is represented globally. The company offers a range of solutions that help farmers optimize their operations and increase yields.

With a focus on sustainability and regenerative economics, GeoPard aims to promote precision farming practices around the world.

The company’s partners include such well-known brands as John Deere, Corteva Agriscience, ICL, Pfeifer & Langen, IOWA Soybean Association, Kernel, MHP, SureGrowth, and many others.

Eurasia Group Kazakhstan is the Kazakh representative office of Swiss company Eurasia Group AG, an official dealer of John Deere in the Republic of Kazakhstan and Kyrgyzstan since 2002. The company delivers solutions for agriculture from leading world manufacturers like JCB, Väderstad, GRIMME, and Lindsay, covering all areas of crop and horticulture.

Eurasia Group Kazakhstan pays great attention during all its activity to the technologies of precise agriculture, completing the line of machinery with products of digitalization of agriculture.

Eurasia Group Kazakhstan has an extensive regional network – 14 regional offices in Kazakhstan and one in Kyrgyzstan, more than 550 employees, of which almost half – after-sales service employees, its own department of agricultural management and digitalization.

Over the years, more than 13,000 units of equipment have been supplied to Kazakhstan and 4.4 million hectares of land have been digitized. This year the company celebrates its 25th anniversary.

Calculating Difference Between Target Rx and As-Applied Maps

In precision agriculture, one of the common challenges is ensuring the application of seeds, fertilizers, or crop protection agents as per the prescribed rate (Target Rx).

Variations between the target prescription and what is actually applied on the field (As-Applied) could lead to inefficient use of resources and impact crop performance.

By leveraging GeoPard’s powerful analytics, you can calculate and visualize the differences between your Target Rx and As-Applied maps.

This difference analysis can serve as an important tool to quickly identify issues with equipment, application timing, or the actual application itself.

Let’s take a deeper look into this:

  • Visualizing Differences: GeoPard’s platform allows you to generate a “difference map”, overlaying your Target Rx and As-Applied data. This visual representation of variance provides a quick and intuitive way to spot areas where the actual application didn’t match the target.
  • Identifying Problems: By comparing the difference map against your original Rx and As-Applied maps, you can pinpoint specific areas or trends that might indicate equipment malfunction, sub-optimal application timing, or issues with the applied product itself.
  • Improving Efficiency: This analysis can help you optimize resource usage by addressing the identified issues, thus aligning your As-Applied rates closer to your Target Rx for future applications.
  • Enhancing Crop Performance: By ensuring that your field receives the right amount of inputs at the right time, you can boost crop health and potentially increase yield.

Remember, precision agriculture is all about making more informed and accurate decisions. By integrating this feature into your regular farm management practices, you can ensure you’re getting the most out of your inputs and drive your farm towards greater productivity and profitability.

Application prefix contains the operations related to the applied application some of them are:

1. Application Applied Rate – original applied map from the machinery (how was the product applied)

Application_AppliedRate.png - original applied map from the machinery (how was the product applied)

2. Application Target Rate – original target from the machinery (how has the product to be applied)

Application_TargetRate.png - original target from the machinery (how has the product to be applied)

3. Application Accuracy Clusterization – clusterization of the results: 0 – no data (machine did not visit these spots), 1 – applied below the target and not in the acceptable range (+-5% from the target)t, 2 – applied in the acceptable range ( +-5% from target), 3 – applied above the target and not in the acceptable range (+-5% from the target)

Application_AccuracyClusterization.png - clusterization of the results: 0 - no data (machine did not visit these spots), 1 - applied below the target and not in the acceptable range (+-5% from the target)t, 2 - applied in the acceptable range ( +-5% from target), 3 - applied above the target and not in the acceptable range (+-5% from the target)

4. Application Rate Difference – difference between applied and target rates in absolute numbers (l/ha units)

Application_RateDifference.png - difference between applied and target rates in absolute numbers (l/ha units)


Seeding prefix contains the operations related to the seeding some of them are:

1. Seeding Applied Rate – original applied from the planter (how many seeds were seeded)

Seeding_AppliedRate.png - original applied from the planter (how many seeds were seeded)

2. Seeding Target Rate – original target from the planter (how many seeds have to be seeded)

Seeding_TargetRate.png - original target from the planter (how many seeds have to be seeded)

3. Seeding Accuracy Clusterization – same clusterization rules, BUT the acceptable range is +-1% from the target

Seeding_AccuracyClusterization.png - same clusterization rules, BUT the acceptable range is +-1% from the target

4. Seeding Accuracy Clusterization Zoomed – same as Seeding Accuracy Clusterization but zoomed to show same area as Seeding Target Rate and Seeding Applied Rate

Seeding_AccuracyClusterizationZoomed.png - same as Seeding_AccuracyClusterization.png but zoomed to show same area as Seeding_TargetRate.png and Seeding_AppliedRate.png

5. Seeding Rate Difference – the difference between applied and target rates in absolute numbers (seeds/ha units)

5. Seeding Rate Difference - the difference between applied and target rates in absolute numbers (seeds/ha units)

What is target prescription (Target Rx) in agriculture?

In agriculture, the target prescription refers to the recommended or desired set of practices or inputs prescribed for optimal crop growth, health, and yield. It serves as a guideline or plan for farmers to follow in order to achieve specific agricultural objectives.

The target prescription takes into account various factors such as crop type, growth stage, soil conditions, climate, pest and disease pressures, and nutrient requirements.

It provides instructions on the application of fertilizers, pesticides, irrigation, crop rotation, seed selection, planting density, and other essential agricultural practices.

The purpose of a target prescription is to provide farmers with scientifically backed recommendations based on research, agronomic knowledge, and local conditions. It aims to optimize resource utilization, minimize crop losses, and enhance overall agricultural productivity.

Target prescriptions are often developed by agricultural experts, agronomists, agricultural extension services, or research institutions.

They may be specific to different crops, regions, or even individual fields, taking into account the unique characteristics and challenges of each farming context.

Farmers use target prescriptions as a reference point to guide their decision-making and management practices.

By following the recommended guidelines, farmers aim to maximize crop health, yield, and quality while minimizing the negative impact on the environment.

It is important to note that target prescriptions should be flexible and adaptable to account for variations in local conditions and the need for sustainable farming practices.

Farmers may need to make adjustments based on real-time observations, on-farm experiences, and continuous monitoring to ensure the best possible outcomes for their specific agricultural operations.

What is applied on the field (As-Applied)?

As-applied agriculture encompasses the process of accurately and precisely applying inputs, such as fertilizers, pesticides, and irrigation, to crops based on real-time data and site-specific conditions.

It involves the integration of various technologies, including GPS (Global Positioning System), GIS (Geographic Information System), sensors, and variable rate application equipment.

What is Variations between them?

In agriculture, variations between the target prescription and the actual application on the field refer to the differences or deviations between the recommended or desired agricultural practices and the real-world implementation.

These variations can manifest in various aspects, including the use of fertilizers, pesticides, irrigation, cultivation techniques, and more.

Factors Influencing Variations

Several factors contribute to variations between the target prescription and actual field application in agriculture:

  • Environmental Factors: Agricultural practices are influenced by dynamic environmental conditions, including soil composition, climate patterns, and water availability. Variations may arise due to unexpected changes in these factors, affecting the feasibility and effectiveness of prescribed practices.
  • Human Factors: The knowledge, skills, and expertise of farmers play a crucial role in implementing prescribed practices accurately. Variations can occur when farmers encounter challenges in understanding or interpreting the prescribed instructions, leading to deviations during the application.
  • Technological Limitations: Agricultural technology, while advanced, may not always be accessible or affordable to all farmers. Variations can arise when farmers do not have access to the latest equipment, precision farming tools, or real-time data, impacting the accuracy of field applications.
  • Timing and Logistics: Agriculture is time-sensitive, with specific windows for planting, harvesting, and applying agrochemicals. Variations may occur if farmers face logistical constraints, such as delays in procuring inputs or adverse weather conditions that disrupt the timely application of prescribed practices.

Conclusion

Variations between the target prescription and actual field application in agriculture present challenges that need to be addressed for sustainable and efficient farming practices. Understanding the factors contributing to these variations and their impact on agricultural outcomes is crucial.

Automated Field Boundaries Detection Model for Precision Agriculture by GeoPard

GeoPard have completed a successful development of an automated field boundaries detection model using mutli-year satellite imagery, accurate cloud and shadow detection, and advanced proprietary algorithms, including deep neural networks.

The GeoPard field detection model has achieved a state-of-the-art accuracy of 0.975 on the Intersection over Union (IoU) metric, validated across diverse regions and crop types globally.

Check out these images to see the results in Germany (average field size is 7 hectares):

1 - Raw Sentinel-2 image

1 – Raw Sentinel-2 image

3 - Segmented field boundaries

2 – Super-resolution Sentinel-2 image by GeoPard (1 meter resolution)

2 - Super-resolution Sentinel-2 image by GeoPard

3 – Segmented field boundaries, 0.975 Intersection over union (IoU) accuracy metric, across multiple international regions and crop types.


Integration into our API and GeoPard application is coming soon. This automated and cost-effective method helps predict yields, benefits governmental organizations, and assists large landowners who often need to update field boundaries between seasons.

GeoPard’s approach utilizes multi-year crop vegetation trends using multi-factor analysis and crop rotation.


The model is accessible via the GeoPard API on a pay-as-you-go basis, offering flexibility without the need for costly subscriptions.


What is Field Boundaries Delineation?

Field boundaries delineation refers to the process of identifying and mapping the boundary of agricultural fields or parcels of land. It involves using various techniques and data sources to demarcate the limits of individual fields or agricultural plots.

Traditionally, field boundaries were delineated manually by farmers or landowners based on their knowledge and observations.

However, with advancements in technology, particularly in remote sensing and geographic information systems (GIS), automated and semi-automated methods have become increasingly prevalent.

One common approach is the analysis of satellite or aerial imagery. High-resolution images captured by satellites or aircraft can provide detailed information about the landscape, including the boundaries between different land parcels.

Image processing algorithms can be applied to these images to detect distinct features such as changes in vegetation type, color, texture, or patterns that indicate the presence of field boundaries.

Another technique involves using LiDAR (Light Detection and Ranging) data, which uses laser beams to measure the distance between the sensor and the Earth’s surface.

LiDAR data can provide detailed elevation and topographic information, allowing for the identification of subtle variations in terrain that may correspond to field boundaries.

Additionally, geographic information systems (GIS) play a crucial role in delineation of field boundaries.

GIS software allows for the integration and analysis of various data layers, including satellite imagery, topographic maps, land ownership records, and other relevant information. By combining these data sources, GIS can aid in the interpretation and identification of field boundaries.

The accurate delineation of field is essential for several reasons. It facilitates better management of agricultural resources, enables precision farming techniques, and supports the planning and implementation of agricultural practices such as irrigation, fertilization, and pest control.

Accurate field boundary data also assists in land administration, land-use planning, and compliance with agricultural regulations.

How it is useful?

It plays a crucial role in agriculture and land management, providing several benefits and importance supported by evidence and global figures. Here are some key points:

1. Precision Agriculture: Accurate field boundaries help in implementing precision agriculture techniques, where resources such as water, fertilizers, and pesticides are precisely targeted to specific areas within fields.

According to a report by the World Bank, precision agriculture technologies have the potential to increase crop yields by 20% and reduce input costs by 10-20%.

2. Efficient Resource Management: It enables farmers to better manage resources by optimizing irrigation systems, adjusting fertilization practices, and monitoring crop health. This precision reduces resource wastage and environmental impact.

The Food and Agriculture Organization (FAO) estimates that precision agriculture practices can reduce water usage by 20-50%, decrease fertilizer consumption by 10-20%, and reduce pesticide usage by 20-30%.

3. Land Use Planning: Accurate field boundary data is essential for land use planning, ensuring efficient utilization of available agricultural land. It allows policymakers and land managers to make informed decisions regarding land allocation, crop rotation, and zoning.

This can lead to increased agricultural productivity and improved food security. A study published in the Journal of Soil and Water Conservation found that effective land use planning could increase global food production by 20-67%.

4. Farm Subsidies and Insurance: Many countries provide agricultural subsidies and insurance programs based on field boundaries. Accurate delineation helps in determining eligible land areas, ensuring fair distribution of subsidies, and calculating insurance premiums accurately.

For instance, the European Union’s Common Agricultural Policy (CAP) relies on accurate field boundaries for subsidy calculations and compliance monitoring.

5. Land Administration and Legal Boundaries: Field boundaries delineation in agriculture is crucial for land administration, property rights, and resolving land disputes. Accurate maps of field boundaries help establish legal ownership, support land registration systems, and facilitate transparent land transactions.

The World Bank estimates that only 30% of the world’s population has legally documented rights to their land, highlighting the importance of reliable field boundary data for secure land tenure.

6. Compliance and Environmental Sustainability: Accurate field boundaries aid in compliance monitoring, ensuring adherence to environmental regulations and sustainable farming practices.

It helps identify buffer zones, protected areas, and areas prone to erosion or water contamination, enabling farmers to take appropriate measures. Compliance with environmental standards enhances sustainability and reduces negative impacts on ecosystems.

According to the FAO, sustainable farming practices can mitigate up to 6 billion tons of greenhouse gas emissions annually.

These points illustrate its usefulness and importance in agriculture and land management. The evidence and global figures presented support the positive impacts it can have on resource efficiency, land use planning, legal frameworks, environmental sustainability, and overall agricultural productivity.

In summary, field boundaries delineation in agriculture is the process of identifying and mapping the boundary of agricultural fields or parcels of land. It relies on various techniques such as satellite imagery analysis, LiDAR data, and GIS to accurately define and demarcate these boundaries, enabling effective land management and agricultural practices.

Planet Imagery (daily, 3m resolution) for Management Zones Creation

Access to Planet imagery became simpler, faster, and more affordable with GeoPard Agriculture. Since August 2022 GeoPard has released the capabilities to search and analyze only requested Planet images from the user’s preferred date range.

So a GeoPard user requests only preferred Planet images and can use them in GeoPard analytical toolbox.

Planet images extend Sentinel and Landsat coverages (provided by default) and can be mixed with other data layers (harvesting/spraying/seeding machinery datasets, topography profile) via existing Multi-Layer, Multi-Year, and Equation tools


Planet Imagery for Management Zones Creation


Planet is the largest earth observation satellite network delivering a near-daily global dataset and enables its high-resolution and high-frequency satellite imagery data.

Management Zones Based on Planet Scope (3.5m resolution) imagery.

Read more about GeoPard / Planet Partnership.

What is Planet Imagery And Its Use for Management Zones Creation?

It refers to the satellite imagery provided by Planet Labs, a private company that operates a fleet of small satellites called Doves. These satellites capture high-resolution images of Earth’s surface on a daily basis. The term “3m resolution” means that each pixel in the image represents a 3×3 meter area on the ground. This level of detail allows for detailed analysis and monitoring of various features and changes on the Earth’s surface.

When it comes to management zones creation, Planet Imagery with daily 3m resolution can be highly beneficial for various industries and applications, such as:

  • Agriculture: High-resolution imagery can help in creating management zones in agriculture, where different areas of a field may require different treatments, like irrigation, fertilization, or pest control. By analyzing the imagery, farmers can identify patterns related to crop health, soil moisture, and other factors, enabling them to make better decisions about resource allocation.
  • Environmental management: Satellite imagery can be used to identify and monitor environmentally sensitive areas, such as wetlands, forests, and wildlife habitats. This information can be used to create management zones that protect these areas and ensure sustainable land use practices.
  • Urban planning: High-resolution imagery can help urban planners identify areas of growth, land use patterns, and infrastructure development. This information can be used to create management zones that guide future development and ensure efficient use of resources.
  • Disaster management: Satellite imagery can help in identifying and monitoring disaster-prone areas, such as floodplains or wildfire hotspots. Management zones can be created to establish evacuation routes, allocate resources for disaster response, and inform land use policies that minimize the risk of future disasters.
  • Natural resource management: High-resolution imagery can help in monitoring and managing resources like water, minerals, and forests. By identifying areas of high resource value or scarcity, management zones can be created to ensure the sustainable use and conservation of these resources.

In summary, Planet Imagery with daily 3m resolution is a valuable tool for creating management zones in various fields, providing up-to-date and detailed information that can help decision-makers optimize resource allocation and ensure sustainable land use practices.


Frequently Asked Questions


1. What can the use of imagery help establish?

The use of imagery can help establish a more efficient and effective farming system. By utilizing technologies like drones or satellite imaging, imagery can provide valuable insights into crop health, soil conditions, and irrigation needs.

It aids in identifying areas of concern, such as pest infestations or nutrient deficiencies, allowing farmers to take targeted actions. Furthermore, imagery helps in monitoring crop growth and development, enabling precise decision-making and maximizing yields. 

Equation-based Analytics in Precision Agriculture

With the release of the Equation-based analytics module, the GeoPard team has taken a big step forward in empowering farmers, agronomists, and spatial data analysts with actionable insights for each square meter. The module includes a catalog of over 50 predefined GeoPard precision formulas that cover a wide range of agriculture-related analytics.

The precision formulas have been developed based on multi-year independent agronomic university and industry research and have been rigorously tested to ensure their accuracy and usefulness. They can be easily configured to be executed automatically for any field, providing users with powerful and reliable insights that can help them to optimize their crop yields and reduce input costs.

The Equation-based analytics module is a core feature of the GeoPard platform, providing users with a powerful tool to gain a deeper understanding of their operations and make data-driven decisions about their farming practices. With the ever-growing catalog of formulas and the ability to customize formulas for different field scenarios. The GeoPard can meet the specific needs of any farming operation.


Potassium Removal based on Yield data

Potassium Removal based on Yield data


Use Cases (see examples below):

  • Nitrogen Uptake in absolute numbers using Yield and Protein data
  • Nitrogen Use Efficiency (NUE) and Excess calculations with Yield and Protein data layers
  • Lime recommendations based on pH data from soil sampling or soil scanners
  • Sub-field (zones or pixel-level ROI maps)
  • Micro and Macro nutrients fertilization recommendations based on Soil sampling, Field Potential, Topography, and Yield data
  • Carbon modeling
  • Change detection and alerting (calculate difference between Sentinel-2, Landsat8-9 or Planet imagery)
  • Soil and grain moisture modeling
  • Calculation of dry yield out of wet yield datasets
  • Target Rx vs As-applied maps difference calculation


Potassium Recommendations based on Two Yield Targets (Productivity Zones)

Potassium Recommendations based on Two Yield Targets (Productivity Zones)


Fertilizer: Recommendations Guide. Potassium / Corn.

Fertilizer: Recommendations Guide (South Dakota State University): Potassium / Corn. Review and Revision: Jason Clark | Assistant Professor & SDSU Extension Soil Fertility Specialist


Potassium Use Efficiency in Kg/Ha

Potassium Use Efficiency in Kg/Ha


Nitrogen Use Efficiency in percentage. Calculation is based on Yield, Protein and Grain Moisture data layers

Nitrogen Use Efficiency in percentage. Calculation is based on Yield, Protein and Grain Moisture data layers


Nitrogen: Target Rx vs As-Applied

Nitrogen: Target Rx vs As-Applied


Chlorophyll difference between two satellite images

Chlorophyll difference between two satellite images


A user of GeoPard can adjust existing and create their private formulas based on Imagery, Soil, Yield, Topography, or any other data layers GeoPard supports. 

Examples of the template GeoPard Equations

Examples of the template GeoPard Equations


Formula-based analytics helps farmers, agronomists, and data scientists to automate their workflows and make decisions based on multiple data and scientific research to enable easier implementation of sustainable and precision agriculture.

What is Equation-based Analytics in Precision Agriculture? The Use of Precision Formula

Equation-based analytics in precision agriculture refers to the use of mathematical models, equations, precision formula, and algorithms to analyze agricultural data and derive insights that can help farmers make better decisions about crop management.

These analytics methods incorporate various factors such as weather conditions, soil properties, crop growth, and nutrient requirements to optimize agricultural practices and improve crop yields, while minimizing resource waste and environmental impact.

Some of the key components of equation-based analytics in precision agriculture include:

  • Crop growth models: These models describe the relationship between various factors such as weather, soil properties, and crop management practices, to predict crop growth and yield. Examples of such models include the CERES (Crop Environment Resource Synthesis) and APSIM (Agricultural Production Systems sIMulator) models. These models can help farmers make informed decisions about planting dates, crop varieties, and irrigation scheduling.
  • Soil water models: These models estimate the water content in the soil profile based on factors such as rainfall, evaporation, and crop water use. They can help farmers optimize irrigation practices, ensuring that water is applied efficiently and at the right time to maximize crop yields.
  • Nutrient management models: These models predict nutrient requirements for crops and help farmers determine the optimal rates and timing of fertilizer application. By using these models, farmers can ensure that crops receive the right amount of nutrients, while minimizing the risk of nutrient runoff and environmental pollution.
  • Pest and disease models: These models predict the likelihood of pest and disease outbreaks based on factors such as weather conditions, crop growth stages, and management practices. By using these models, farmers can make proactive decisions about pest and disease management, such as adjusting planting dates or applying pesticides at the right time.
  • Remote sensing-based models: These models use satellite imagery and other remote sensing data to monitor crop health, detect stress factors, and estimate yield. By integrating this information with other data sources, farmers can make better decisions about crop management and optimize resource use.

In summary, equation-based analytics in precision agriculture uses mathematical models and algorithms to analyze complex interactions between various factors that affect crop growth and management. By leveraging these analytics, farmers can make data-driven decisions to optimize agricultural practices, improve crop yields, and minimize environmental impact.


Frequently Asked Questions


1. How can precision agriculture help address resource use and pollution issues in agriculture?

It can help address resource use and pollution issues in agriculture through targeted resource application, efficient resource management, enhanced monitoring, and the adoption of conservation practices. By applying inputs such as fertilizers and pesticides only where needed, farmers can reduce waste and minimize pollution.

Data-driven decision-making enables optimal resource management, while real-time monitoring allows for timely interventions to prevent pollution incidents. Additionally, the implementation of conservation practices promotes sustainable agriculture and reduces environmental impacts.

GeoPard Field Potential maps vs Yield data

GeoPard Field Potential maps very often look exactly like yield data.

We create them using multi-layer analytics of historical information, topography, and bare soil analysis.

The process of such synthetic Yield maps is automated (and patented) and it takes about 1 minute for any field in the world to generate it.


GeoPard Field Potential maps vs Yield data

Can be used as the basis for:

What are Field Potential maps?

Field potential maps, also known as yield potential maps or productivity potential maps, are visual representations of the spatial variability in potential crop yield or productivity within a field. These maps are created by analyzing various factors that influence crop growth, such as soil properties, topography, and historical yield data.

These maps can be used in precision agriculture to guide management decisions, such as variable-rate application of fertilizers, irrigation, and other inputs, as well as to identify areas that require specific attention or management practices.

Some key factors that are typically considered when creating field potential maps include:

  1. Soil properties: Soil characteristics such as texture, structure, organic matter content, and nutrient availability play a significant role in determining crop yield potential. By mapping soil properties across a field, farmers can identify areas of high or low productivity potential.
  2. Topography: Factors like elevation, slope, and aspect can influence crop growth and yield potential. For example, low-lying areas may be prone to waterlogging or have a higher risk of frost, while steep slopes may be more susceptible to erosion. Mapping these topographical features can help farmers understand how they affect productivity potential and adjust their management practices accordingly.
  3. Historical yield data: By analyzing historical yield data from previous years or seasons, farmers can identify trends and patterns in productivity across their fields. This information can be used to create these maps that highlight areas of consistently high or low yield potential.
  4. Remote sensing data: Satellite imagery, aerial photography, and other remote sensing data can be used to assess crop health, vigor, and growth stage. This information can be used to create these maps that reflect the spatial variability in crop productivity potential.
  5. Climate data: Climate variables such as temperature, precipitation, and solar radiation can also influence crop growth and yield potential. By incorporating climate data into these maps, farmers can better understand how environmental factors affect productivity potential in their fields.

They are valuable tools in precision agriculture, as they help farmers visualize the spatial variability in productivity potential within their fields. By using these maps to guide management decisions, farmers can optimize the use of resources, improve overall crop yields, and reduce the environmental impact of their agricultural operations.

Difference between Field Potential maps vs Yield data

Field potential maps and yield data are both used in precision agriculture to help farmers understand the spatial variability in their fields and make better-informed management decisions. However, there are some key differences between the two:

Data sources:

These maps are created by integrating data from various sources, such as soil properties, topography, historical yield data, remote sensing data, and climate data. However, this data is collected using yield monitors installed on harvesting equipment, which record the crop yield as it is harvested.

Temporal aspect:

These maps represent an estimation of the potential productivity of a field, which is generally static or changes slowly over time, barring significant changes in soil properties or other influencing factors. However, yield data is specific to a particular growing season or multiple seasons and can vary significantly from year to year based on factors like weather conditions, pest pressure, and management practices.

In summary, field potential maps and yield data are complementary tools in precision agriculture. These maps provide an estimate of the potential productivity of a field, helping farmers identify areas that may require different management practices. Yield data, on the other hand, documents the actual crop output and can be used to assess the effectiveness of management practices and inform future decision-making.

Vegetation Indices and Chlorophyll Content

GeoPard extends the family of supported chlorophyll-linked vegetation indices with

  • Canopy Chlorophyll Content Index (CCCI)
  • Modified Chlorophyll Absorption Ratio Index (MCARI)
  • Transformed Chlorophyll Absorption in Reflectance Index (TCARI)
  • ratio MCARI/OSAVI
  • ratio TCARI/OSAVI

They help to understand the current crop development stage including

  • identification of the areas with nutrient demand,
  • estimation of the nitrogen removal,
  • potential yield evaluation,

And the insights are used for precise Nitrogen Variable Rate Application maps creation.


Read More: Which index is the best to use in the precisionAg

Read More: GeoPard vegetation indices


Vegetation Indices and Chlorophyll Content
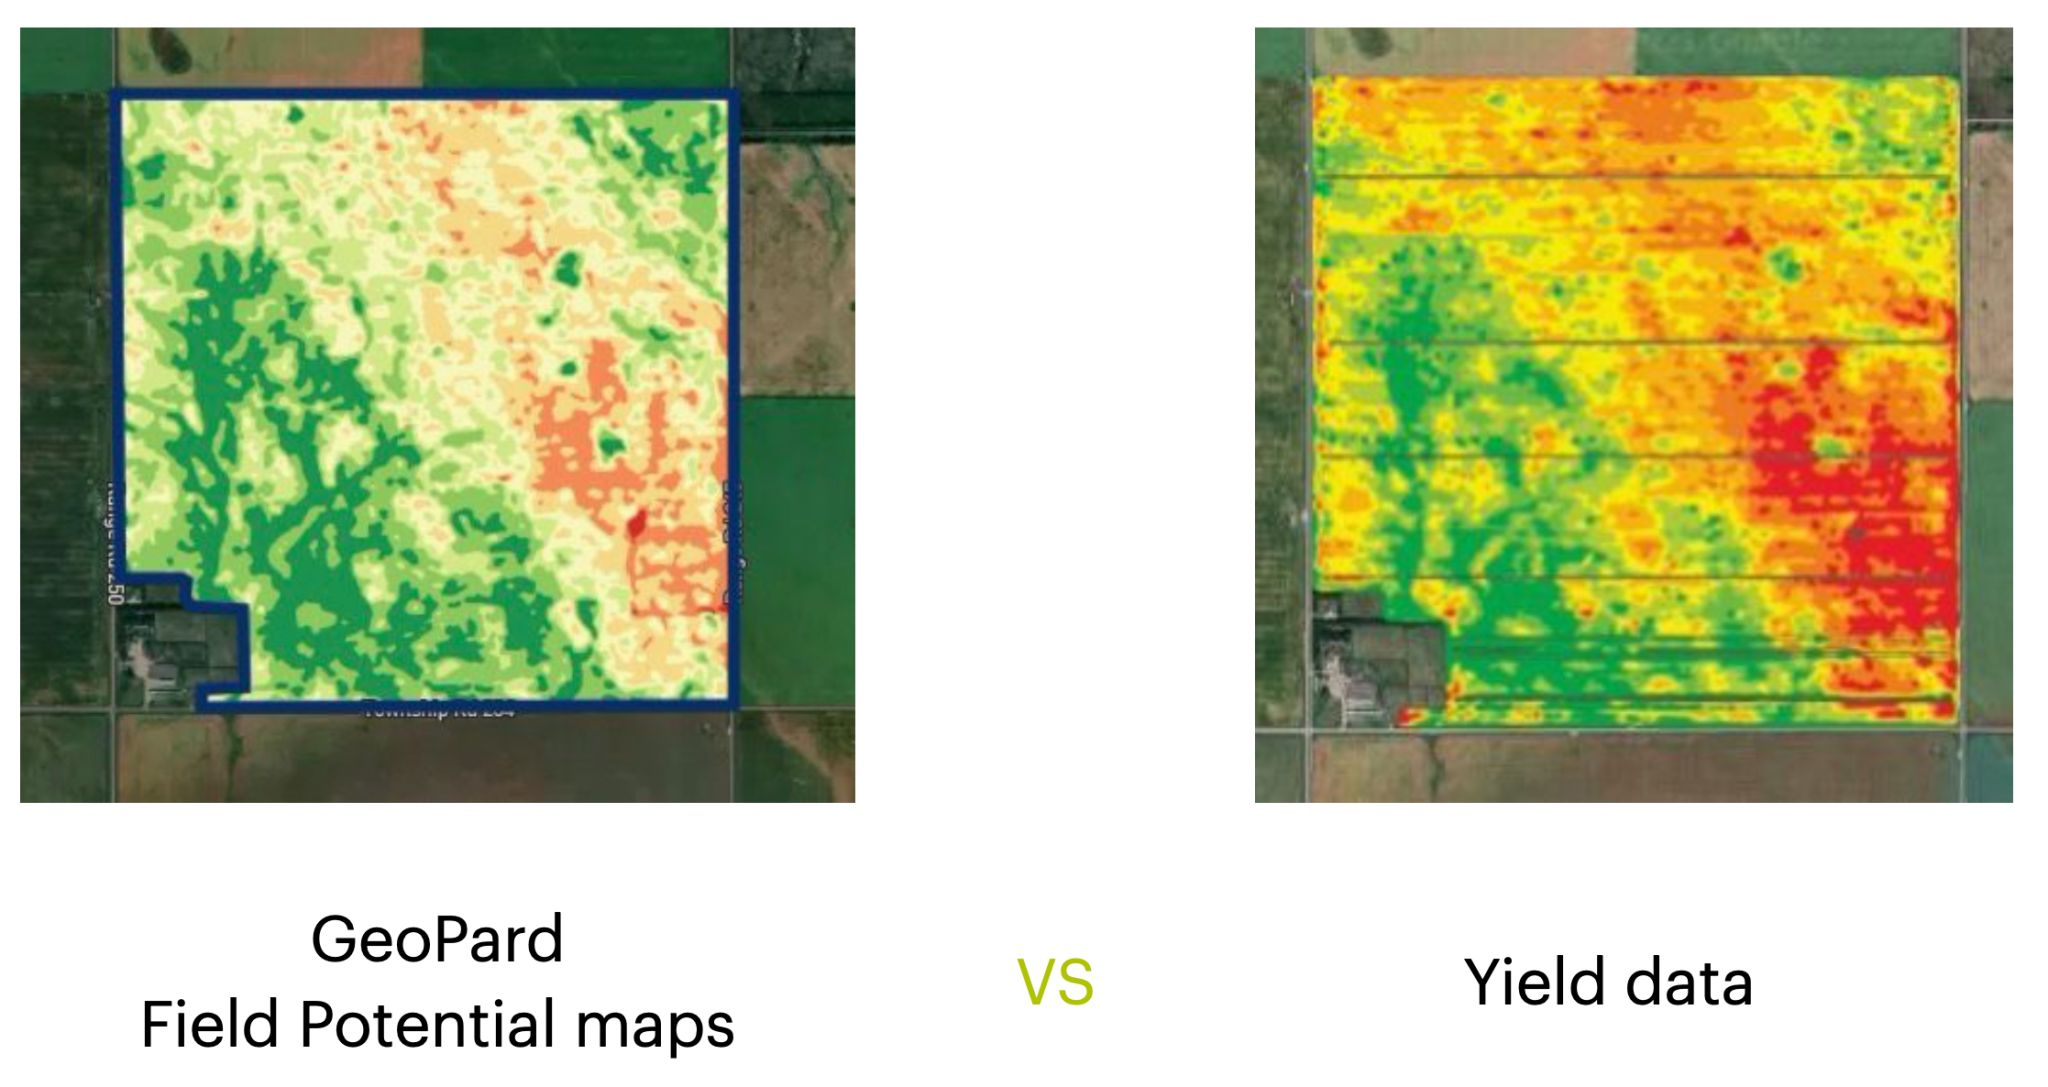
Canopy Chlorophyll Content Index (CCCI) vs Modified Chlorophyll Absorption Ratio Index (MCARI) vs Transformed Chlorophyll Absorption in Reflectance Index (TCARI) vs Ratio MCARI/OSAVI

What is Vegetation Indices?

Vegetation indices are numerical values derived from remotely sensed spectral data, such as satellite or aerial imagery, to quantify the density, health, and distribution of plant life on the Earth’s surface.

They are commonly used in remote sensing, agriculture, environmental monitoring, and land management applications to assess and monitor vegetation growth, productivity, and health.

These indices are calculated using the reflectance values of different wavelengths of light, particularly in the red, near-infrared (NIR), and sometimes other bands.

The reflectance properties of vegetation vary with different wavelengths of light, allowing for the differentiation between vegetation and other land cover types.

Vegetation typically has strong absorption in the red region and high reflectance in the NIR region due to chlorophyll and cell structure characteristics.

Some widely used vegetation indices include:

  • Normalized Difference Vegetation Index (NDVI): It is the most popular and widely used vegetation index, calculated as (NIR – Red) / (NIR + Red). NDVI values range from -1 to 1, with higher values indicating healthier and denser vegetation.
  • Enhanced Vegetation Index (EVI): This index improves upon NDVI by reducing atmospheric and soil noise, as well as correcting for canopy background signals. It uses additional bands, such as blue, and incorporates coefficients to minimize these effects.
  • Soil-Adjusted Vegetation Index (SAVI): SAVI is designed to minimize the influence of soil brightness on the vegetation index. It introduces a soil brightness correction factor, enabling more accurate vegetation assessments in areas with sparse or low vegetation cover.
  • Green-Red Vegetation Index (GRVI): GRVI is another simple ratio index that uses the green and red bands to assess vegetation health. It is calculated as (Green – Red) / (Green + Red).

These indices, among others, are used by researchers, land managers, and policymakers to make informed decisions regarding land use, agriculture, forestry, natural resource management, and environmental monitoring.

Normalized Difference Moisture Index

The number of vegetation indices supported by GeoPard is continuously growing. GeoPard team introduces the Normalized Difference Moisture Index (NDMI). The index determines vegetation water content and normalized difference water index (NDWI). It is useful for finding the spots with existing water stress in plants.

Lower NDMI values mark the spots where the plants are under stress from insufficient moisture.
On the other side, lower normalized difference water index values following the vegetation peak highlight the spots that are becoming ready for harvesting first.

The difference of the vegetation relative water content between two satellite images (Sentinel-2 constellation in this case)

The difference of the vegetation relative water content between two satellite images (Sentinel-2 constellation in this case)

In the following screenshots, you can find the NDMI zones generated based on June 19 (vegetation peak) and July 6 satellite images and the equation map representing the NDMI difference.

Normalized Difference Moisture Index calculated on top of Planet / Sentinel-2 / Landsat imageNDMI calculated on top of Planet / Sentinel-2 / Landsat image

What is Moisture Index?

It is a measure or calculation used to assess the moisture content or availability in a specific area or region. It is typically derived from various environmental factors such as precipitation, evapotranspiration, soil properties, and vegetation cover.

It provides a relative indication of the wetness or dryness of an area, helping to identify potential water stress or drought conditions.

It is a valuable tool for monitoring and managing water resources, agricultural planning, and understanding the ecological conditions of a particular region.

What is Normalized Difference Moisture Index?

Normalized Difference Moisture Index (NDMI) is a vegetation index derived from remote sensing data to assess and monitor the moisture content of vegetation. Like other vegetation indices, it is computed using spectral reflectance values from satellite or aerial imagery.

It is particularly useful in monitoring plant water stress, assessing drought conditions, estimating fire risk, and studying the impacts of climate change on vegetation.

It is calculated using the Near-Infrared (NIR) and Shortwave Infrared (SWIR) bands, which are sensitive to the moisture content in vegetation. The formula for NDMI is:

NDMI = (NIR – SWIR) / (NIR + SWIR)

NDWI values typically range from -1 to 1, with higher values indicating higher vegetation moisture content and lower values indicating lower moisture content or water stress in the vegetation. Negative NDMI values can be associated with non-vegetated areas or areas with very low moisture content.

What is NDWI?

NDWI, or Normalized Difference Water Index, is a remote sensing index used to quantify and assess water content or water-related features in vegetation or landscapes.

It is calculated by analyzing the reflectance of near-infrared and green light bands from satellite or aerial imagery. It is particularly useful for identifying water bodies, monitoring changes in water availability, and assessing vegetation health.

By comparing the absorption and reflection of different wavelengths, it provides valuable information for applications such as drought monitoring, hydrological analysis, and ecosystem management.

Visualization of NDMI to Determine Normalized Difference Water Index

Visualizing the NDMI involves processing satellite or aerial imagery, calculating the NDMI values, and then displaying the results as a color-coded map or image. Here are the general steps to visualize NDMI:

  • Acquire satellite or aerial imagery: Obtain multispectral imagery from a satellite or aerial platform, such as Landsat, Sentinel, or MODIS. Ensure that the imagery includes the necessary bands: Near-Infrared (NIR) and Shortwave Infrared (SWIR).
  • Pre-process the imagery: Depending on the data source, you may need to preprocess the imagery to correct for atmospheric, geometric, and radiometric distortions. Convert the digital numbers (DN) in the image to spectral reflectance values.
  • Calculate NDMI: For each pixel in the image, use the NIR and SWIR reflectance values to compute the NDMI using the formula: NDMI = (NIR – SWIR) / (NIR + SWIR).
  • Color mapping: Assign a color palette to the NDMI values. Typically, a continuous color scale is used, ranging from one color (e.g., red) for low NDMI values (indicating low moisture content) to another color (e.g., green) for high NDMI values (indicating high moisture content). You can use software like QGIS, ArcGIS, or programming libraries like Python’s Rasterio and Matplotlib to create a color map.
  • Visualize the NDMI map: Display the NDMI map or image using GIS software, a programming library, or an online platform. This will allow you to analyze the spatial distribution of vegetation moisture content and identify areas of water stress or high moisture.
  • Interpretation and analysis: Use the NDWI visualization to assess vegetation health, monitor drought conditions, or evaluate fire risk. You can also compare normalized difference water index maps from different time periods to analyze changes in vegetation moisture content over time.

Remember that different software tools or programming libraries may have slightly different workflows, but the overall process will be similar. Additionally, you can overlay other data layers, such as land use, elevation, or administrative boundaries, to enhance your analysis and better understand the relationships between vegetation moisture content and other factors. 

Topography based on machinery data

A lot of data collected from the fields is not used by farmers and agronomists. As an example, almost any modern machinery has a GPS receiver which is capable of gathering elevation data, quite often accuracy is improved with Real-time kinematic (RTK). 

Most of this data is not actively used, because it is quite a time consuming to extract, clean, and process this information to acquire real value out of it. One of the GeoPard main idea is to decrease the complexity of data usage in Precision Agriculture. 

GeoPard is capable of automatically extracting high-accuracy elevation data from:

  • Yield datasets
  • EC/other sensors datasets

GeoPard utilized the best available topography dataset for every field, but, unfortunately, high-accuracy lidar data is not available for every location in the world. Therefore, a machinery data-based digital elevation model will be a perfect option and significantly improves knowledge about the field. 

Henceforth, as any data layer in GeoPard, you can create zones out of machinery elevation data with Zones Creator, use this data in the Zones Ops module (finding of overlappings among different datasets) and use it in multi-layer analytics.

Note that it is also possible to compare remote sensing based VS machinery/RTK based topography models.

What are topographic equipment?

Topographic equipment refers to the specialized tools and instruments used in the field of topography, which is the study and mapping of the surface features of the Earth.

What are topographic equipment

These tools are designed to measure and record various aspects of the land’s topography, including elevation, slope, and contours. Here are some commonly used topographic equipment:

  • Total Station: A total station is an electronic surveying instrument that combines the functions of a theodolite (used for measuring horizontal and vertical angles) and an electronic distance meter (EDM) to measure distances. It is used for precise positioning and measuring angles and distances in topographic surveys.
  • GPS (Global Positioning System) Receiver: GPS receivers use signals from satellites to determine accurate positions on Earth’s surface. In topography, GPS receivers are used to establish control points and measure coordinates, which are crucial for creating accurate topographic maps.
  • Leveling Instrument: Leveling instruments, such as a dumpy level or digital level, are used to measure height differences or elevations between different points on the ground. They help in determining contours and slopes of the land.
  • LiDAR (Light Detection and Ranging): LiDAR is a remote sensing technology that uses laser light to measure distances and create detailed three-dimensional maps. It is commonly used in aerial or ground-based surveys to capture high-resolution elevation data.
  • Photogrammetric Equipment: Photogrammetry involves obtaining measurements from photographs. Specialized cameras, topographer machine, drones, or unmanned aerial vehicles (UAVs) equipped with high-resolution cameras are used to capture aerial images. Photogrammetric software is then used to process these images and extract topographic information.
  • Handheld GPS Devices: Handheld GPS devices provide accurate position data in real-time. They are portable and used for navigation, mapping, and data collection in the field.
  • Field Books and Measuring Tools: Field books are used by surveyors to record measurements, sketches, and notes during topographic surveys. Measuring tools like measuring tapes, ranging poles, and flagging tape are used for measuring distances and marking points of interest.

These are some of the essential topographic equipment used in the field. It’s important to note that technological advancements may introduce new tools or variations of existing equipment, so staying updated with the latest developments is recommended.

What is topographer machine?

A topographer machine, also known as a topographic surveying machine or a topographic mapping system, is a specialized tool used in agriculture for the precise measurement and mapping of the physical features of a field or agricultural land.

What is topographer machine in agriculture

It is designed to capture accurate elevation data and create detailed topographic maps that represent the terrain’s contours, slopes, and other essential characteristics.

The topographer machine typically consists of advanced surveying equipment, including Global Positioning System (GPS) receivers, laser scanners, LiDAR (Light Detection and Ranging) sensors, and onboard computers.

These components work together to collect precise location data and measure the elevation of various points across the agricultural land.

The machine is operated by agricultural professionals or trained technicians who deploy it in the field. As the topographer machine moves through the area, it uses GPS signals to determine its position and laser or LiDAR technology to measure the height of the terrain. The collected data is then processed and analyzed to create accurate topographic maps.

The generated topographic maps provide valuable information to farmers and land managers. They allow for better planning and management of agricultural activities, such as irrigation, drainage, and land leveling.

By understanding the topography of the land, farmers can optimize their farming practices, minimize soil erosion, and enhance overall crop productivity.

In conclusion, topographic equipment plays a vital role in accurately measuring and mapping the surface features of the Earth in the field of topography. The information gathered using these tools is crucial for creating detailed topographic maps, which in turn aid in effective land management, planning agricultural activities, and optimizing farming practices. 

wpChatIcon
wpChatIcon

    Request Free GeoPard Demo / Consultation


    By clicking the button you agree our Privacy Policy. We need it to reply to your request.

      Subscribe


      By clicking the button you agree our Privacy Policy

        Send us information


        By clicking the button you agree our Privacy Policy