Unbemannte Luftfahrzeuge (UAVs) oder Drohnen revolutionieren die moderne Landwirtschaft, indem sie schnelle Luftaufnahmen von Feldern ermöglichen. Sie werden eingesetzt, um Pflanzen hinsichtlich Gesundheit, Wachstumsstadium, Schädlingen, Unkraut und Ertragsprognosen zu untersuchen. In China sind beispielsweise bereits über 250.000 Agrardrohnen im Einsatz, und in Thailand sollten bis 2023 rund 301.000 Tonnen Ackerland per Drohne besprüht oder überwacht werden. Diese UAVs steigern die Effizienz der Landwirtschaft, indem sie Probleme (wie Schädlingsbefall oder Wassermangel) schnell erkennen, die am Boden übersehen werden könnten.
Kleine UAVs verfügen jedoch nur über sehr begrenzte Rechenleistung und Akkulaufzeit. Die Echtzeit-Ausführung komplexer KI-Bildverarbeitungsalgorithmen stellt daher eine Herausforderung dar. Herkömmliche, ressourcenschonende Objekterkennungsmodelle (wie die winzigen YOLO- oder MobileNet-basierten Detektoren) können diese Anforderungen nur teilweise erfüllen: Sie opfern oft Genauigkeit oder Geschwindigkeit und erfordern einen erheblichen manuellen Anpassungsaufwand. Diese Lücke motiviert die Entwicklung der einsatzorientierten neuronalen Architektursuche (NAS): eine automatisierte Entwurfsmethode, die Deep-Learning-Modelle exakt an die Anforderungen von im Feld eingesetzten UAVs anpasst.
Moderne Präzisionslandwirtschaft nutzt unbemannte Luftfahrzeuge (Drohnen) zur Feldkartierung und Überwachung des Pflanzenzustands. Durch Überflüge großer Flächen erfassen Drohnen hochauflösende Bilder von Pflanzen, Boden und Feldstrukturen. Diese Bilder werden Bildverarbeitungsalgorithmen zugeführt, die Unkraut zwischen den Kulturpflanzen erkennen, den Ertrag schätzen (z. B. durch Zählen von Früchten oder Ähren) oder frühe Anzeichen von Krankheiten oder Nährstoffmangel aufspüren. So ermöglichen Drohnen beispielsweise das gezielte Ausbringen von Herbiziden auf Unkrautflächen, wodurch der Chemikalieneinsatz und die Kosten reduziert werden.
Die kleinen Bordcomputer von Drohnen (oft nur mit wenigen Watt Leistung) haben jedoch Schwierigkeiten, große neuronale Netze bei Fluggeschwindigkeit auszuführen. Dies erschwert Echtzeitanalysen: Erkennt eine Drohne ein Problem, muss sie schnell reagieren oder die Daten protokollieren, bevor der Akku leer ist. Aktuelle Leichtbau-Detektoren (z. B. YOLOv8 nano, YOLO-tiny, MobileNets) werden manuell entwickelt und erfordern oft Kompromisse: Kleinere Modelle beschleunigen zwar die Verarbeitung, können aber die Genauigkeit beeinträchtigen.
Daher besteht ein dringender Bedarf an Methoden, die automatisch das bestmögliche Modell unter Berücksichtigung der Einschränkungen der Drohne finden. Einsatzorientierte neuronale Netzwerkarchitekturen (NAS) erfüllen diesen Bedarf, indem sie nach Architekturen suchen, die die Erkennungsgenauigkeit und den Ressourcenverbrauch (Latenz, Stromverbrauch, Speicher) unter realen Drohnenbedingungen gemeinsam optimieren. Dieser Ansatz ermöglicht die Bereitstellung spezialisierter Modelle, die effizient auf Drohnenhardware laufen und gleichzeitig für Aufgaben der Pflanzenüberwachung hochpräzise sind.
Anforderungen an die Objekterkennung durch unbemannte Luftfahrzeuge bei der Überwachung von Nutzpflanzen
Agrar-Drohnen erfüllen eine Reihe von visuellen Erfassungsaufgaben, von denen jede ihre eigenen Anforderungen stellt:
1. Erkennung von Pflanzengesundheit und Stress: Drohnen nutzen RGB-, Wärmebild- oder Multispektralkameras, um gestresste Pflanzen, Nährstoffmängel oder Krankheitssymptome zu erkennen. Echtzeit-Algorithmen erfassen die Variabilität im Feld und steuern so Bewässerung und Düngung. Die präzise Erkennung von Stressanzeichen ermöglicht rechtzeitige Maßnahmen zur Ertragssicherung.
2. Unkrautbestimmung: Die Erkennung von Unkraut zwischen Nutzpflanzen ermöglicht es Landwirten, nur unerwünschte Pflanzen zu besprühen und so Herbizide einzusparen. Beispielsweise erreichte eine Studie auf Baumwollfeldern mithilfe von UAV-Bildern und einem YOLOv7-basierten Detektor eine Genauigkeit von etwa 83% bei der Unterscheidung von Unkraut und Baumwolle. Dennoch bleibt die Unterscheidung von visuell ähnlichem Unkraut und Nutzpflanzen in unübersichtlichen Feldbildern schwierig.

3. Schädlings- und Krankheitserkennung: Drohnen können Schädlingsbefall (z. B. durch Heuschrecken, Insekten oder Pilzkrankheiten) früher erkennen als Menschen zu Fuß. Sie unterstützen zudem die Kartierung von Schädlingsgebieten mittels multispektraler Bildgebung, die eine Verbesserung gegenüber reinen RGB-Bildern darstellt. Eine schnelle und präzise Schädlingserkennung ist entscheidend, um die Ausbreitung zu verhindern.
4. Ertragsschätzung: Das Zählen von Früchten, Ähren oder Pflanzen aus der Luft hilft, Erntemengen vorherzusagen. Modelle, die darauf trainiert sind, Äpfel, Melonen oder Weizenähren auf Drohnenbildern zu erkennen, können die Ertragsschätzung beschleunigen. So wurden beispielsweise neuronale Netze auf Drohnenbildern eingesetzt, um Wassermelonen und Melonen auf Feldern zu zählen.
5. Vermessung und Kartierung: Drohnen erstellen außerdem Feldkarten (Topografie, Bodenbeschaffenheit), die bei der Anbauplanung helfen. Obwohl dies nicht im engeren Sinne der Objekterkennung dient, ist es dennoch Teil der UAV-Überwachung.
Diese Aufgaben erfordern oft eine nahezu Echtzeit-Datenverarbeitung: Eine Drohne, die über Felder fliegt, muss unter Umständen Videobilder in Echtzeit verarbeiten (mehrere Bilder pro Sekunde), damit Steuerungsentscheidungen (wie die Anpassung der Flughöhe oder die Aktivierung eines Sprühgeräts) sofort getroffen werden können. In anderen Fällen sind geringfügige Verzögerungen (Sekunden) akzeptabel, wenn die Daten erst nach der Landung protokolliert und analysiert werden.
Wichtig ist, dass die UAV-Bildverarbeitung mit variablen Umgebungsbedingungen zurechtkommt: helles Sonnenlicht, Schatten, windbedingte Bewegungsunschärfe, Verdeckung durch überlappende Blätter oder Änderungen von Höhe und Winkel. Da die Objektgrößen variieren (nahe Unkräuter vs. weit entfernte Schädlingsansammlungen), müssen die Detektoren Merkmale unterschiedlicher Größenordnungen erfassen.
Schließlich erfordern Drohneneinsätze in der Landwirtschaft einen strikten Kompromiss zwischen Genauigkeit, Latenz und Energieverbrauch. Eine hohe Erkennungsgenauigkeit ist notwendig, um Unkraut und Schädlinge nicht zu übersehen, doch ein sehr dichtes Netzwerk kann den Akku schnell entladen. Ein Erkennungsmodell muss daher schnell und energieeffizient, aber gleichzeitig präzise genug für die jeweilige Aufgabe sein. Diese hohen Anforderungen verdeutlichen, warum für Drohnen in der Landwirtschaft ein spezialisiertes Modelldesign erforderlich ist.
Leichte Objektdetektoren für UAV-Plattformen
Leichtgewichtige Objektdetektoren sind neuronale Netze, die speziell für den Einsatz auf leistungsschwacher Hardware entwickelt wurden. Sie verwenden häufig kleine Backbones (wie MobileNet oder ShuffleNet), reduzierte Schichtbreiten oder vereinfachte Hals-/Kopfstrukturen. Beispielsweise gibt es zur YOLO-Familie “Nano”- und “Tiny”-Versionen (z. B. YOLOv8n, YOLOv5s), die weniger Parameter besitzen und weniger Operationen (FLOPS) benötigen.
Solche Detektoren erreichen auf eingebetteter Hardware wie NVIDIA Jetson Nano oder Google Coral Bildraten von mehreren zehn Bildern pro Sekunde. Beispielsweise lief Ag-YOLO, ein speziell entwickelter, auf YOLO basierender Detektor für Palmölplantagen, mit 36,5 Bildern pro Sekunde auf einem Intel Neural Compute Stick 2 (bei einem Stromverbrauch von nur 1,5 W) und erzielte eine hohe Genauigkeit (F1 = 0,9205). Dieses Modell benötigte etwa zwölfmal weniger Parameter als YOLOv3-Tiny und war dabei doppelt so schnell.

Diese Beispiele verdeutlichen die Abwägungen beim Modelldesign: Die Reduzierung der Modellgröße oder -komplexität (z. B. durch weniger Schichten oder Kanäle) beschleunigt in der Regel die Inferenz und senkt den Energieverbrauch, kann aber die Genauigkeit verringern. Ag-YOLO opferte etwas Kapazität, um Geschwindigkeit und Effizienz zu steigern, erzielte aber dennoch einen hohen F1-Wert von 0,92 für seine Aufgabe.
Ebenso wurden drei YOLOv7-Varianten hinsichtlich ihrer Eignung zur Unkrauterkennung verglichen: Das vollständige YOLOv7 erreichte eine Genauigkeit von 83%, während ein kleineres YOLOv7-w6-Netz auf 63% abfiel. Dies verdeutlicht eine Einschränkung generischer, ressourcenschonender Detektoren: Modelle, die für eine bestimmte Umgebung oder einen bestimmten Objekttyp optimiert sind, können in anderen Umgebungen schlechter abschneiden. Ein auf Geschwindigkeit optimierter Detektor kann subtile Hinweise (z. B. kleine oder getarnte Unkräuter) übersehen, was seine Robustheit unter verschiedenen Bedingungen beeinträchtigt.
In der Landwirtschaft sind diese generischen, ressourcenschonenden Netzwerke ohne weitere Anpassungen möglicherweise nicht optimal. Beispielsweise kann ein auf gängigen Datensätzen vortrainiertes YOLOv7-Modell die spezifischen Texturen und Maßstäbe von Pflanzenbildern unter Umständen nicht perfekt verarbeiten. Daher ist eine aufgaben- und plattformspezifische Optimierung der Modellarchitektur erforderlich. Die manuelle Anpassung (Änderung von Schichten, Filtern usw.) für jeden neuen Drohnentyp oder jede neue Pflanzensorte ist sehr aufwendig. Dies motiviert den Einsatz automatisierter Methoden – wie beispielsweise einsatzbewusster Netzwerkassistenzsysteme (NAS) –, um das optimale Verhältnis von Größe, Genauigkeit und Robustheit für eine gegebene UAV-Plattform und landwirtschaftliche Anwendung zu finden.
Suche nach neuronalen Architekturen in UAV-basierten Bildverarbeitungssystemen
Die Suche nach neuronalen Architekturen (Neural Architecture Search, NAS) ist eine automatisierte Methode zum Entwurf von Architekturen neuronaler Netze. Anstatt die Anzahl der Schichten, Filter und Verbindungen manuell festzulegen, verwendet NAS Algorithmen (Reinforcement Learning, evolutionäre Methoden oder gradientenbasierte Suche), um einen Raum möglicher Designs zu durchsuchen und diejenigen zu finden, die ein gewähltes Ziel (wie z. B. Genauigkeit) optimieren.
NAS wurde bereits zur Entwicklung mobilfreundlicher Netzwerke eingesetzt. Googles MnasNet beispielsweise war ein wegweisendes “plattformbewusstes” NAS, das die tatsächliche Gerätelatenz direkt in die Zielsetzung einbezog. MnasNet maß die Inferenzzeit auf einem Google Pixel-Smartphone für jedes Kandidatenmodell während der Suche und gewichtete die Genauigkeit gegen diese gemessene Latenz. Das Ergebnis war eine Familie von CNNs, die auf mobiler Hardware sowohl schnell als auch genau waren und manuell entwickelte MobileNets- und NASNet-Modelle auf ImageNet übertrafen.
Generische NAS-Ansätze wie MnasNet konzentrieren sich jedoch auf allgemeine Bildverarbeitungsaufgaben (ImageNet-Klassifizierung oder COCO-Erkennung) und gängige Hardware (z. B. Mobiltelefone). Für die UAV-gestützte Pflanzenüberwachung ist das Problem spezialisierter. Wir benötigen Detektoren, die für spezifische Objektklassen (Pflanzen, Unkraut, Schädlinge) optimiert und auf die Sensoren und das Flugprofil der Drohne zugeschnitten sind. Ein Standard-NAS, das lediglich auf Genauigkeit oder allgemeine Latenz optimiert, kann Nuancen wie die Erkennung kleiner Objekte oder Energiebeschränkungen übersehen.
Herkömmliche NAS-Methoden sind zudem sehr rechenintensiv (oftmals tagelange Berechnungen auf großen GPU-Clustern), was für Agrarforscher nicht immer praktikabel ist. Daher werden aufgabenspezifische NAS-Frameworks für die UAV-Bildverarbeitung benötigt. Diese müssen UAV-relevante Kriterien berücksichtigen und so effizient wie möglich sein.
In allen Fällen ist die Berücksichtigung von Einschränkungen entscheidend: Das NAS muss die Einschränkungen des Zielgeräts (ähnlich wie MnasNet) und die Echtzeitanforderungen der UAV-Aufgaben im Flug kennen. Ist die Suche zu langsam oder ignoriert sie den Energieverbrauch, funktioniert das resultierende Modell in der Praxis möglicherweise nicht gut.
In der Praxis würde NAS für UAV-Vision Hardware-Latenz und Energieverbrauch direkt in die Suchmetrik einbeziehen. Beispielsweise könnte man die Bildrate eines Kandidatendetektors auf dem eigentlichen Drohnencomputer (wie einem NVIDIA Jetson) messen und als Bewertungskriterium verwenden. Dies steht im Gegensatz zur Verwendung einfacher Proxys wie FLOPs, die die reale Geschwindigkeit nicht erfassen.
Dadurch kann das NAS Architekturen ermitteln, die die Gerätefunktionen optimal nutzen. Zusammenfassend bietet das NAS eine Möglichkeit, Detektoren für UAVs automatisch zu entwerfen, muss aber an die spezifischen Aufgaben und Effizienzanforderungen von UAVs angepasst werden.
Einsatzfähiges NAS: Kernprinzipien
Einsatzorientierte NAS erweitert hardwareorientierte NAS, indem sie den Einsatzkontext und Umgebungsbedingungen in den Designprozess einbezieht. Das heißt, sie berücksichtigt nicht nur die Hardware der Drohne (CPU-/GPU-Geschwindigkeit, Speichergrenzen, Energiebudget), sondern auch die tatsächlichen Umgebungsbedingungen im Einsatz. Dies bedeutet die explizite Optimierung von Metriken wie Inferenzlatenz auf dem Zielgerät, Stromverbrauch und Speicherbedarf bei gleichzeitig hoher Erkennungsgenauigkeit.
Beispielsweise könnte man während der NAS jedes Kandidatenmodell auf einem an der Drohne befestigten Jetson Nano einsetzen und dessen tatsächliche Inferenzzeit und Energieverbrauch erfassen. Dieses empirische Feedback hilft dabei, die Suche auf Modelle auszurichten, die die Einsatzkriterien tatsächlich erfüllen.
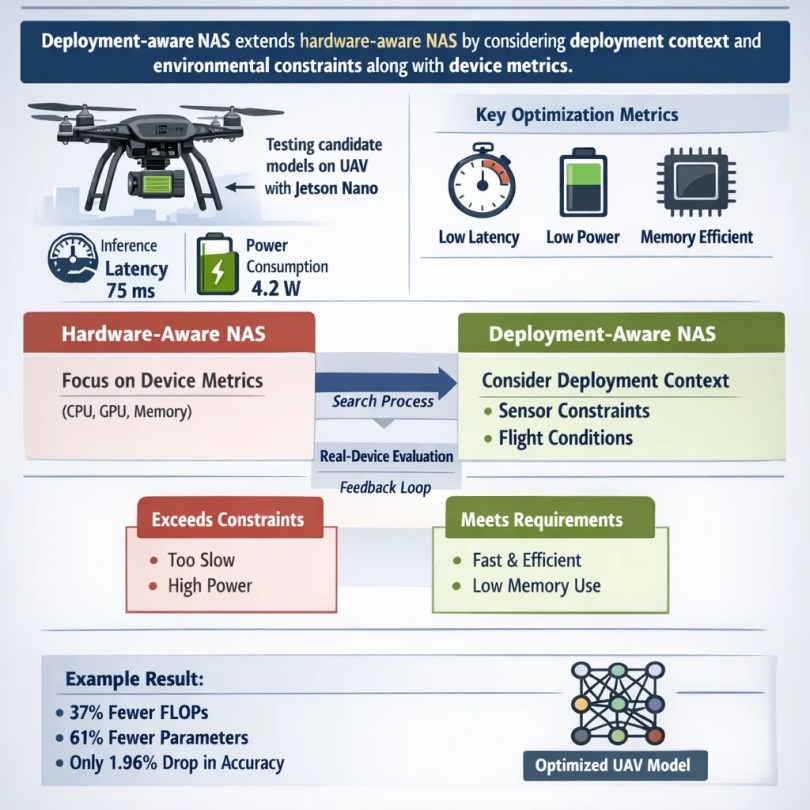
Hardwarebasierte NAS-Systeme (wie MnasNet) konzentrieren sich auf Gerätemetriken, während einsatzbasierte NAS-Systeme einen Schritt weiter gehen: Sie berücksichtigen Sensoreingabecharakteristika (z. B. Bildauflösung, multispektrale Kanäle) und Latenzziele der Anwendung (benötigte Bilder pro Sekunde). Sie können sogar Flugbeschränkungen wie maximal zulässigen Speicher einbeziehen oder Auswertungen unter simulierten Windbewegungen oder Bewegungsunschärfe durchführen.
Ein einsatzorientiertes NAS könnte Architekturen benachteiligen, die beispielsweise eine Leistungsaufnahme von über 5 W aufweisen oder mehr Speicher benötigen, als die Drohne zur Verfügung hat. Dadurch wird die Suche naturgemäß auf praxisnahe Modelle für den UAV-Einsatz im Feld ausgerichtet. Im Wesentlichen geht es bei einem einsatzorientierten NAS darum, den Kreislauf zwischen Modellentwicklung und realer Anwendung zu schließen. Anstatt eine Architektur isoliert auszuwählen und auf deren Funktionsfähigkeit zu hoffen, werden Tests mit realen Geräten systematisch in die Suche einbezogen.
Kerec et al. (2026) nutzten beispielsweise ein solches Framework zur Suche nach einem UAV-Detektor: Sie bauten auf einem YOLOv8n-Baseline-Modell auf, bezogen aber die Latenz und den Energieverbrauch des Jetson Nano in die Suche mit ein. Das resultierende Modell benötigte 37% weniger GFLOPs und 61% weniger Parameter als YOLOv8n, bei einem Rückgang der mittleren durchschnittlichen Reichweite (mAP) um lediglich 1,96%. Dies verdeutlicht, wie die Bereitstellungsbeschränkungen das NAS zu einem deutlich schlankeren und schnelleren Netzwerk führten.
Rolle von einsatzorientierten NAS in der Präzisionslandwirtschaftsüberwachung
Einsatzorientierte Netzwerkassistenzsysteme (NAS) können die Überwachung von Nutzpflanzen durch unbemannte Luftfahrzeuge (UAVs) erheblich verbessern, indem sie die Detektoren an die jeweiligen landwirtschaftlichen Bedingungen anpassen. Beispielsweise kann eine Suche Architekturen bevorzugen, die sich besonders gut für die Erkennung kleiner, dünner Objekte (wie schmale Unkräuter oder zarte Maiskeimlinge) oder für die Unterscheidung von Pflanzen und Boden eignen. Die Netzwerktiefe und die rezeptiven Felder können an die typische Flughöhe angepasst werden: In geringer Höhe füllen Objekte das Bild und erfordern möglicherweise feine Details, während das Netzwerk in größerer Höhe eine gute Erkennung im kleinen Maßstab ermöglichen sollte. Ein einsatzorientiertes NAS kann diese Anforderungen in seinen Suchraum integrieren.
Geschwindigkeit ist im Einsatz entscheidend. Stellen Sie sich vor, eine Drohne entdeckt einen Schädlingsbefall. Wenn das Modell schnell genug ist, um Videos beispielsweise mit 30 Bildern pro Sekunde zu verarbeiten, kann es den Piloten alarmieren oder sofort eine Bekämpfungsmaßnahme einleiten. In Tests lief ein von NAS entwickeltes Modell dank seiner optimierten Architektur auf einem Jetson Nano 28% schneller als der Standard-YOLOv8n. Es verbrauchte zudem unter ONNX-Bedingungen 18,5% weniger Energie, wodurch die Drohne mit demselben Akku länger fliegen kann. Diese Vorteile erleichtern Entscheidungen während des Fluges und verlängern die Einsatzdauer.
Robustheit ist ein weiterer Vorteil. Da die einsatzorientierte NAS-Technologie die tatsächliche Gerätebewertung umfasst, kann die Suche Tests unter verschiedenen Bedingungen beinhalten. Beispielsweise können Schwachlichtbedingungen simuliert oder Trainingsbilder aus der Dämmerung einbezogen werden, um sicherzustellen, dass der finale Detektor seine Genauigkeit auch bei realen Wetter- und Lichtveränderungen beibehält. Die Arbeit zeigte, dass der aus der NAS-Technologie abgeleitete Detektor gut generalisiert: Er wurde an zwei verschiedenen Datensätzen von Nutzpflanzen (Weizenähren und Baumwollkeimlinge) getestet und erzielte in beiden Fällen eine hohe Leistung.

Dies deutet darauf hin, dass einsatzorientiertes NAS dazu beigetragen hat, gemeinsame, nützliche Merkmale für die Landwirtschaft zu identifizieren und die Übertragbarkeit auf neue Anwendungsgebiete zu verbessern. Insgesamt trägt einsatzorientiertes NAS zu einem ausgewogenen Verhältnis zwischen Genauigkeit und längerer Flugzeit bei. Durch die Reduzierung des Rechenaufwands verbrauchen Drohnen weniger Energie und können pro Akkuladung eine größere Fläche abdecken, während sie gleichzeitig Pflanzen und Schädlinge zuverlässig erkennen.
Suchraumgestaltung für landwirtschaftliche UAV-Detektoren
Ein wichtiger Bestandteil von einsatzorientierten NAS ist der Suchraum – die Menge der möglichen Netzwerkdesigns, die berücksichtigt werden. Für UAV-gestützte Ernteüberwachungssysteme kann der Suchraum so gestaltet werden, dass er vielversprechende Architekturen für diesen Bereich umfasst. Wichtige Bestandteile sind:
1. Grundgerüstdesign: Das Rückgrat bildet der Merkmalsextraktor. Für UAVs könnten ressourcenschonende Faltungsbausteine wie tiefenseparable Faltungen (wie in MobileNet verwendet) oder invertierte Residualblöcke eingesetzt werden. Invertierte Residuale und lineare Bottlenecks (nach MobileNetV2) sind für ihre hohe Effizienz auf mobilen Geräten bekannt. Der Suchraum ermöglicht die Anpassung der Breite (Anzahl der Kanäle) und Tiefe jedes Blocks an das Rechenbudget der UAV. Auch Attention- oder Transformer-inspirierte Module könnten integriert werden, sofern die UAV diese bei geringem Energieverbrauch verarbeiten kann.
2. Halsdesign: Viele Objektdetektoren verwenden Feature-Pyramiden (FPN) oder Pfadaggregationsnetzwerke, um Merkmale unterschiedlicher Größenordnung zu kombinieren. Die Suche könnte vereinfachte FPNs oder ressourcenschonende Feature-Aggregationsverfahren untersuchen. Beispielsweise wären der Einsatz eines Single-Scale-Heads anstelle von Multi-Scale-Heads Optionen. Der Suchraum könnte Pooling-Layer oder Skip-Verbindungen ermöglichen, die die Erkennung von Objekten unterschiedlicher Größe erleichtern.
3. Kopfdesign: Der Erkennungskopf (Klassifizierungs- und Box-Regressionsschichten) kann ebenfalls variiert werden. Für UAVs, die homogene Felder absuchen, kann ein einfacherer Kopf ausreichen. Um jedoch kleine Unkräuter zu erfassen, kann die Suche zusätzliche Faltungsschichten oder andere Ankerschemata umfassen.
4. Leichte Betriebsabläufe: Der Suchraum kann explizit nur kostengünstige Operationen zulassen. Beispielsweise die Wahl zwischen einer 3×3-Faltung und einer günstigeren 1×3+3×1-faktorisierten Faltung oder die Einbeziehung von GhostNet-Modulen. Er kann auch kleine Kernelgrößen oder reduzierte Dimensionen zulassen, um den Rechenaufwand zu begrenzen. Alle diese Entscheidungen werden durch die Hardware bestimmt. Der Suchraum kann jede Schichtkonfiguration verbieten, die das Speicherlimit oder den erwarteten Energieschwellenwert der Drohne überschreitet.
Durch die sorgfältige Gestaltung dieses Suchraums wird der NAS-Prozess hin zu effektiven und gleichzeitig effizienten Architekturen gelenkt. Das Ergebnis könnte eine neuartige Kombination von Blöcken sein, die in Standardmodellen nicht berücksichtigt werden. Der beste gefundene Detektor nutzte benutzerdefinierte Blockauswahlen, die die GFLOPs um 37% und die Parameter um 61% im Vergleich zu YOLOv8n reduzierten.
Dies war möglich, da das NAS Backbone- und Head-Elemente unter Berücksichtigung der UAV-Beschränkungen flexibel kombinieren konnte. Zusammenfassend lässt sich sagen, dass der Suchraum für landwirtschaftliche UAV-Detektoren auf skalierbare, ressourcenschonende Bausteine und die Handhabung verschiedener Maßstäbe fokussiert ist – alles im Rahmen der Möglichkeiten der Bordhardware.
Optimierungsziele und -beschränkungen
Einsatzorientierte NAS-Systeme müssen mehrere Ziele gleichzeitig verfolgen. Das Hauptziel ist in der Regel die Erkennungsgenauigkeit (z. B. mittlere durchschnittliche Präzision, mAP), gemessen anhand von Datensätzen zur Pflanzenüberwachung. Beispielsweise ist mAP@50 (Genauigkeit bei 50% IOU) eine gängige Metrik. Das NAS-optimierte Modell wies im Vergleich zum Basismodell YOLOv8n lediglich einen Rückgang von 1,96% in mAP@50 auf – ein sehr geringer Verlust angesichts der erzielten Verbesserungen. Präzision und Trefferquote (bzw. F1-Score) für wichtige Klassen (Unkräuter, Nutzpflanzen) werden ebenfalls berücksichtigt.
Gleichzeitig müssen Latenz und Energieverbrauch optimiert werden. Die Latenz bezeichnet die Inferenzzeit pro Bild; bei einer eingebetteten GPU kann sie 20–50 ms oder mehr betragen. Geringere Latenz bedeutet höhere Bildraten. Der Energieverbrauch (Joule pro Bild) ist entscheidend für die Flugdauer. Der Speicherbedarf (Anzahl der Parameter, Modellgröße) ist eine weitere Einschränkung; Modelle müssen in den Arbeitsspeicher des Geräts passen. Daher legt NAS üblicherweise Zielwerte oder Strafen für diese Einschränkungen fest.
Beispielsweise können Modelle, die langsamer als ein bestimmter Schwellenwert sind oder ein Parameterbudget überschreiten, herabgestuft werden. Dadurch wird NAS effektiv zu einem multikriteriellen Optimierungsproblem: Maximierung der Genauigkeit bei gleichzeitiger Minimierung von Latenz, Energieverbrauch und Größe.
Praktisch ließe sich dies durch eine gewichtete Summe von Zielen oder durch harte Nebenbedingungen realisieren. Einige Methoden bestrafen Kandidaten, die die Leistungsgrenze der Drohne überschreiten, mit hohen Strafen. Andere berechnen explizit eine Energiemetrik: Modelle wurden unter ONNX-Laufzeitumgebung getestet, um die “Energieeffizienz” zu messen. Das beste Modell war um 18,51 TP3T energieeffizienter als YOLOv8n. Dies war eines der Ziele, die die Suche leiteten.
Die gefundenen Zielkonflikte lassen sich auf einer Pareto-Front visualisieren: An einem Ende befinden sich extrem schnelle, kleine Modelle mit geringerer Genauigkeit; am anderen Ende große, genaue Modelle, die für eine Drohne zu langsam oder zu energieintensiv sind. Einsatzorientierte NAS-Systeme zielen darauf ab, einen optimalen Punkt auf dieser Front zu finden, der den tatsächlichen Missionsprioritäten entspricht (z. B. ein geringer Genauigkeitsverlust für eine deutliche Beschleunigung). Zusammenfassend muss das NAS Genauigkeitsmetriken (mAP, F1) und Inferenzbeschränkungen (ms pro Frame, Joule pro Frame, Speicher) gleichermaßen berücksichtigen. Diese ausgewogene Optimierung macht ein Modell wirklich einsatzbereit für UAVs.
Schulung und Evaluierung in realistischen landwirtschaftlichen Umgebungen
Damit die von NAS entwickelten Detektoren optimal funktionieren, müssen sie mit realistischen Agrardaten trainiert und getestet werden. Dies bedeutet die Verwendung von Datensätzen, die die Variabilität realer Felder abbilden: verschiedene Pflanzenarten, Wachstumsstadien, Jahreszeiten, Lichtverhältnisse und Höhenlagen. Beispielsweise lassen sich Trainingsergebnisse, die ausschließlich auf Bildern junger Maiskeimlinge basieren, nicht auf reife Weizenähren übertragen. Feldrepräsentative Datensätze gewährleisten, dass das Modell die für den landwirtschaftlichen Betrieb relevanten Merkmale erlernt. Datenaugmentation (zufällige Pflanzenarten, Helligkeitsänderungen, Bewegungsunschärfe) kann während des Trainings ebenfalls angewendet werden, um Drohnenbewegungen und Lichtverhältnisse zu simulieren.

Bei der Evaluierung ist es wichtig, das Modell unter möglichst realen Bedingungen zu testen. Simulationstools können dabei hilfreich sein (z. B. das Fliegen einer virtuellen Drohne über 3D-Feldern), aber reale Flugtests sind der Goldstandard. Das Onboard-Benchmarking erfolgt durch Ausführen des Modells auf der tatsächlichen UAV-Hardware. Nach der NAS-Phase wurde der Kandidat auf einem Jetson Nano eingesetzt und eine um 28,11 TP3T schnellere Inferenz (verglichen mit dem Basismodell YOLOv8n) sowie ein geringerer Energieverbrauch gemessen. Dieses Feedback aus realen Geräten bestätigt, dass die Suche ein Modell hervorgebracht hat, das die Anforderungen tatsächlich erfüllt.
Generalisierung ist ebenfalls entscheidend. Ein Modell wird zwar möglicherweise für eine bestimmte Kulturpflanze (z. B. Weizen) entwickelt und trainiert, Landwirte benötigen jedoch Detektoren, die auf verschiedenen Anbauflächen funktionieren. Die Studie demonstrierte eine starke Generalisierungsfähigkeit über verschiedene Kulturpflanzen hinweg: Der auf einem NAS-Modell basierende Detektor, der für eine Aufgabe trainiert wurde, erzielte auch auf einem anderen Datensatz (Baumwollsetzlinge) ohne erneutes Training gute Ergebnisse. Dies deutet darauf hin, dass einsatzorientierte NAS-Architekturen robuste Ergebnisse liefern können. Domänenwechsel (z. B. von Maisfeldern zu Obstplantagen) können jedoch weiterhin eine Feinabstimmung oder weitere Recherchen erforderlich machen. Tests über verschiedene Jahreszeiten hinweg (Sommer- vs. Herbstbilder) werden ebenfalls empfohlen.
Abschließend sollte jedes neue Modell vor dem Einsatz auf der UAV-Plattform getestet werden. Dazu gehören die Erfassung von Genauigkeit und Geschwindigkeit im Drohnenbetrieb, die Sicherstellung einer sicheren Hardware-Überhitzung und die Überprüfung des Stromverbrauchs. Nur so können Landwirte dem System für missionskritische Überwachungsaufgaben vertrauen. Durch die Kombination von praxisnahen Schulungen und einer gründlichen Hardware-Evaluierung entstehen einsatzorientierte NAS-Detektoren, die nicht nur theoretisch effizient, sondern auch in der Praxis bewährt sind.
Vorteile gegenüber manuell konstruierten UAV-Detektoren
Einsatzorientierte NAS-Systeme bieten gegenüber herkömmlichen, manuell entworfenen Modellen für UAVs mehrere klare Vorteile:
1. Bessere Kompromisse bei der Leistung: Die vom NAS ermittelten Modelle bieten tendenziell eine höhere Kombination aus Genauigkeit, Geschwindigkeit und Energieeffizienz. Beispielsweise lief das beste Modell auf dem Jetson Nano 281 TP3T schneller und verbrauchte 18,51 TP3T weniger Energie als die manuell ausgewählte YOLOv8n-Baseline, während der Verlust an mAP bei der Detektion nur etwa 21 TP3T betrug. Ein solches Gleichgewicht manuell zu erreichen, wäre äußerst schwierig.
2. Verbesserte Generalisierung: Die von NAS ermittelten Modelle sind anpassungsfähiger an neue Bedingungen, da die Suche diverse Daten oder Ziele einbeziehen kann. Der automatisch entwickelte Detektor zeigte gute Ergebnisse bei verschiedenen Anbauarten (Weizen und Baumwolle) und Lichtverhältnissen. Diese hohe Robustheit ist entscheidend, wenn Flüge auf unerwartete Gegebenheiten treffen.
3. Reduzierter Entwicklungsaufwand: NAS automatisiert viele Versuche und Irrtümer. Anstatt Schichtgrößen manuell anzupassen und zahlreiche Kandidaten zu testen, erkundet ein einsatzorientiertes NAS iterativ die verschiedenen Optionen und findet das optimale Design für Ihre Anforderungen. Dies spart Entwicklungszeit und -aufwand und vereinfacht die Aktualisierung von Detektoren für neue Aufgaben oder Hardware.
4. Skalierbarkeit: Nach der Einrichtung lässt sich das NAS-Framework für verschiedene UAV-Plattformen oder Missionen nutzen. Beispielsweise kann dasselbe einsatzorientierte NAS durch einfaches Anpassen der Eingangsgrößen einen Detektor finden, der auf eine andere Kameraauflösung oder ein anderes Drohnenmodell abgestimmt ist. Dies ist deutlich skalierbarer als die Neuentwicklung von Netzwerken für jedes Szenario.
Herausforderungen und Einschränkungen
Bereitstellungsorientiertes NAS ist leistungsstark, aber kein Allheilmittel. Es muss sorgfältig eingesetzt werden, unter Berücksichtigung seines Ressourcenbedarfs und der Variabilität der Zielumgebung. Trotz seines Potenzials birgt bereitstellungsorientiertes NAS Herausforderungen:
1. Hohe Suchkosten: NAS kann einen erheblichen Rechenaufwand erfordern. Selbst mit effizienten Algorithmen kann die Suche im Architekturraum viele GPU-Stunden (oder spezialisierte Rechenleistung) in Anspruch nehmen. Wird der Suchaufwand nicht sorgfältig gemanagt, kann er für manche Teams prohibitiv sein.
2. Datenverzerrung und Domänenverschiebung: Die Leistungsfähigkeit des NAS hängt maßgeblich von den verwendeten Daten ab. Sind die Trainingsbilder nicht repräsentativ für die Feldbedingungen, kann die gefundene Architektur in der Praxis unterdurchschnittlich abschneiden. Beispielsweise lässt sich ein für eine bestimmte Kulturpflanze oder geografische Region optimiertes Modell ohne weitere Anpassung möglicherweise nicht perfekt auf andere Bereiche übertragen.
3. Hardwareheterogenität: UAV-Hardware gibt es in vielen Varianten (unterschiedliche eingebettete GPUs, CPUs, FPGAs). Ein für ein Board optimiertes Modell ist möglicherweise auf einem anderen nicht optimal. Bereitstellungsfähige NAS-Systeme müssen entweder für jede Plattform separate Suchvorgänge durchführen oder konservative, universell anwendbare Einschränkungen verwenden – was die Leistung beeinträchtigen kann.
4. Praktische Einschränkungen: Der praktische Einsatz von Drohnen in der Landwirtschaft bringt Herausforderungen mit sich, wie z. B. drahtlose Netzwerkaktualisierungen, Systemintegration mit der Flugsteuerung und Sicherheitszertifizierung. Selbst das beste NAS-Modell muss in ein vollständiges Drohnensystem integriert werden. Die Koordination von Modellaktualisierungen, behördlichen Genehmigungen und Schulungen für Landwirte stellt nicht-technische Hürden dar.
Zukünftige Ausrichtungen
Zukünftig dürfte die Integration von Modellentwicklung, Sensortechnik und UAV-Steuerung noch enger werden. Einsatzorientierte NAS-Systeme bleiben dabei ein Schlüsselinstrument. Mit Blick auf die Zukunft eröffnen sich mehrere vielversprechende Perspektiven:
1. Online- und adaptives NAS: Statt einer einmaligen Offline-Suche könnten zukünftige Systeme das Netzwerk in Echtzeit oder zwischen Flügen anpassen. Beispielsweise könnte eine Drohne mit einem Basismodell starten und sich mithilfe schlanker NAS-Algorithmen dynamisch an neue Licht- oder Geländebedingungen anpassen. Dieses “On-Device-NAS” ist zwar sehr anspruchsvoll, könnte die Anpassungsfähigkeit aber erheblich verbessern.
2. Gemeinsame Entwicklung von Sensoren und Modellen: Zukünftige Präzisionslandwirtschaftssysteme könnten die Kameraauswahl (RGB, Multispektral, Infrarot) und das neuronale Netzwerk gemeinsam optimieren. Einsatzorientierte neuronale Netze könnten Sensorparameter (wie die verwendeten Spektralbänder) in ihre Suche einbeziehen und so die optimale Kombination aus Hardware und Modell finden.
3. Multispektrale/hyperspektrale Integration: Wie die Studie zur Baumwollkrankheit nahelegt, kann die Integration multispektraler Bilddaten die Erkennung, insbesondere von Problemen im Frühstadium, verbessern. Zukünftige NAS-Systeme könnten Multistream-Modelle erforschen, die RGB- und Nahinfrarotkanäle kombinieren, um subtile Pflanzenveränderungen zuverlässiger zu erkennen.
4. Autonome Entscheidungsprozesse: Letztendlich könnten NAS-optimierte Detektoren zu vollständiger Autonomie beitragen. Beispielsweise könnte eine Drohne automatisch einen Sprühplan erstellen oder Betriebsleiter alarmieren, wenn sie bestimmte Bedingungen erkennt. Einsatzorientierte NAS-Systeme ließen sich auf durchgängige Prozesse (Erkennungs- und Aktionsmodelle) ausweiten und so das Gesamtsystem optimieren.
5. Ethische und ökologische Überlegungen: Mit zunehmender Leistungsfähigkeit von UAVs müssen wir Datenschutz, Luftraumsicherheit und Auswirkungen auf landwirtschaftliche Arbeitskräfte berücksichtigen (wie Agrawal & Arafat anmerkten). Die verantwortungsvolle Nutzung von NAS-optimierten Drohnen in der Landwirtschaft ist ein wichtiges Ziel für die Zukunft.
Schlussfolgerung
Einsatzorientiertes NAS stellt einen leistungsstarken Ansatz zur Anpassung ressourcenschonender Objektdetektoren für die UAV-gestützte Pflanzenüberwachung dar. Durch die Integration von UAV-Hardware und Missionsbeschränkungen in die Suche entstehen Modelle, die Rechenleistung und Energie sparen, ohne die Genauigkeit wesentlich zu beeinträchtigen. Beispielsweise zeigte eine aktuelle Studie, dass ein NAS-basierter Detektor 37% weniger FLOPs und 61% weniger Parameter als der Referenzdetektor YOLOv8n benötigt, dessen mittlere absolute Genauigkeit (mAP) jedoch nur um etwa 2% sinkt.
Auf der konkreten Drohnenhardware bedeutete dies eine um 28% schnellere Inferenz und eine um 18% höhere Energieeffizienz. Diese Verbesserungen führen zu längeren Flugzeiten, schnelleren Analysen und einer reaktionsschnelleren Unterstützung in der Landwirtschaft. Im Vergleich zu manuell erstellten Modellen bietet das einsatzorientierte NAS eine bessere Generalisierung der Leistung, einen geringeren manuellen Optimierungsaufwand und Skalierbarkeit auf neue UAV-Plattformen.
Im Kontext der Präzisionslandwirtschaft können diese Verbesserungen die Überwachung von Nutzpflanzen mittels UAVs praktischer und effektiver gestalten. Drohnen mit NAS-optimierten Detektoren erkennen Unkraut, Schädlinge und Stressfaktoren zuverlässiger und ermöglichen so rechtzeitige Eingriffe, die Ressourcen schonen und Erträge steigern. Da die Landwirtschaft zunehmend auf Drohnen und KI setzt, spielt ein einsatzorientiertes NAS eine zentrale Rolle, um sicherzustellen, dass die auf diesen Drohnen laufenden Modelle effizient, präzise und praxistauglich sind. Es schließt die Lücke zwischen modernster Forschung im Bereich neuronaler Netze und den praktischen Bedürfnissen der Landwirte und trägt so zur Weiterentwicklung der datengestützten Präzisionslandwirtschaft bei.