نماذج الذكاء الاصطناعي عالية الدقة تصنف الخرائط الطبوغرافية بشكل أسرع من الطرق التقليدية

Indonesia, a nation of over 17,000 islands spanning 1.9 million square kilometers, faces a critical challenge in creating detailed maps to support its development goals.

With only 3% of the country covered by large-scale topographic maps (1:5000 scale), traditional methods like manual stereo-plotting and field surveys are too slow to meet urgent needs for urban planning, disaster management, and environmental conservation.

A groundbreaking study published in الاستشعار عن بعد in 2025 offers a solution: a deep learning framework that automates land cover classification using very-high-resolution satellite imagery.

The Challenge of Mapping Indonesia’s تضاريس

Indonesia’s size and complexity make mapping a monumental task. The Geospatial Information Agency (BIG), responsible for national mapping, currently produces 13,000 square kilometers of topographic maps annually.

At this rate, mapping the entire country would take over a century. Even if forested areas—which cover nearly half of Indonesia—are excluded, completing the remaining terrain would still require 60 years.

This slow progress clashes with national priorities like the One Map Policy, introduced in 2016 to standardize maps across sectors and avoid conflicts in land use. Scaling this policy to 1:5000 maps is essential but far behind schedule.

Topographic maps are detailed representations of natural and human-made features on Earth’s surface, including elevation (hills, valleys), water bodies, roads, buildings, and vegetation.

They serve as foundational tools for infrastructure planning, disaster response, and environmental monitoring. For Indonesia, creating these maps at a 1:5000 scale (where 1 cm on the map equals 50 meters on the ground) is critical for precision in projects like road construction or flood modeling.

The Challenge of Mapping Indonesia’s Topography

Land cover data, a subset of topographic maps, refers to the physical material on Earth’s surface, such as forests, urban areas, or water. Unlike land use (which describes how humans utilize the land, e.g., residential or industrial zones), land focus on observable features.

Accurate land cover maps help governments track deforestation, monitor urban sprawl, or assess agricultural productivity. Traditionally, analysts manually label these features pixel by pixel using aerial photos or satellite images, a process that is both time-consuming and prone to human error.

For example, identifying roads or small buildings in dense urban areas can take days of meticulous work. The 2025 study addresses this bottleneck by replacing manual efforts with artificial intelligence, specifically deep learning, to automate land cover classification.

AI-Driven Satellite Imagery Analysis 

The research focused on Mataram City, a small but diverse urban area on Lombok Island, as a test case. The team used Pleiades satellite imagery from 2015, which included high-resolution panchromatic (0.5 meters) and multispectral (2 meters) data.

Panchromatic images capture fine spatial details in grayscale, while multispectral images provide color and infrared information across specific wavelength ranges (e.g., red, green, blue, near-infrared).

To combine these strengths, the researchers applied a technique called pan-sharpening, which merges the high-resolution grayscale data with lower-resolution color imagery. This process produced crisp, detailed images with a resolution of 0.5 meters, ideal for detecting small features like roads or individual buildings.

Pan-sharpening is vital because it retains the rich spectral information of multispectral data while enhancing spatial clarity, ensuring that colors align accurately with physical features.

Next, the team extracted additional information from the images to improve classification accuracy. They calculated the Normalized Difference Vegetation Index (NDVI), a measure of plant health derived from near-infrared (NIR) and red light reflection.

Healthy vegetation reflects more near-infrared light and absorbs more red light due to chlorophyll activity. The formula NDVI=(NIR−Red)/(NIR+Red) produces values between -1 and 1, where higher values indicate denser, healthier vegetation.

NDVI is invaluable for distinguishing forests, farmland, and urban green spaces. For instance, in this study, NDVI helped differentiate between lush plantations and bare soil.

Texture analysis was another key step. Using a statistical method called the Gray-Level Co-occurrence Matrix (GLCM), the researchers quantified patterns in the imagery, such as the roughness of agricultural fields versus the smoothness of paved roads.

GLCM works by analyzing how often pairs of pixels with specific values and spatial relationships (e.g., horizontally adjacent) occur in an image. From this matrix, metrics like homogeneity (uniformity of pixel values), contrast (local intensity variations), and entropy (randomness of pixel distribution) are calculated.

These texture metrics helped the AI model differentiate between similar-looking land cover types—for example, distinguishing between asphalt roads and dark soil patches.

To simplify the data, the team applied Principal Component Analysis (PCA), a technique that identifies the most significant patterns in a dataset. PCA reduces redundancy by transforming correlated variables (e.g., multiple texture bands) into a smaller set of uncorrelated components.

In this study, PCA condensed five texture bands into two principal components while retaining 95% of the original information. This streamlined the input for the deep learning model, improving both accuracy and computational efficiency.

U-Net Deep Learning for Land Cover تضاريس

The heart of the study was a deep learning model based on the U-Net architecture, a type of convolutional neural network (CNN) widely used in image segmentation tasks.

Named for its U-shaped design, U-Net consists of two main parts: an encoder that analyzes the image to extract hierarchical features (e.g., edges, textures) and a decoder that reconstructs the image with pixel-wise labels.

The encoder uses convolutional layers and pooling to downsample the image, capturing broad patterns, while the decoder upsamples the data to restore spatial resolution. Skip connections between encoder and decoder layers preserve fine details, enabling precise boundary detection—a critical feature for mapping narrow roads or irregularly shaped buildings.

Distribution of Land Cover Classes in Dataset

The model used a ResNet34 backbone—a pre-trained network renowned for its depth and efficiency. ResNet34 belongs to the residual network family, which introduces “shortcut connections” to bypass layers, mitigating the vanishing gradient problem (where deep networks struggle to learn due to diminishing updates during training).

By leveraging ResNet34’s ability to recognize complex patterns from ImageNet (a massive image database), the model required less training data and time to adapt to satellite imagery.

Training the model required 1,440 image tiles, each 512×512 pixels, covering six land cover classes: buildings, roads, agricultural land, bare land, plantations, and water bodies.

The dataset had inherent imbalances; roads and water bodies made up just 3.7% and 4.2% of the samples, respectively, while buildings and agricultural land accounted for over 25% each. Despite this challenge, the model was trained over 200 epochs—a balance between accuracy and computational cost—with a batch size of 2 due to memory constraints.

أن epoch refers to one complete pass of the training data through the model, while batch size determines how many samples are processed before updating the model’s parameters. Smaller batch sizes reduce memory usage but may slow training.

Enhancing Maps with Morphological Processing

Even the best AI models produce errors, such as misclassifying isolated pixels or creating jagged edges around features. To address this, the researchers applied morphological processing, a technique that smooths out imperfections using operations like erosion and dilation.

Erosion removes thin layers of pixels from object boundaries, eliminating tiny misclassified patches, while dilation adds pixels to expand object boundaries, filling gaps in linear features like roads.

These operations rely on a structuring element (a small matrix) that slides over the image to modify pixel values. The optimal kernel size for these operations (5×5 pixels) was determined through semi-variance analysis, a geostatistical method that quantified spatial patterns in the imagery.

Semi-variance measures how much pixel values differ at varying distances, helping identify the scale at which texture features (e.g., building clusters) are most distinct.

AI Boosts Mapping Speed and Accuracy

The model achieved an initial accuracy of 84% (kappa score = 0.79), which rose to 86% (kappa = 0.81) after post-processing. The kappa score (Cohen’s kappa) measures agreement between predicted and actual classifications, adjusting for random chance.

A score of 0.81 indicates “almost perfect” agreement, surpassing the 0.61–0.80 range considered “substantial.” Water bodies and plantations were classified with near-perfect accuracy (97% and 96%, respectively), while roads—challenged by their thin, linear shape and shadows—reached 85%.

AI Boosts Mapping Speed and Accuracy

Buildings and agricultural land also performed well, with F1-scores of 88% and 83%. The F1-score, a harmonic mean of precision and recall, balances false positives and false negatives, making it ideal for evaluating imbalanced datasets.

The efficiency gains were even more striking. Traditional stereo-plotting, which involves manually labeling features in 3D aerial imagery, takes nine days per map sheet (5.29 km²) for buildings and vegetation.

The AI-driven approach reduced this to 43 minutes per sheet—a 250-fold improvement. Training the model required 17 hours initially, but once trained, it could classify vast areas with minimal human intervention. Scaling this system could allow Indonesia to map 9,000 km² annually, cutting the projected completion time from over a century to just 15 years.

AI Mapping Advances Global Sustainability

The implications extend far beyond Indonesia. Automated land cover classification supports global efforts like the UN Sustainable Development Goals (SDGs). For instance, tracking deforestation (SDG 15) or urban expansion (SDG 11) becomes faster and more precise.

In disaster-prone regions, such as flood-prone areas, up-to-date maps can identify vulnerable communities and plan evacuation routes.

Farmers also benefit; accurate land cover data enables precision agriculture, optimizing water use and crop yields by monitoring soil health and vegetation stress via NDVI.

However, challenges remain. The model’s performance on underrepresented classes like roads highlights the need for balanced training data. Future work could incorporate transfer learning, a technique where a model pre-trained on one task (e.g., general image recognition) is fine-tuned for a specific application (e.g., road detection in satellite imagery).

This reduces the need for massive labeled datasets, which are costly to create. Testing advanced architectures like U-Net3+, which enhances feature aggregation across scales, or transformer-based models (which excel at capturing long-range dependencies in images) could further improve accuracy.

However, integrating Lidar (Light Detection and Ranging) or radar data could also enhance results, especially in cloudy regions where optical satellites struggle.

Conclusion: A New Era for Geospatial Science

This study marks a turning point in topographic mapping. By automating land cover classification, countries can produce accurate maps faster and cheaper than ever before. For Indonesia, this technology is not just a convenience—it’s a necessity to manage its rapid urbanization, protect its forests, and prepare for climate-related disasters.

As AI and satellite technology advance, the vision of real-time, high-resolution mapping is within reach, empowering governments and communities to build a more sustainable future.

المرجع: Hakim, Y.F.; Tsai, F. Deep Learning-Based Land Cover Extraction from Very-High-Resolution Satellite Imagery for Assisting Large-Scale Topographic Map Production. Remote Sens. 2025, 17, 473. https://doi.org/10.3390/rs17030473

The Secrets Behind Mastering Three-Dimensional Contour Maps

Three-dimensional contour maps are more than just lines on paper—they are gateways to understanding the shape of our world. These maps, which use curved lines to represent elevation, challenge us to imagine hills, valleys, and slopes in three dimensions.

For many, this skill feels intuitive, but for others, it requires careful practice. A 1998 study by Margaret Lanca explored how people mentally convert flat contour maps into vivid 3D landscapes, while also investigating whether men and women approach this task differently.

Recent advancements in technology and psychology have expanded our understanding of these processes, offering new insights into how we learn and remember terrain.

The Challenge of Reading Contour Maps

Contour maps are 2D diagrams that use lines (contours) to represent elevation. Each line corresponds to a specific height above sea level, and the spacing between lines indicates the steepness of a slope. For example, tightly packed lines suggest a cliff, while widely spaced lines represent flat terrain.

These maps are essential in fields like geography, geology, and urban planning because they provide a compact way to visualize complex landscapes.

However, interpreting them requires terrain visualization, the ability to mentally reconstruct a 3D model of the land from 2D lines.

The Challenge of Reading Contour Maps

Imagine looking at a series of concentric circles on paper and picturing them as a hill or a crater. This mental leap is not easy, and researchers have long debated how people achieve it.

Some argue that forming a 3D mental image is essential for accurate map reading. This process, often called spatial processing, involves mentally rotating or “slicing” the map to infer cross-sectional views of the terrain.

Others believe verbal-analytical strategies—such as memorizing labels (e.g., “peak” or “valley”) or analyzing slope angles step-by-step—can work just as well. Lanca’s study aimed to resolve this debate while also exploring gender differences in strategy use.

Science Behind Three-Dimensional Contour Map Interpretation

Three-Dimensional Contour Maps begin as 2D diagrams using lines (contours) to represent elevation. Each line corresponds to a specific height, with spacing indicating slope steepness.

Translating these 2D lines into a mental 3D landscape—Three-Dimensional Contour Map Visualization—is a complex cognitive skill.

Learners often struggle with this process, as it requires spatial reasoning to infer hills, valleys, and slopes from abstract lines. Prior research debated two strategies:

  1. Spatial Processing: Mentally rotating or “slicing” the map to construct a 3D model.
  2. Verbal-Analytical Processing: Using labels, step-by-step analysis, or mnemonics.

Lanca’s study sought to resolve whether Three-Dimensional Contour Map Visualization is essential for accuracy or if verbal strategies suffice. She also examined gender differences, given men’s historical edge in spatial tasks like mental rotation.

How the Study Was Conducted

Lanca recruited 80 participants—40 men and 40 women—from the University of Western Ontario. None had prior experience with contour maps, ensuring that the results reflected genuine learning rather than existing knowledge. The participants were divided into four groups.

  1. Contour → Contour: Studied 2D maps, recognized 2D maps.
  2. Contour → Landsurface: Studied 2D maps, recognized 3D landsurface maps.
  3. Landsurface → Landsurface: Studied 3D maps, recognized 3D maps.
  4. Landsurface → Contour: Studied 3D maps, recognized 2D maps.

The first group studied traditional 2D contour maps and later took a recognition test with the same type of maps. The second group studied 2D contour maps but were tested on 3D drawings called landsurface maps, which show terrain in a more visual, realistic style.

Map Study and Recognition Groupings

The third group studied landsurface maps and were tested on the same format, while the fourth group studied landsurface maps and were tested on 2D contour maps. Each participant completed two tasks.

First, they took a cross-section test. After studying a map for 40 seconds, they answered questions about the terrain’s profile along specific lines. For example, they might be shown three cross-sectional diagrams and asked which one matched a line drawn across the map.

Second, they took an incidental recognition test, where they viewed pairs of maps—one they had studied and one new—and identified the familiar one.

Reaction times and accuracy were recorded for both tasks. Afterward, participants described the strategies they used, such as mentally rotating the map or memorizing labels.

3D Visualization in Contour Map Findings

The results revealed clear patterns. Participants who studied 3D landsurface maps performed better on the cross-section test, scoring an average of 58% accuracy compared to 45% for those who studied 2D contour maps. This suggests that 3D visuals make it easier to infer the shape of the terrain.

However, reaction times were similar for both groups—around 10 seconds per question—indicating that once a map was understood, answering questions took the same effort regardless of format.

Gender differences emerged in the recognition tests. Men outperformed women when tested on the same format they had studied.

  • Contour → Landsurface Group: Men scored 62.5% (SD = 8.1) vs. women’s 47.5% (SD = 9.7).
  • Contour → Contour Group: Men recognized 84.2% (SD = 10.7) of maps vs. women’s 73.3% (SD = 17.5).

For example, men who studied 2D contour maps recognized 84% of them later, compared to 73% for women. Men also excelled when tested on 3D landsurface maps after studying 2D contour maps, scoring 63% accuracy versus 48% for women.

These differences suggest that men relied more on spatial processing, building 3D mental images, while women used verbal or analytical strategies. Post-test reports supported this: men described “imagining the entire hill and rotating it,” while women focused on “counting contour lines” or “naming valleys.”

Long-term memory also favored 3D processing. Men who used spatial strategies showed stronger recognition of maps they had answered correctly in the cross-section test.

For example, they recognized 74% of landsurface maps linked to correct cross-section answers, compared to 52% for incorrect ones. Women, however, showed no such difference, implying their strategies—while effective for the test—did not create lasting mental models.

Recent Advancements in Spatial Cognition and Technology

Since Lanca’s study, new research has deepened our understanding of how people visualize 3D maps. For instance, a 2021 meta-analysis confirmed that spatial skills can be improved with practice, reducing gender gaps.

Women who trained for 10 hours on mental rotation tasks improved their accuracy by 30–40%, showing that these skills are not fixed. Modern tools like virtual reality (VR) and augmented reality (AR) have also transformed map learning.

Recent Advancements in Spatial Cognition and Technology

A 2022 study found that students using VR to “walk through” terrain scored 65% higher on tests than those using traditional 2D maps. These tools allow users to interact with 3D landscapes, making abstract concepts like elevation and slope more tangible.

Advancements in artificial intelligence (AI) have further changed the field. Programs like Esri’s ArcGIS Pro now generate 3D terrain models from 2D contour maps in seconds, helping professionals predict flood risks or plan infrastructure without relying solely on manual visualization.

Brain imaging studies, such as a 2020 project using fMRI scans, have shown that spatial processing activates areas of the brain linked to spatial awareness, while verbal strategies engage regions associated with language. This aligns with Lanca’s findings that men and women often use different parts of the brain for the same task.

Gender Differences in Map Reading Strategies

The gender differences observed in Lanca’s study align with broader research on spatial cognition. Men often excel in tasks requiring mental rotation, such as imagining how an object looks when turned sideways.

This skill is closely tied to 3D visualization, which explains their advantage in recognizing maps. Women, on the other hand, tend to use verbal-analytical strategies, breaking down problems into smaller steps or relying on labels.

Both approaches worked for the cross-section test, but spatial processing gave men an edge in long-term memory. These differences are not about ability but about strategy.

For instance, a woman might excel at remembering the names of landmarks on a map, while a man might better recall the overall shape of a hill.

This has important implications for education and training. If instructors focus only on one method—say, spatial visualization—they might overlook students who thrive with verbal or analytical techniques.

Gender Differences in Map Reading Strategies

These differences are not about ability but about cognitive style, or preferred ways of thinking. However, they have real-world implications. A 2023 report found that women make up only 28% of the workforce in fields like geology and cartography, which rely heavily on spatial skills.

Organizations like Girls Who Code and GeoFORCE are working to bridge this gap by introducing young women to 3D visualization tools and spatial training programs.

Contour Map Applications in Education

Lanca’s findings, combined with modern technology, offer valuable lessons for educators and professionals. First, integrating 3D tools early in education can help beginners grasp contour maps faster.

For example, a geography teacher might show students a 3D model of a mountain before introducing its 2D contour map. Virtual reality apps now allow students to “explore” terrain in immersive environments, turning abstract lines into interactive landscapes.

Second, training programs should encourage multiple strategies. Spatial learners might benefit from exercises like mentally rotating maps or building clay models, while verbal learners could use mnemonics or descriptive labels. For instance, a simple phrase like “Close contours mean cliffs!” helps students remember how line spacing relates to slope steepness.

Third, addressing gender gaps in spatial training is crucial. Women entering fields like engineering or geology might benefit from early exposure to 3D tools. Activities like using AR apps to “walk through” virtual terrain can build confidence and spatial awareness.

Finally, professionals who rely on maps—such as surveyors or emergency responders—can improve their skills with mental rotation drills.

For example, visualizing how a hill would look from different angles enhances efficiency in tasks like flood modeling or disaster planning. In Bangladesh, emergency teams now use AI-powered 3D maps to predict flood patterns, reducing decision-making time by 40% during crises.

Limitations and Unanswered Questions

While Lanca’s study provided important insights, it had limitations. For example, all participants were novices, so experts like geologists might process maps differently due to years of experience.

Additionally, the 40-second study time per map does not reflect real-world learning, where people often spend hours analyzing terrain.

Recent research has explored these gaps. A 2021 study found that combining spatial imagery with verbal descriptions improved retention by 25% in geography students.

Another project in 2023 showed that older adults experience a 20% decline in mental rotation accuracy, highlighting the need for lifelong spatial training.

Interactive tools like VR are also being tested in classrooms, with early results showing that students learn contour maps 50% faster using immersive simulations compared to textbooks.

الخاتمة

Margaret Lanca’s research reminds us that contour maps are more than lines—they are invitations to explore the world in three dimensions. While spatial processing isn’t strictly necessary for basic tasks, it unlocks stronger memory and efficiency, especially in professions that depend on precise terrain analysis.

Gender differences in strategy underscore the importance of flexible teaching methods. By embracing 3D tools, encouraging diverse learning styles, and addressing gaps in spatial training, we can help everyone—from students to professionals—navigate the complexities of contour maps with confidence.

In a world where maps guide everything from hiking trails to disaster response plans, understanding how we think about terrain is as vital as the terrain itself. Whether you’re a visual learner who “sees” hills in your mind or an analytical thinker who breaks down slopes step-by-step, the goal remains the same: to turn lines on paper into a living, three-dimensional landscape.

المرجع: Lanca, M. (1998). Three-dimensional representations of contour maps. Contemporary educational psychology, 23(1), 22-41. https://doi.org/10.1006/ceps.1998.0955

كيف تعمل خوارزميات نظم المعلومات الجغرافية على أتمتة رسم الخرائط الطبوغرافية الرقمية

In today’s fast-paced digital world, the need for accurate and up-to-date topographic maps has never been greater. These maps—detailed representations of natural and human-made features on Earth’s surface—are essential for everything from urban planning and disaster management to agriculture and national security.

However, many countries, including Ukraine, struggle with outdated mapping systems that hinder progress. A recent study by Stadnikov and colleagues, published in 2025, explores how geoinformation technologies (GIT)—tools that collect, analyze, and visualize spatial data—can automate the creation and maintenance of digital topographic maps.

The Critical Need for Modern Topographic Maps

Topographic maps are more than just drawings of landscapes—they are vital tools for decision-making. These maps use contour lines, symbols, and colors to depict elevation, water bodies, roads, and vegetation, providing a 3D perspective of the terrain.

In Ukraine, over 70% of these maps date back to the Soviet era, designed primarily for military use. These outdated maps lack details crucial for modern needs, such as land elevation for flood modeling or property boundaries for urban development.

Even worse, less than 10% of maps have been updated in the last five years, despite a legal requirement to revise them every half-decade. This delay has real-world consequences.

For instance, outdated maps complicate efforts to rebuild war-damaged cities or predict landslides—natural disasters that occur when soil and rock slide down slopes—which cost Ukraine an estimated $200 million annually in infrastructure damage.

The study emphasizes that modernizing these maps is not just a technical upgrade but a necessity for economic and social stability.

What is Automated Digital Topographic Mapping 

Automated Digital Topographic Mapping refers to the use of advanced technologies and software systems to create, update, and maintain detailed representations of Earth’s surface features—such as elevation, terrain, water bodies, and human-made structures—with minimal human intervention.

Unlike traditional methods that rely on manual surveying and drafting, ADTM leverages advanced technologies—such as Geographic Information Systems (GIS), drones, LiDAR (Light Detection and Ranging), satellite imagery, and artificial intelligence (AI)—to generate highly accurate, dynamic, and scalable maps with minimal human intervention.

What is Automated Digital Topographic Mapping 

This approach is revolutionizing industries like urban planning, agriculture, disaster management, and national security. For instance, a 2023 report by the World Bank estimates that countries adopting ADTM have reduced map-update costs by 40–60% and accelerated project timelines by 70% compared to manual methods.

In Ukraine, where over 70% of topographic maps remain outdated, ADTM is seen as a critical tool for post-war reconstruction and economic recovery.

How Geographic Information Systems (GIS) Work

At the heart of modern cartography—the science and art of map-making—are Geographic Information Systems (GIS). These systems combine hardware, software, data, and methods to process spatial information, which refers to data linked to geographic locations. The research breaks down GIS into four key parts.

  1. First, hardware like drones (unmanned aerial vehicles, or UAVs), satellites, and high-resolution scanners collect raw data. Drones, for example, can capture detailed images of landscapes at a fraction of the cost of traditional methods.
  2. Second, software such as ArcGIS (a premium tool for complex modeling) or QGIS (a free, open-source alternative) processes this data, turning images into editable maps.
  3. Third, the data itself includes spatial details like coordinates and elevations, as well as attribute information—descriptive data such as land use, population density, or soil type.
  4. Finally, methodologies like vectorization—the process of converting raster images (pixel-based formats like JPEGs) into vector formats (editable paths and shapes)—and spatial analysis automate tasks that once required manual labor. Together, these components enable faster, more accurate map-making.

Overcoming Mapping Legal and Technological Barriers

Ukraine’s journey toward modern mapping is fraught with challenges. Strict laws, such as the 1998 Law on Topographic-Geodetic and Cartographic Activities—a regulation governing map creation and updates—require all mapping work to be registered with the StateGeoCadastre, Ukraine’s national geospatial authority.

While this ensures quality control, it also creates bureaucratic delays. Since 2022, martial law has added another layer of complexity: aerial surveys now require permits from the Security Service of Ukraine, a process that can take three to six months.

Additionally, access to the National Geospatial Data Infrastructure’s geoportals—online platforms hosting maps and spatial datasets—is restricted to verified users, limiting public participation.

On the technological front, government agencies often use incompatible software and classification systems. For example, one agency might use ArcGIS while another relies on AutoCAD Map, leading to 30% data duplication and wasted resources.

This fragmentation costs Ukraine an estimated $5 million annually in redundant fieldwork, where the same area is surveyed multiple times by different teams.

Drones Revolutionizing Topographic Data Collection

One of the study’s most promising findings is the use of drones, or unmanned aerial vehicles (UAVs), to collect data. UAVs are remotely controlled aircraft equipped with cameras or sensors.

Traditional methods like satellite imagery cost between 500 and 1,000 per square kilometer, but drones can achieve similar results for just 50 100. Some key findings include:

  • Optimal Image Overlap: Lopes Bento et al. (2022) found that a 70% lateral and 50% forward overlap in drone flights maintains accuracy while cutting flight time by 40%.
  • Oblique Photography: Cheng & Matsuoka (2021) demonstrated that combining vertical and 45-degree angled images improves 3D modeling of sloped terrain, reducing elevation errors to <1 meter.

Despite these advantages, drone usage in Ukraine remains limited. In 2023, only 15% of municipalities had permits for UAV-based surveys, largely due to wartime airspace restrictions. Expanding drone access could save millions and accelerate map updates.

Automating Maps to Minimize Errors

Automation—using technology to perform tasks with minimal human intervention—is a cornerstone of the study’s recommendations. By digitizing maps with 4,800 dpi (dots per inch) scanners, even the smallest details—like contour lines (lines connecting points of equal elevation) or property boundaries—are preserved.

Once digitized, GIS software can detect changes in new aerial imagery and update databases in real time. For example, a new building spotted in a drone photo can be added to the map within hours, a task that previously took weeks.

Automating Maps to Minimize Errors

Spatial analysis tools further enhance accuracy by calculating risks like floods or landslides with 95% precision, compared to 75% in manual methods. These tools use algorithms to simulate scenarios, such as how water might flow during heavy rain.

A pilot project in Odessa demonstrated these benefits: automated vectorization—converting scanned maps into editable vector layers—reduced labor costs by $12,000 per map sheet while improving detail. Automation doesn’t eliminate human input but redirects it toward strategic tasks like quality control.

Bridging Skill Gaps in Cartography

A significant barrier to modernization is the lack of trained personnel. A survey of Ukrainian cartographers revealed that 65% lack advanced GIS training, forcing many to rely on outdated tools like Global Mapper, a basic GIS software.

To bridge this gap, the study proposes certification programs and workshops. Partnering with universities to offer GIS courses could mirror successful models like the U.S. GIS Professional (GISP) certification—a credential validating expertise in spatial data management.

Hands-on training in free, open-source software like QGIS (Quantum GIS) would make these skills accessible to more people.

Uzbekistan’s experience serves as a model: after implementing similar training programs, the country boosted map-update efficiency by 50% within two years. Investing in education is not just about technology—it’s about empowering workers to drive change.

Furthermore, Ukraine’s collaboration with Norway’s Cartographic Service from 2018 to 2021 offers valuable lessons. The project, which cost 8 million, updated 1:50,000-scale national maps using NATO-standard symbols and a centralized cloud database.

A 1:50,000 scale means one unit on the map equals 50,000 units on the ground, providing a balance between detail and coverage. This approach reduced data duplication, saving 15 million in redundant costs.

Citizens also gained free access to maps for farming and disaster planning, fostering community engagement. While this partnership was a success, smaller-scale maps (1:500 to 1:5,000)—used for detailed urban planning—remain underfunded, relying on local budgets that often fall short.

Expanding such collaborations could help Ukraine standardize its mapping practices and secure international funding.

Economic Impact of Updated Topographic Maps

The benefits of modernizing topographic maps extend far beyond technical improvements. For instance, GIS models predicting landslide risks in the Carpathian Mountains—a region prone to soil erosion—could save $50 million annually in preventive measures.

Farmers in Cherkasy have already seen crop yields rise by 20% after using soil erosion maps to optimize land use. These maps identify areas where soil is losing fertility, allowing farmers to plant cover crops or rotate harvests.

In cities like Kharkiv, interactive 3D maps streamlined metro expansions, cutting planning time by six months. Post-war reconstruction efforts will rely heavily on updated maps to rebuild 12,000 destroyed buildings and de-mine 30% of agricultural land. These examples underscore how accurate maps can drive economic growth and improve quality of life.

الخاتمة

The study by Stadnikov and colleagues paints a clear picture: Ukraine’s mapping challenges are both technical and systemic. While drones, automation, and GIS offer powerful solutions, success depends on addressing deeper issues like funding shortages, bureaucratic delays, and skill gaps.

Centralizing data under unified standards could save $10 million annually, while easing drone restrictions would accelerate data collection. Public access to maps through open geoportals could empower citizens to contribute to community planning.

As the world increasingly relies on spatial data for climate action and smart cities—urban areas using technology to improve efficiency—Ukraine’s journey serves as a roadmap for other nations. By embracing innovation and institutional reform, the dream of real-time, error-free topographic mapping is within reach—and the rewards will be felt for generations.

مرجع Stadnikov, V., Likhva, N., Miroshnichenko, N., Kostiuk, V., & Dorozhko, Y. (2025). Exploring Geoinformation Technology Potential for Automating the Development and Maintenance of Digital Topographic Maps. African Journal of Applied Research, 11(1), 146-156.

خرائط الجهد الميداني لـ GeoPard مقابل بيانات المحصول

غالباً ما تبدو خرائط الجهد الميداني من GeoPard تمامًا مثل العائد بيانات.

نقوم بإنشائها باستخدام تحليلات متعددة الطبقات من المعلومات التاريخية والتضاريس وتحليل التربة العارية.

عملية مثل هذه خرائط العائد الاصطناعي مؤتمتة (ومسجلة ببراءة اختراع) ويستغرق الأمر حوالي دقيقة واحدة لأي حقل في العالم لتوليدها.


خرائط الجهد الميداني لـ GeoPard مقابل بيانات المحصول

يمكن استخدامها كأساس لما يلي:

ما هي خرائط الجهد الميداني؟

خرائط إمكانات الحقل، والمعروفة أيضاً بخرائط إمكانات المحصول أو خرائط إمكانات الإنتاجية، هي تمثيلات مرئية للتباين المكاني في إمكانات محصول المحاصيل أو إنتاجيتها داخل الحقل. تُنشأ هذه الخرائط من خلال تحليل عوامل مختلفة تؤثر على نمو المحاصيل، مثل خصائص التربة والتضاريس وبيانات المحصول التاريخية.

يمكن استخدام هذه الخرائط في الزراعة الدقيقة لتوجيه قرارات الإدارة، مثل تطبيق الأسمدة بمعدلات متغيرة، والري، والمدخلات الأخرى، وكذلك لتحديد المناطق التي تتطلب اهتمامًا خاصًا أو ممارسات إدارية محددة.

تتضمن بعض العوامل الرئيسية التي تؤخذ في الاعتبار عادةً عند إنشاء خرائط جهد المجال ما يلي:

  1. خصائص التربة: تلعب خصائص التربة، مثل الملمس والبنية ومحتوى المادة العضوية وتوافر العناصر الغذائية، دورًا هامًا في تحديد إمكانات إنتاجية المحاصيل. ومن خلال رسم خرائط لخصائص التربة في الحقل، يستطيع المزارعون تحديد المناطق ذات الإنتاجية العالية أو المنخفضة.
  2. تضاريستؤثر عوامل مثل الارتفاع والانحدار والاتجاه على نمو المحاصيل وإنتاجيتها. فعلى سبيل المثال، قد تكون المناطق المنخفضة عرضة لتشبع التربة بالمياه أو لخطر الصقيع، بينما تكون المنحدرات الشديدة أكثر عرضة للتآكل. ويمكن أن يساعد رسم خرائط هذه الخصائص الطبوغرافية المزارعين على فهم كيفية تأثيرها على الإنتاجية وتعديل ممارساتهم الزراعية وفقًا لذلك.
  3. بيانات الإنتاج التاريخية: من خلال تحليل بيانات المحاصيل التاريخية من السنوات أو المواسم السابقة، يستطيع المزارعون تحديد الاتجاهات والأنماط في إنتاجية حقولهم. ويمكن استخدام هذه المعلومات لإنشاء خرائط تُبرز المناطق ذات الإنتاجية العالية أو المنخفضة باستمرار.
  4. بيانات الاستشعار عن بعد: يمكن استخدام صور الأقمار الصناعية والصور الجوية وبيانات الاستشعار عن بعد الأخرى لتقييم صحة المحاصيل وحيويتها ومرحلة نموها. ويمكن استخدام هذه المعلومات لإنشاء خرائط تعكس التباين المكاني في إمكانات إنتاجية المحاصيل.
  5. بيانات المناخ: تؤثر المتغيرات المناخية، كدرجة الحرارة والهطول المطري والإشعاع الشمسي، على نمو المحاصيل وإنتاجيتها. وبدمج البيانات المناخية في هذه الخرائط، يستطيع المزارعون فهم كيفية تأثير العوامل البيئية على إنتاجية حقولهم بشكل أفضل.

تُعدّ هذه الخرائط أدوات قيّمة في الزراعة الدقيقة، إذ تُساعد المزارعين على تصوّر التباين المكاني في إمكانات الإنتاجية داخل حقولهم. وباستخدام هذه الخرائط لتوجيه قرارات الإدارة، يستطيع المزارعون تحسين استخدام الموارد، وزيادة غلة المحاصيل الإجمالية، والحدّ من الأثر البيئي لعملياتهم الزراعية.

الفرق بين خرائط الجهد الميداني وبيانات المحصول

تُستخدم خرائط إمكانات الحقول وبيانات المحصول في الزراعة الدقيقة لمساعدة المزارعين على فهم التباين المكاني في حقولهم واتخاذ قرارات إدارية أكثر استنارة. ومع ذلك، توجد بعض الاختلافات الرئيسية بينهما:

مصادر البيانات:

تُنشأ هذه الخرائط من خلال دمج بيانات من مصادر متنوعة، مثل خصائص التربة، والتضاريس، وبيانات المحاصيل التاريخية، وبيانات الاستشعار عن بُعد، وبيانات المناخ. وتُجمع هذه البيانات باستخدام أجهزة مراقبة المحاصيل المثبتة على معدات الحصاد، والتي تسجل محصول المحاصيل أثناء حصاده.

الجانب الزمني:

تمثل هذه الخرائط تقديرًا للإنتاجية المحتملة لحقل ما، وهي عادةً ما تكون ثابتة أو تتغير ببطء مع مرور الوقت، ما لم تحدث تغيرات كبيرة في خصائص التربة أو عوامل مؤثرة أخرى. ومع ذلك، فإن بيانات المحصول خاصة بموسم زراعي معين أو عدة مواسم، ويمكن أن تختلف اختلافًا كبيرًا من عام إلى آخر بناءً على عوامل مثل الظروف الجوية، وانتشار الآفات، وممارسات الإدارة الزراعية.

باختصار، تُعدّ خرائط إمكانات الحقول وبيانات المحصول أدوات متكاملة في الزراعة الدقيقة. تُقدّم هذه الخرائط تقديرًا للإنتاجية المحتملة للحقل، مما يُساعد المزارعين على تحديد المناطق التي قد تتطلب ممارسات إدارة مختلفة. أما بيانات المحصول، فتوثّق الناتج الفعلي للمحصول، ويمكن استخدامها لتقييم فعالية ممارسات الإدارة وتوجيه عملية اتخاذ القرارات المستقبلية.

التضاريس والمحتوى الغذائي في التربة والمحصول

تؤثر تضاريس الأرض والمناخ ونوع التربة بشكل كبير على محتوى المحاصيل من العناصر الغذائية. وقد ثبت أن لتضاريس التربة تأثيراً كبيراً على خصوبتها. كما أن انحدار المنحدر وميله بالنسبة للشمس يؤثران بشكل ملحوظ على كمية الحرارة الإشعاعية التي تتلقاها أي منطقة معينة، وكلما زاد هذا التأثير، زادت سرعة نمو النباتات. خصوبة التربة يعتمد نوع التربة بشكل كبير على تركيبها وبنيتها ونسيجها. فالتربة التي تحتوي على نسبة عالية من الرمل تكون عمومًا أكثر خصوبة من تلك التي تحتوي على كميات كبيرة من الطين؛ والتربة ذات النسيج المفكك أسهل في الزراعة من التربة المتماسكة؛ والتربة الرملية الطينية هي الأنسب لزراعة الحبوب لاحتوائها على كميات جيدة من الدبال. ويعتمد التركيب الكيميائي للتربة بشكل كبير على نوع الصخور التي اشتُقت منها. فالصخور الرملية والطينية عادةً ما تُكوّن تربة فقيرة، بينما تُكوّن الصخور الجيرية تربة طينية غنية مناسبة للزراعة. على سبيل المثال، ضع في اعتبارك ما يلي: تُتيح كميات الأمطار الغزيرة في المناطق الرطبة نشاطًا بيولوجيًا أكبر في التربة، مما يُسرّع من تحلل المواد العضوية إلى مغذيات التربة. كما تُسرّع درجات الحرارة المرتفعة عملية التحلل. ونتيجةً لذلك، تميل المحاصيل المزروعة في المناطق الرطبة إلى احتواء تركيزات أعلى من النيتروجين والمغذيات النباتية الأخرى مقارنةً بتلك المزروعة في المناطق الجافة. أما المحاصيل المزروعة في المرتفعات العالية، فعادةً ما تحتوي على تركيزات أقل من النيتروجين، نظرًا لانخفاض النشاط البيولوجي فيها، وانخفاض درجات حرارة الهواء فيها مقارنةً بالمناطق المنخفضة.

ما هي التضاريس؟

تعريفيشير علم التضاريس إلى دراسة ووصف السمات والخصائص الفيزيائية لسطح الأرض، بما في ذلك أشكالها الجغرافية، مثل الجبال والتلال والوديان والسهول والهضاب والمسطحات المائية كالأنهار والبحيرات والمحيطات. وهو يدرس ترتيب هذه السمات وارتفاعها وتوزيعها على سطح الأرض. ما هي التضاريس؟ يتضمن هذا المجال قياس ورسم خرائط المعالم الطبيعية والصناعية لمنطقة أو إقليم محدد. ويوفر معلومات تفصيلية عن شكل الأرض وتضاريسها وانحدارها، بالإضافة إلى موقع وامتداد المعالم الطبيعية والصناعية. تُنشأ الخرائط الطبوغرافية باستخدام مزيج من المسوحات الأرضية والتصوير الجوي وصور الأقمار الصناعية لتمثيل الخصائص ثلاثية الأبعاد لسطح الأرض بدقة على خريطة ثنائية الأبعاد. والغرض الأساسي منها هو فهم وتحليل الخصائص الفيزيائية لسطح الأرض، وهو أمر بالغ الأهمية لتطبيقات متنوعة. فعلى سبيل المثال، تلعب دورًا حاسمًا في تطوير الأراضي والتخطيط العمراني، إذ تساعد في تحديد المواقع المناسبة للبناء، وتقييم جدوى مشاريع البنية التحتية، وتحديد مناطق الفيضانات المحتملة. كما أنها حيوية في إدارة الموارد الطبيعية والدراسات البيئية والبحوث الجيولوجية، لأنها توفر معلومات قيّمة عن أنواع التربة وأنماط تصريف المياه وتوزيع الغطاء النباتي والتكوينات الجيولوجية. وتُستخدم الخرائط الطبوغرافية على نطاق واسع في تخصصات مثل الجغرافيا والجيولوجيا والهندسة المدنية وعلوم البيئة والتخطيط العمراني. فهو يسمح للعلماء والمهندسين والمخططين بفهم التضاريس، وتقييم تأثيرها على الأنشطة البشرية، واتخاذ قرارات مستنيرة بشأن استخدام الأراضي وإدارة الموارد وتطوير البنية التحتية.

لماذا تعتبر التضاريس مهمة جداً في الزراعة؟

تؤثر التضاريس على المناخ من خلال تأثيرها على أنماط الرياح والطقس. فعلى سبيل المثال، تحجب الجبال الهواء البارد عن الأرض الدافئة أسفلها، مما يؤدي إلى ارتفاع درجات الحرارة على أحد جانبي سلسلة الجبال مقارنةً بالجانب الآخر. كما تؤثر على الإنتاج الزراعي لأنها تؤثر على تدفق المياه في المنطقة. فعلى سبيل المثال، إذا تدفقت المياه بسرعة إلى أسفل التل، فقد تجرف معها مغذيات التربة أو تترك المحاصيل جافة جدًا بحيث لا تنمو بالشكل الأمثل (وذلك بحسب نوع المحاصيل). أما إذا تدفقت المياه ببطء، فإنها توفر الرطوبة للنباتات لفترة أطول، ولكنها تزيد أيضًا من التعرية بجرفها لجزيئات التربة. كذلك، تؤثر التضاريس على الإنتاجية الزراعية من خلال تحديد كمية ضوء الشمس التي تصل إلى النباتات في مختلف نقاط المنطقة. وبشكل عام، تتلقى المناطق المسطحة ضوء شمس أكثر من المناطق الجبلية، نظرًا لوجود عوائق أقل بين النباتات وأشعة الشمس التي قد تحجبها عن أوراقها. ولتضاريس المنطقة تأثير كبير على الأنشطة الزراعية التي يمكن ممارستها فيها. يُحدد المناخ، على وجه الخصوص، كمية المياه المتاحة لريّ المحاصيل وكمية الأمطار التي ستتلقاها مختلف مناطق البلاد. ويؤثر المناخ على الزراعة لأنه يُحدد ما إذا كانت منطقة ما ستكون أكثر رطوبة أو جفافًا من منطقة أخرى، وما إذا كان المزارع يرغب في زراعة محاصيل معينة. كما يؤثر المناخ على سهولة التنقل، مما قد يؤثر بدوره على أنواع المحاصيل المزروعة محليًا. فعلى سبيل المثال، إذا كانت هناك جبال أو تلال في منطقتك، فقد تُصعّب على المزارعين نقل منتجاتهم إلى السوق، لأنهم سيضطرون إلى قضاء وقت طويل في صعود ونزول سفوح التلال حاملين محاصيلهم. كما أن هذه التضاريس ستُعيق نقل منتجاتهم بالسرعة الكافية لتصل إلى المستهلكين في الوقت المناسب قبل أن تفسد. أهمية التضاريس في الزراعة يؤثر الموقع أيضًا على نوع المعدات والآلات الأنسب للمزرعة. فعلى سبيل المثال، غالبًا ما تكون المنحدرات شديدة الانحدار بحيث لا تستطيع الجرارات استخدام الأرض، مما يضطر المزارعين إلى الاعتماد على قوتهم البدنية لإنجاز العمل. كما يؤثر الموقع على مقدار العمل اللازم لإدارة المزرعة. فإذا كانت الأرض مستوية وناعمة، فلن يبذل العمال جهدًا كبيرًا للتنقل خلال موسم الزراعة أو الحصاد، أما إذا كانت الأرض جبلية أو غير مستوية، فسيتعين عليهم بذل المزيد من الطاقة للتنقل. ومن الأسباب الأخرى لأهمية الموقع في الزراعة أنه يؤثر على كمية الأمطار التي تتلقاها كل منطقة سنويًا. فإذا كانت المنطقة محاطة بالجبال، فإنها ستتلقى أمطارًا أكثر من المناطق ذات الأراضي المستوية، وذلك لأن السحب تتشكل فوق الجبال وتطلق مياهها في تلك المناطق، مما يجعلها أكثر رطوبة من المناطق المحيطة بها. ويستخدم علماء الأحياء النباتية الموقع كأحد العوامل في تحديد الموطن الأصلي للنباتات، أو الأماكن التي قد تزدهر فيها وتنمو إذا زُرعت في مكان آخر. ويشمل ذلك محاصيل مثل القمح والذرة التي تُزرع على نطاق واسع في جميع أنحاء العالم.

كيف يؤثر ذلك على التربة؟

تخضع خصائص التربة لخمسة عوامل متميزة، وإن كانت مترابطة، وهي: المادة الأم، والمناخ، والكائنات الحية، والزمن، وذلك وفقًا لدراسات التربة. ويُطلق علماء التربة على هذه العوامل اسم عوامل تكوين التربة. وتتميز خصائص التربة بتنوعها. المادة الأصلية المادة التي تنشأ منها التربة تُعرف باسم المادة الأم، وقد تكون صخرة تفتتت في مكانها أو مادة ترسبت بفعل الرياح أو الماء أو الجليد. تُعد خصائص المادة الأم وتركيبها الكيميائي من العوامل الأساسية في تحديد جودة التربة، خاصةً خلال المراحل الأولى من تكوينها. التربة المتكونة على مادة أم خشنة الحبيبات، والتي تتكون من معادن مقاومة للعوامل الجوية، غالبًا ما تكون ذات نسيج خشن الحبيبات. أما عندما تتكون المادة الأم من معادن غير مستقرة تتآكل بسرعة، تتشكل تربة ناعمة الحبيبات. يتأثر التركيب الكيميائي للتربة وخصوبتها بشكل مباشر بتركيب المادة الأم. المواد الأم الغنية بالكالسيوم والمغنيسيوم والبوتاسيوم والصوديوم تذوب بسهولة في الماء وتصبح متاحة للنباتات. في المناطق الرطبة، يحتوي كل من الحجر الجيري والحمم البازلتية على كمية كبيرة من القواعد الذائبة، مما يُشكل تربة خصبة. إذا كانت المواد الأم فقيرة بالأيونات الذائبة، فإن الماء المتدفق عبر التربة يزيل القواعد ويستبدلها بأيونات الهيدروجين، مما يجعل التربة حمضية وغير صالحة للزراعة. تتميز التربة المتكونة على الحجر الرملي بانخفاض محتواها من القواعد القابلة للذوبان وبنيتها الخشنة، مما يُسهّل عملية غسلها. ومع تحوّل المادة الأم وازدياد أهمية المناخ، يميل تأثيره على خصائص التربة إلى التضاؤل بمرور الوقت. مناخ ترتبط التربة، وخاصة على المستوى العالمي، ارتباطاً وثيقاً بالمناخ. وتتأثر التفاعلات الفيزيائية والكيميائية في المادة الأم بشكل كبير بالطاقة وهطول الأمطار. كما يؤثر المناخ على الغطاء النباتي، مما يؤثر بدوره على تكوين التربة. كيف تؤثر التضاريس على التربة؟ يؤثر هطول الأمطار على عناصر تكوين طبقات التربة، مثل انتقال الأيونات الذائبة عبرها. وقد ازداد تأثير المناخ على خصائص التربة مع مرور الوقت، بينما تراجعت أهمية المادة الأم. تضاريس نظرًا لتأثيرها على جريان المياه واتجاهها الذي يؤثر على المناخ المحلي، والذي بدوره يؤثر على النباتات، فإن لها تأثيرًا كبيرًا على تكوين التربة. وللسماح بحدوث عمليات طبقات التربة، يجب أن تبقى المادة الأم غير مضطربة نسبيًا. يؤدي جريان المياه على السطح إلى إزالة المادة الأم، مما يمنع نمو التربة. وعلى المنحدرات الأكثر انحدارًا وغير المغطاة بالنباتات، يكون التعرية المائية أكثر فعالية. الكائنات الحية تلعب الكائنات الحية النباتية والحيوانية دورًا أساسيًا في تكوين التربة وتركيبها. فهي تُسهم في عمليات التحلل والتجوية وتدوير العناصر الغذائية من خلال إضافة المواد العضوية. ويؤثر المناخ على ثراء وتنوع الكائنات الحية في التربة والنباتات التي تنمو على سطحها. وقت تستمر آليات التجوية في التأثير على المادة الأم للتربة بمرور الوقت، فتُفتتها وتُحللها. وتستمر عمليات تكوين الطبقات في تمييز الخصائص الفيزيائية والكيميائية لطبقات قطاع التربة. ونتيجةً لذلك، تتميز الترب القديمة والناضجة بتسلسل طبقات متطور، بينما قد تتعرض بعضها للتجوية والترشيح لدرجة يصعب معها تمييز الطبقات بوضوح. وهذه سمة مميزة للأوكسيسولات. تمنع بعض العمليات الجيولوجية تكوين التربة من خلال تعديل سطحها باستمرار، مما يحول دون تجوية المادة الأم لفترة طويلة. فعلى سبيل المثال، يؤدي تآكل سفوح التلال إلى إزالة المواد بانتظام، مما يعيق نمو التربة. كما تترسب رواسب جديدة بشكل متكرر على طول مجاري الأنهار مع تدفق مياه النهر إلى سهوله الفيضية أثناء الفيضانات. وتُستأنف عملية تكوين التربة بإضافة مواد جديدة باستمرار. وخلال عملية نمو التربة، يتفاعل المناخ والزمن. فدرجات الحرارة الدافئة والممطرة تُسرّع من نمو التربة، مما يسمح لها بالوصول إلى مرحلة النضج في وقت أقرب. بينما تتباطأ التجوية في المناخات الباردة، ويستغرق نمو التربة وقتًا أطول بكثير. يُعدّ GeoPard طريقة جديدة ومبتكرة لاستكشاف خصائص التربة والتضاريس لاتخاذ قرارات أفضل وتطوير المحاصيل. فهو يرتقي برسم خرائط التربة إلى مستوى جديد من خلال تزويدك بمعلومات دقيقة حول أنواع التربة, جودة التربة، ومدى ملاءمة المحاصيل. سيساعدك GeoPard على اتخاذ قرارات مدروسة بشأن مزرعتك، وكأن لديك مهندسًا زراعيًا في متناول يدك. يستخدم GeoPard تقنية متطورة تتيح لك جمع البيانات في الموقع، والتي يمكنك استخدامها لإنشاء خرائط فريدة لمزرعتك. ستوضح لك هذه الخرائط بدقة أماكن زراعة محاصيلك لتحقيق أقصى إنتاجية. يمتلك GeoPard جميع الأدوات اللازمة لإنشاء سيناريوهات جغرافية مكانية، وإجراء تحليلات مكانية، وإدارة البيانات، وعرض النتائج بصريًا. يستخدم GeoPard نماذج مختلفة تستند إلى مسوحات ميدانية فعلية، بما في ذلك أسطح الارتفاع المنتظمة (مع أو بدون ميل)، ومناطق المنحدرات (مع أو بدون ارتفاع). تساعد هذه التقنية المزارعين والمهندسين الزراعيين على استكشاف خصائص التربة بطريقة جديدة، وإنشاء نموذج تضاريس رقمي (DTM)، وإنتاج خرائط لخصائص التربة مثل النتوءات الصخرية، وأخاديد التعرية، والكثبان الرملية، والوديان، وانحدارات المنحدرات، وغيرها.

الأسئلة الشائعة


1. كيف تؤثر التضاريس على المناخ؟ وكيف تساهم السلاسل الجبلية في ذلك؟ تؤثر الجبال بشكل كبير على أنماط المناخ. فعلى سبيل المثال، يمكن للجبال أن تحجب مرور الرياح السائدة، مما يؤدي إلى هطول أمطار غزيرة على الجانب المواجه للرياح وجفاف الجانب الآخر، مُحدثةً ما يُعرف بظاهرة ظل المطر. كما تؤثر الجبال على درجات الحرارة، حيث تشهد المرتفعات عمومًا درجات حرارة أقل بسبب انخفاض ضغط الهواء وقلة كثافة الغلاف الجوي. علاوة على ذلك، تؤثر الجبال على دوران الهواء المحلي وتكوين المناخات المحلية الدقيقة، مما يؤدي إلى اختلافات في درجات الحرارة والرطوبة وأنماط الرياح عبر مختلف المنحدرات والوديان. 2. أي من المحاصيل التالية يزرع في المناطق المنخفضة؟ تشمل المحاصيل التي تُزرع عادةً في المناطق المنخفضة تلك التي تُفضل المناخات الدافئة والارتفاعات المنخفضة. ومن أمثلة هذه المحاصيل الفواكه الاستوائية كالموز والحمضيات والأناناس. كما تُزرع محاصيل أخرى شائعة في المناطق المنخفضة كالذرة وفول الصويا والقطن وأنواع مختلفة من الخضراوات كالبندورة والفلفل. تزدهر هذه المحاصيل في المناطق ذات درجات الحرارة المعتدلة إلى المرتفعة، وتتطلب مواسم نمو أطول، وهو ما يتوفر غالبًا في المناطق المنخفضة. 3. كيف يؤثر الارتفاع على المناخ؟ يؤثر الارتفاع بشكل كبير على المناخ نتيجة لتغيرات درجة الحرارة وضغط الهواء. فمع ازدياد الارتفاع، يصبح الهواء أقل كثافة، مما يؤدي إلى انخفاض الضغط الجوي. وينتج عن ذلك انخفاض في درجة الحرارة، حيث تنخفض بنحو 0.6 درجة مئوية لكل 100 متر زيادة في الارتفاع. كما تشهد المناطق المرتفعة إشعاعًا شمسيًا أكثر كثافة، ومتوسط درجات حرارة أقل، وتفاوتًا أكبر في درجات الحرارة بين الليل والنهار. بالإضافة إلى ذلك، يؤثر الارتفاع على أنماط هطول الأمطار، حيث تتلقى المناطق المرتفعة عادةً كميات أكبر من الأمطار أو الثلوج نتيجة للرفع التضاريسي. 4. كيف تؤثر التضاريس على تكوين التربة؟ يلعب دورًا حيويًا في تكوين التربة عبر آليات متعددة. تؤثر المنحدرات والانحدارات على تصريف المياه، مما يؤدي إلى تباينات في محتوى رطوبة التربة. قد تتعرض المنحدرات الشديدة لتآكل أسرع، مما يؤدي إلى تربة أرق، بينما تسمح المنحدرات اللطيفة بتكوين تربة أفضل. يمكن للخصائص الطبوغرافية، مثل الوديان والمنخفضات، أن تُراكم المواد العضوية والمغذيات، مما يُسهم في خصوبة التربة. بالإضافة إلى ذلك، يؤثر على ترسب الرواسب، مُغيرًا نسيج التربة وتركيبها. 5. كيف تساعد الجغرافيا الطبيعية للمكان في تشكيل الممارسات الزراعية؟ تلعب الجغرافيا الطبيعية للمكان دورًا حاسمًا في تشكيل الممارسات الزراعية. فعوامل مثل المناخ والتضاريس ونوع التربة وتوافر المياه تؤثر بشكل مباشر على اختيار المحاصيل وتقنيات الزراعة. على سبيل المثال، تُعد المناطق ذات التربة الخصبة والأمطار الوفيرة مناسبة لزراعة محاصيل متنوعة، بينما قد تتطلب المناطق القاحلة أنظمة ري أو محاصيل مقاومة للجفاف. يساعد فهم الجغرافيا الطبيعية المزارعين على تكييف ممارساتهم، واختيار المحاصيل المناسبة، وإدارة موارد المياه، وتنفيذ تدابير صيانة التربة من أجل إنتاج زراعي مستدام وفعال. 6. كيف تؤثر التضاريس على التنمية الاقتصادية؟ للتضاريس تأثير كبير على التنمية الاقتصادية من جوانب متعددة. فهي تؤثر على توافر الموارد وسهولة الوصول إليها، كالمعادن والمياه، مما يحفز أنشطة اقتصادية كالتعدين وتوليد الطاقة الكهرومائية. كما تؤثر على البنية التحتية للنقل، حيث تشكل المنحدرات الشديدة والتضاريس الوعرة تحديات أمام إنشاء الطرق والسكك الحديدية. وتدعم المناطق الساحلية ذات التربة الملائمة مرافق الموانئ والتجارة البحرية. علاوة على ذلك، تجذب المعالم الطبوغرافية كالجبال والمناظر الطبيعية الخلابة السياحة، مما يسهم في دعم الاقتصادات المحلية. 7. لماذا تعتبر الأرض المستوية جيدة للزراعة؟ تُعدّ الأراضي المستوية مثالية للزراعة لعدة أسباب. أولاً، تُسهّل استخدام الآلات الزراعية، مما يسمح للمزارعين باستخدامها في مهام متنوعة كالحراثة والزراعة والحصاد. كما تُسهّل الأراضي المستوية الريّ وتوزيع المياه بكفاءة، حيث يتدفق الماء بالتساوي في الحقل دون تجمعات أو توزيع غير متساوٍ. إضافةً إلى ذلك، تسمح الأراضي المستوية بتعرّض متساوٍ لأشعة الشمس، مما يُعزز نمو النباتات وتطور المحاصيل بشكل متناسق. 8. ما هي سمات التضاريس التي يمكن أن تؤثر على المناخ المحلي؟ تؤثر التضاريس، مثل الارتفاع واتجاه المنحدرات وسلاسل الجبال، على المناخ المحلي. فالمناطق المرتفعة تشهد درجات حرارة أقل، ويؤثر اتجاه المنحدرات على التعرض لأشعة الشمس وتغيرات درجات الحرارة، كما يمكن للجبال أن تغير أنماط الرياح وهطول الأمطار. 9. ما الذي تفعله المناطق الجبلية لخلق أرض مسطحة للزراعة؟ تُهيئ المناطق الجبلية أراضيَ مستويةً للزراعة عبر ممارساتٍ متنوعة. ومن الطرق الشائعة الزراعة المدرجة، حيث تُحفر مدرجاتٌ أو مصاطب في المنحدرات لتوفير أسطحٍ مستويةٍ للزراعة. يُساعد هذا على منع انجراف التربة ويسمح بتوزيع المياه بالتساوي في الحقول. إضافةً إلى ذلك، قد تُنشئ المناطق الجبلية أنظمة ري لتحويل المياه من المرتفعات إلى المناطق المنخفضة، مما يُسهّل الزراعة على الأراضي المستوية. علاوةً على ذلك، تستخدم بعض المناطق الجبلية تقنيات استصلاح الأراضي، مثل ردم الوديان أو إنشاء هضابٍ اصطناعية، لتوفير أراضٍ أكثر استواءً للأغراض الزراعية. 10. أي من المناطق التالية هي الأنسب للزراعة؟ تعتمد ملاءمة منطقة ما للزراعة على عدة عوامل، منها المناخ، وخصوبة التربة، وتوافر المياه، والتضاريس. ومن أنواع المناطق الملائمة للزراعة عموماً:
  • السهول: مناطق مسطحة أو متموجة قليلاً ذات تربة خصبة وظروف مناخية ملائمة لزراعة المحاصيل.
  • وديان الأنهارالمناطق المجاورة للأنهار والتي تستفيد من التربة الطميية الخصبة وإمكانية الوصول إلى المياه للري.
  • السهول الساحليةالمناطق المنخفضة على طول السواحل والتي غالباً ما تتمتع بتربة خصبة وتستفيد من التأثيرات البحرية مثل درجات الحرارة المعتدلة والرطوبة.
  • دلتا: التضاريس التي تشكلت عند مصبات الأنهار، مما يوفر تربة غنية بالعناصر الغذائية وإمدادات وفيرة من المياه للزراعة.
  • الهضاب: مناطق مرتفعة مسطحة أو منحدرة بلطف ذات خصوبة تربة جيدة وإمكانية للري، خاصة في المناطق ذات هطول الأمطار المناسب.
ومع ذلك، من المهم ملاحظة أن متطلبات المحاصيل المحددة والاختلافات المناخية المحلية يمكن أن تحدد مدى ملاءمة هذه المناطق للزراعة. 11. ما هو حجم الهكتار مقابل الفدان؟ الهكتار والفدان وحدتان لقياس مساحة الأرض، لكنهما يختلفان في الحجم. الهكتار وحدة قياس مترية، ويعادل 10,000 متر مربع أو 2.47 فدان. أما الفدان فهو وحدة قياس إمبراطورية شائعة الاستخدام في الولايات المتحدة، ويعادل تقريبًا 4,047 متر مربع أو 0.4047 هكتار. 12. ما هي العوامل الخمسة المكونة للتربة؟ العوامل الخمسة الرئيسية لتكوين التربة هي: المناخ، والكائنات الحية، والمادة الأم، والتضاريس، والزمن. يؤثر المناخ على عمليات التجوية والتحلل التي تُشكل التربة. تُساهم الكائنات الحية، كالنباتات والحيوانات والكائنات الدقيقة، في تكوين التربة وتحويلها من خلال أنشطتها. تشير المادة الأم إلى الصخور أو الرواسب التي تُشتق منها التربة. تؤثر التضاريس على تصريف المياه وأنماط التعرية، مما يؤثر بدوره على تكوين التربة. يُعد الزمن عاملاً حاسماً، إذ يُحدد درجة تطور التربة من خلال التغيرات التدريجية على مدى فترات طويلة.

خرائط طبوغرافية ثلاثية الأبعاد في الزراعة الدقيقة

تُسجّل شركة GeoPard إنجازاً تاريخياً بكونها أول شركة تُؤتمت عملية إنشاء المحتوى عبر الإنترنت تضاريس ثلاثية الأبعاد عالية الدقة الخرائط مع جديدها أداة رسم الخرائط ثلاثية الأبعاد.


في غضون ثوانٍ معدودة، يستطيع المستخدمون إنشاء خرائط توضح التباين المعقد. على سبيل المثال، تساعد هذه الخرائط في فهم كيفية تأثير بيانات التضاريس والارتفاعات في منطقة معينة على نمو المحاصيل.

خرائط التضاريس ثلاثية الأبعاد في الزراعة الدقيقة
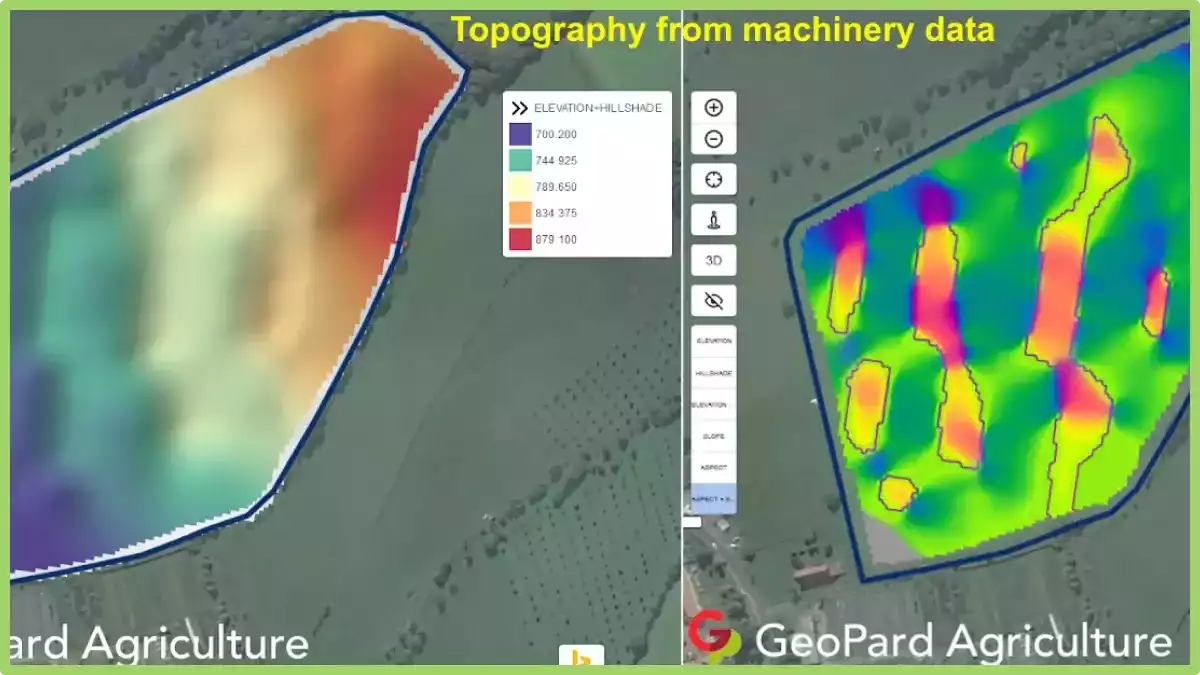
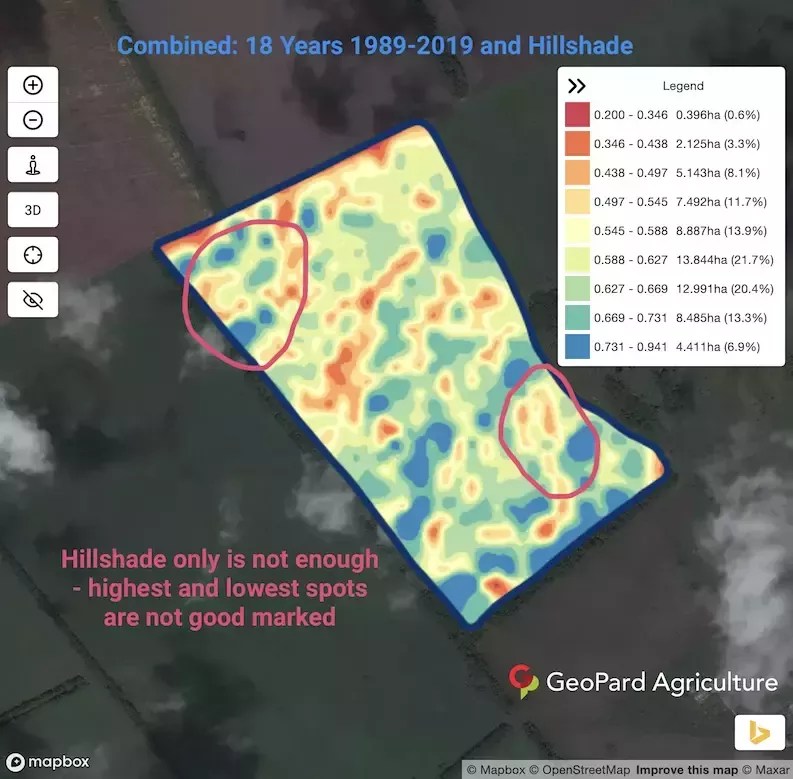
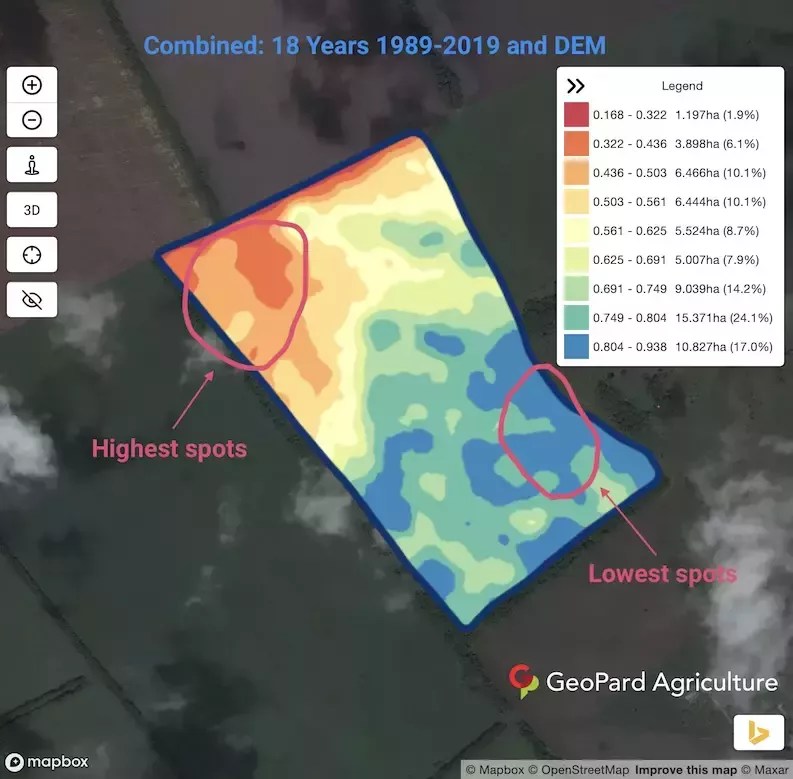
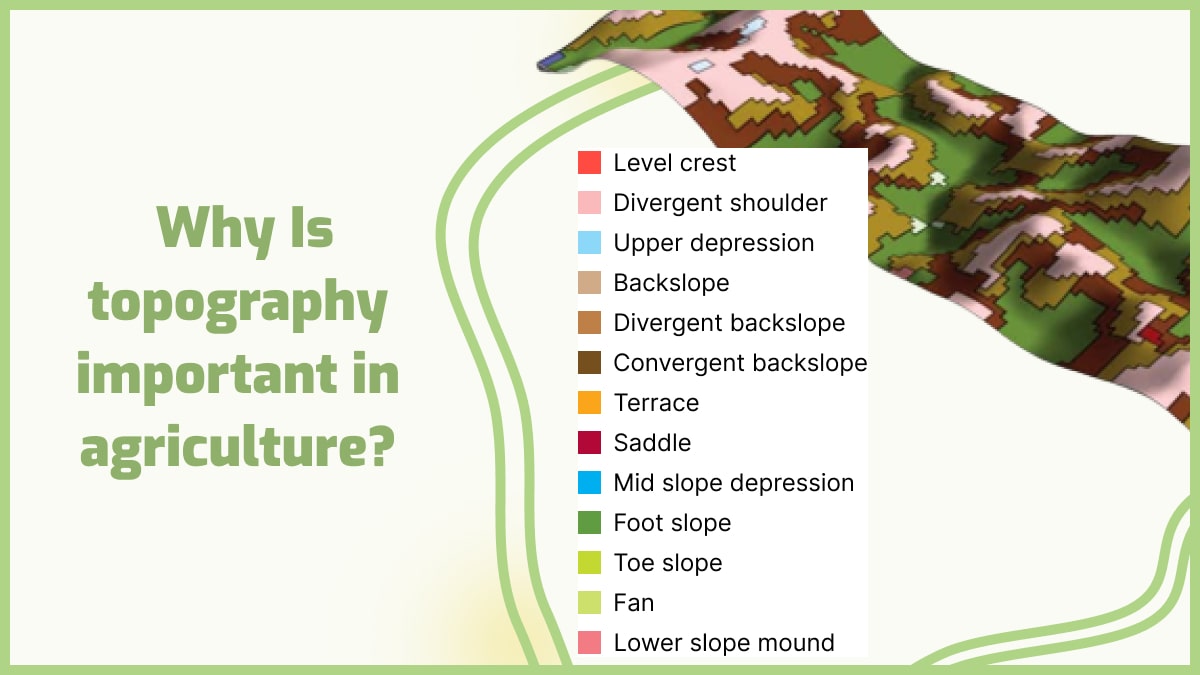
نموذج تضاريس ثلاثي الأبعاد مُركّب مع خريطة جهد المجال

تواصل شركة GeoPard مهمتها في جعل هذه الأدوات في متناول مزارعي المحاصيل. فليس هناك حاجة إلى حاسوب قوي أو مهارات متخصصة للبدء باتخاذ القرارات بناءً على البيانات. 

ما هي خرائط التضاريس؟

خرائط التضاريس، والمعروفة أيضاً بخرائط الارتفاع، هي خرائط تُظهر شكل سطح الأرض وارتفاعه. تستخدم هذه الخرائط خطوط الكنتور لإظهار الارتفاعات المختلفة للأرض، حيث يمثل كل خط ارتفاعاً ثابتاً فوق مستوى سطح البحر.

كلما تقاربت خطوط الكنتور، زاد انحدار الأرض، بينما تشير خطوط الكنتور المتباعدة إلى تضاريس أكثر انبساطاً.

في الزراعة الدقيقة، يمكن استخدامها لتحديد الاختلافات في الانحدار والتضاريس، والتي يمكن أن تؤثر على توزيع المياه والمغذيات والمدخلات الأخرى عبر الحقل.

من خلال فهم الخرائط الطبوغرافية ثلاثية الأبعاد لحقولهم، يستطيع المزارعون اتخاذ قرارات مستنيرة بشأن الزراعة والري والصرف، ويمكنهم تطبيق تقنيات الزراعة الدقيقة مثل تطبيق المدخلات بمعدل متغير.

يمكن إنشاء هذه الخرائط باستخدام تقنيات متنوعة، بما في ذلك تقنية LiDAR (الكشف الضوئي وتحديد المدى) وصور الأقمار الصناعية. ويمكن دمج هذه الخرائط مع بيانات أخرى، مثل خرائط التربة وبيانات المحاصيل، لإنشاء خرائط مخصصة لتطبيقات الزراعة الدقيقة.

بشكل عام، تعتبر هذه الأدوات أداة مهمة للزراعة الدقيقة، حيث أنها تزود المزارعين بفهم مفصل لتضاريس ومناظر حقولهم، مما يمكنهم من تحسين المحاصيل وتقليل تكاليف المدخلات.

ما هو رسم الخرائط ثلاثية الأبعاد في الزراعة الدقيقة؟

يُعدّ رسم الخرائط ثلاثية الأبعاد في الزراعة الدقيقة تقنية تستخدم أجهزة استشعار وتقنيات تصوير متنوعة لإنشاء خريطة ثلاثية الأبعاد مفصلة لمزرعة أو حقل.

تتضمن العملية عادةً استخدام الطائرات بدون طيار أو الطائرات أو المركبات الأرضية المجهزة بأجهزة استشعار تلتقط صورًا للمنطقة من زوايا مختلفة.

ثم تتم معالجة هذه الصور لإنشاء خريطة ثلاثية الأبعاد عالية الدقة للحقل أو المزرعة والتي يمكن استخدامها لتحديد الاختلافات في التضاريس وأنواع التربة وصحة المحاصيل.

يمكن استخدام هذه المعلومات لإنشاء خرائط وصفات مخصصة لتطبيق المدخلات بمعدلات متغيرة مثل الأسمدة ومبيدات الأعشاب ومبيدات الآفات، ولتحسين أنظمة الري والصرف.

يمكن أيضًا استخدام رسم الخرائط ثلاثية الأبعاد لتحديد المناطق التي قد تسبب مشاكل مثل تآكل التربة أو مشاكل الصرف، مما يسمح للمزارعين باتخاذ تدابير استباقية لمعالجتها.

دمج خرائط التضاريس ثلاثية الأبعاد مع أداة GeoPard الدقيقة

يمكن استخدام أداة رسم الخرائط ثلاثية الأبعاد مع أي طبقة أساسية من GeoPard بالإضافة إلى رسم تضاريس الليدار و المشتقات. من بين الطبقات الإضافية المتاحة، هناك الخصائص الكيميائية الزراعية للتربة, مجموعات بيانات المحصول/كما تم تطبيقه/كما تم زراعته, بيانات الماسحات الأرضية, وحتى مؤشرات الغطاء النباتي.

أي خريطة تغطية مثل المناطق من العائد, الغطاء النباتي التاريخي, المادة العضوية, الموصلية الكهربائية, ، أو الرقم الهيدروجيني يمكن استخدام التوزيع فوق الطبقة الأساسية. تساعد الخرائط ثلاثية الأبعاد المستخدمين على فهم كيفية التضاريس والتضاريس تؤثر على خصائص التربة والنباتات والمحصول.

وتساهم هذه الدراسات في فهم أفضل بصرياً وتحليلياً لكيفية إدارة قطع الأراضي الفردية بأكثر الطرق فعالية. 

من المهم الإشارة إلى أن هذا النموذج ثلاثي الأبعاد المباشر يعمل مباشرة في المتصفح بدون أي برامج أو إضافات خارجية مثبتة مسبقًا. يمكنك تدوير الخرائط وتكبيرها وتصغيرها وتغييرها لفهم الحقول بشكل أفضل.

يتضمن التحسين الأخير إمكانية حفظ مجموعات طبقات البيانات المفضلة للخرائط ثلاثية الأبعاد والوصول إليها بسرعة لاحقاً. وهذا يُمكّن من حفظ حالة التحقيق الحالية ومتابعة المراجعة لاحقاً.

ومن الفوائد الإضافية هنا القدرة على تتبع التغييرات خلال مواسم المحاصيل الزراعية ضمن اللقطات المحفوظة.

تؤثر التضاريس بشكل كبير على الغطاء النباتي للمحاصيل، مما يؤثر بدوره على إنتاجية المحاصيل (يمكنكم الاطلاع على المزيد من التفاصيل في منشور سابق على المدونة). هنا).

تمثل المناطق المحددة قيمة أداة رسم الخرائط ثلاثية الأبعاد GeoPard، والتي تعمل على تحسين فهم أسباب توزيع المحاصيل وإعلامنا بالتغييرات الضرورية في أنماط الزراعة.

علاوة على ذلك، يوفر نموذج الخرائط الطبوغرافية ثلاثية الأبعاد نظرة ثاقبة حول كيفية تغذية مستجمعات المياه لأرضك والمسارات التي تسلكها المياه.

يمكن لخرائط GeoPard الطبوغرافية ثلاثية الأبعاد أن تنقل معلومات أساسية حول تصريف المياه السطحية وتحت السطحية أوجه القصور، مما يسمح بإعادة تصميم أنظمة الري والصرف لتحسين توافر المياه في التربة لمحاصيلك.

تسعى GeoPard إلى تحقيق أهداف عالية من خلال تطوير أدوات جديدة كهذه، وتعمل باستمرار على تحسين وتطوير فهمها العالمي المتعلق بالطلب على الحلول الرقمية للزراعة الدقيقة.

إذا كنت مهتمًا بمعرفة المزيد عن كيفية جمع البيانات وتحليلها، فلا تتردد في الاطلاع على هذا المنشور لمعرفة المزيد!


الأسئلة الشائعة


1. كيف يمكن تفعيل خاصية التضاريس في برنامج جوجل إيرث؟

لتفعيل خاصية التضاريس في جوجل إيرث، اتبع هذه الخطوات البسيطة. أولاً، افتح جوجل إيرث على جهازك. ثم انتقل إلى لوحة "الطبقات" الموجودة على الجانب الأيسر من الشاشة.

انقر على مجلد "قاعدة البيانات الأساسية"، ثم حدد خانة الاختيار بجوار "التضاريس" أو "المباني ثلاثية الأبعاد" لعرض المعالم الطبوغرافية. يمكنك تخصيص المظهر بشكل أكبر عن طريق ضبط الشفافية أو الإعدادات الأخرى.

باتباع هذه الخطوات، ستتمكن من عرض واستكشاف التضاريس في برنامج جوجل إيرث، مما يعزز تجربتك الافتراضية لتضاريس الأرض.

2. كيف يمكن إنشاء نموذج ثلاثي الأبعاد من خريطة طبوغرافية؟

يتطلب إنشاء نموذج ثلاثي الأبعاد من خريطة طبوغرافية عدة خطوات. أولاً، الحصول على خريطة طبوغرافية عالية الدقة للمنطقة المطلوبة. ثانياً، رقمنة خطوط الكنتور من الخريطة باستخدام برامج متخصصة أو برسمها يدوياً.

بعد ذلك، استورد الخطوط الكنتورية الرقمية إلى برنامج تصميم ثلاثي الأبعاد، وقم بتمديدها عموديًا بناءً على قيم ارتفاعها. وأخيرًا، أضف نسيجًا وتفاصيل أخرى إلى النموذج لتحسين مظهره.

باتباع هذه الخطوات، يمكنك تحويل الخريطة الطبوغرافية إلى نموذج ثلاثي الأبعاد، مما يسمح بتمثيل أكثر واقعية للتضاريس.

Use of Cropped Raster Data for Agribusiness

Cropped raster data based on field boundary sounds very simple. Some data sources are rasters with pixels and a resolution of 3m/10m/30m, others – are vectors with polygons or multipolygons.

The accurate boundary of the cropped raster data is tricky. The default output most gis and precision agriculture software have is a pixelated raster. Precise data evaluation close to the field boundary helps you better to understand, for example, canopy conditions, slope value. 

Examples of pixelated rasters:

Near-infrared pixelated raster
Elevation pixelated raster

Is it possible to improve and to make it more accurate?

Yes, GeoPard does that and even makes data available for further integration via API. Some examples:

  • Crop of raw (RedGreenBlue and NearInfrared views) satellite imagery based on field boundary:
RGB cropped raster
GeoPard Agriculture RGB cropped raster
Near-infrared cropped raster
GeoPard Agriculture Near-infrared cropped raster


  • Crop of satellite imagery with vegetation index like WDRVI based on the field boundary:


WDRVI cropped raster
GeoPard Agriculture WDRVI cropped raster


  • Crop of digital topography dataset (elevation and roughness) based on the field boundary:


Elevation cropped raster
GeoPard Agriculture Elevation cropped raster
Roughness cropped raster
GeoPard Agriculture Roughness cropped raster

How it looks in GeoPard interface and how it can be integrated in your ag tech solution:

GeoPard Agriculture NIR cropped raster
GeoPard Agriculture Relief Position
GeoPard Agriculture WDRVI

We at GeoPard understand the value of such details and are constantly working to improve the solution.

What is Raster Data?

Raster data is a type of digital image data that is represented by a grid of pixels or cells, where each cell corresponds to a specific location on the earth’s surface. Each pixel in a raster image is assigned a value that represents a particular attribute or characteristic of that location, such as elevation, temperature, or land cover.

It is commonly used in geographic information systems (GIS) and remote sensing applications to represent and analyze various types of spatial data. It can be collected from a variety of sources, including satellite and aerial imagery, digital cameras, and ground-based sensors.

It is often stored in various formats, such as GeoTIFF, JPEG, and PNG, which are designed to compress and store the data efficiently. GIS software and image processing tools can be used to manipulate and analyze data, such as by performing calculations on the pixel values or applying filters to enhance certain features.

Examples of applications include mapping land use and land cover, analyzing changes in vegetation over time, and predicting crop yields based on environmental factors.

How Raster Data Used In Precision Agriculture?

It is an essential component of precision agriculture, as it provides detailed information about crop health, soil properties, and environmental factors that can be used to make more informed decisions about crop management. Here are some examples of how raster data is used in precision agriculture:

  • Crop health analysis: Remote sensing data in the form of satellite imagery or drone imagery can be used to generate data layers that show vegetation indices such as NDVI (Normalized Difference Vegetation Index) or NDRE (Normalized Difference Red Edge). These indices help identify areas of the field with healthy vegetation, as well as areas where crops may be under stress due to disease, pests, or nutrient deficiencies.
  • Soil analysis: Soil data, such as soil moisture content or soil texture, can be collected using sensors that generate data layers. These layers can help identify areas of the field with varying soil characteristics, which can inform decisions about fertilization, irrigation, and other soil management practices.
  • Environmental analysis: Data layers that show environmental factors such as temperature, precipitation, and wind speed can be used to model crop growth and predict yield. These layers can also help identify areas of the field that are prone to erosion, flooding, or other environmental problems.
  • Variable rate application: It can be used to generate prescription maps for variable rate application of inputs such as fertilizer or pesticides. By applying inputs at varying rates according to the needs of different areas of the field, farmers can reduce waste and optimize crop growth.

Overall, raster data is a crucial tool in precision agriculture, as it provides detailed information about crop and soil conditions that can be used to make more informed decisions about crop management.

النماذج الطبوغرافية للآلات والاستشعار عن بعد

غالباً ما يكون للتضاريس تأثير كبير على توزيع العناصر الغذائية وإمكانية الإنتاج. يقوم GeoPard بإنشاء نماذج طبوغرافية من الآلات, والاستشعار عن بعد، ومجموعات بيانات الليدار إن وجدت. 

دعونا نتعمق أكثر في المشتقات الطبوغرافية الجديدة التي أضفناها للتو إلى GeoPard.

برنامج الإغاثة يُعرَّف بأنه الفرق بين قيمة البكسل المركزي ومتوسط قيم الخلايا المحيطة به. بعبارة أخرى، تمثل النقاط ذات القيم السالبة متوسط الأراضي المنخفضة، بينما تمثل النقاط ذات القيم الموجبة متوسط الأراضي المرتفعة.

يمكنك أن تمتلك قمة تل في منطقة "منخفضة" ذات خصائص تربة مختلفة تمامًا عن المنحدر المتوسط أو المنخفض. الارتفاع والانحدار والاتجاه لا يمكن عرض هذا. يتم حساب موضع الإغاثة بالأمتار.

برنامج الإغاثة

المنحدر هي زاوية الميل بالنسبة للمستوى الأفقي. عادةً ما تُحسب بالدرجات أو كنسبة مئوية للميل. يقوم تطبيق GeoPard بحسابها بالدرجات.

منحدر التضاريس

غلظة يُعرَّف بأنه متوسط الفرق بين البكسل المركزي والخلايا المحيطة به. بعبارة أخرى، يصف الانحدار بالأرقام المطلقة (بالمتر) لكل موقع محدد (بكسل).

يصف مصطلح "الوعورة" المنحدر بأرقام مطلقة.

خشونة يمثل هذا المقياس درجة عدم انتظام السطح. ويتم حسابه من خلال أكبر فرق بين الخلايا، أي بين البكسل المركزي والخلية المحيطة به. بعبارة أخرى، يقيس هذا المقياس القيمة المطلقة القصوى للميل بالمتر لكل موقع (بكسل).

الخشونة هي درجة عدم انتظام السطح.

تعكس هذه المشتقات الطبوغرافية الأربعة تفاصيل المنحدرات ولكن بنكهة مختلفة قليلاً.

تعكس مشتقاتنا الطبوغرافية تفاصيل المنحدر

ما هو النمذجة الطبوغرافية؟

النمذجة الطبوغرافية هي عملية إنشاء تمثيل ثلاثي الأبعاد لسطح الأرض. ويتم ذلك من خلال جمع بيانات عن ارتفاع الأرض، مثل المسح أو صور الأقمار الصناعية، ثم استخدام هذه البيانات لإنشاء نموذج الارتفاع الرقمي (DEM).

ويمكن بعد ذلك استخدام نموذج الارتفاع الرقمي لإنشاء مجموعة متنوعة من المخرجات، مثل الخرائط الطبوغرافية والنماذج ثلاثية الأبعاد وحتى تجارب الواقع الافتراضي.

له مجموعة واسعة من التطبيقات، بما في ذلك:

  • التخطيط والتطوير: يمكن استخدام النماذج الطبوغرافية لتخطيط وتطوير البنية التحتية، مثل الطرق والسكك الحديدية وخطوط الأنابيب. كما يمكن استخدامها لتقييم تأثير التنمية على البيئة.
  • الإدارة البيئية: يمكن استخدام النماذج الطبوغرافية لرصد وإدارة الموارد الطبيعية، مثل المياه والغابات والحياة البرية. كما يمكن استخدامها لتقييم تأثير تغير المناخ على البيئة.
  • التعليم والبحث: يمكن استخدام النماذج الطبوغرافية لتثقيف الجمهور حول سطح الأرض وخصائصها. كما يمكن للباحثين استخدامها لدراسة سطح الأرض وعملياتها.

كيف يتم إعداد النماذج الطبوغرافية؟

يمكن القيام بذلك بعدة طرق، ولكن الطريقة الأكثر شيوعًا هي استخدام نموذج الارتفاع الرقمي (DEM).

نموذج الارتفاع الرقمي (DEM) هو تمثيل شبكي لسطح الأرض، حيث تمثل كل خلية في الشبكة نقطة ذات ارتفاع معروف. ويمكن إنشاء نماذج الارتفاع الرقمي من مصادر متنوعة، منها:

  • المسح: يستخدم المساحون مجموعة متنوعة من الأدوات لقياس ارتفاع الأرض، مثل أجهزة التسوية، وأجهزة قياس الارتفاع، وأجهزة استقبال نظام تحديد المواقع العالمي (GPS).
  • صور الأقمار الصناعية: يمكن استخدام الأقمار الصناعية لإنشاء نماذج الارتفاع الرقمية عن طريق قياس المسافة بين القمر الصناعي وسطح الأرض.
  • التصوير الجوي: يمكن استخدام الصور الجوية لإنشاء نماذج الارتفاع الرقمية عن طريق قياس المسافة بين الكاميرا وسطح الأرض.

بمجرد إنشاء نموذج الارتفاع الرقمي، يمكن استخدامه لإنشاء مجموعة متنوعة من المخرجات، مثل الخرائط الطبوغرافية والنماذج ثلاثية الأبعاد وحتى تجارب الواقع الافتراضي.

فوائد النمذجة الطبوغرافية

كما أنها توفر عدداً من المزايا، بما في ذلك:

  • دقة: تُعدّ نماذج الارتفاع الرقمية تمثيلات دقيقة للغاية لسطح الأرض. وهذا أمر بالغ الأهمية لتطبيقات مثل التخطيط والتطوير، حيث تُعدّ الدقة أمراً أساسياً.
  • التصور: توفر النماذج الطبوغرافية تصوراً واضحاً وموجزاً لسطح الأرض. وهذا يساعد على فهم العلاقة بين مختلف المعالم، مثل الجبال والوديان والأنهار.
  • تحليل: يمكن استخدام النماذج الطبوغرافية لتحليل سطح الأرض. ويمكن استخدام ذلك لتحديد المناطق المعرضة لخطر الفيضانات أو الانهيارات الأرضية أو الكوارث الطبيعية الأخرى.
  • تواصل: يمكن استخدام النماذج الطبوغرافية لتوصيل المعلومات حول سطح الأرض إلى جمهور واسع. وهذا من شأنه أن يساعد في تثقيف الجمهور حول سطح الأرض وخصائصها.

ما هو نظام ليدار الطبوغرافي؟

تقنية الليدار (الكشف الضوئي وتحديد المدى) هي تقنية استشعار عن بعد تستخدم الضوء لقياس المسافة إلى سطح الأرض. تعمل هذه التقنية عن طريق إرسال نبضة ليزرية وقياس الزمن الذي تستغرقه هذه النبضة للعودة. ويمكن استخدام هذه المعلومات لإنشاء نماذج ثلاثية الأبعاد لسطح الأرض.

يُعد جهاز الليدار الطبوغرافي نوعًا من أجهزة الليدار التي تُستخدم تحديدًا لإنشاء نماذج ثلاثية الأبعاد لتضاريس الأرض.

كيف يعمل نظام ليدار التضاريس؟

تتكون هذه الأنظمة عادةً من ليزر وماسح ضوئي وجهاز استقبال نظام تحديد المواقع العالمي (GPS). يُستخدم الليزر لإصدار نبضات ضوئية، ويُستخدم الماسح الضوئي لقياس اتجاه هذه النبضات، ويُستخدم جهاز استقبال نظام تحديد المواقع العالمي (GPS) لتتبع موقع النظام.

تُطلق نبضات الليزر على شكل سلسلة من الخطوط، ويقيس الماسح الضوئي شدة هذه النبضات عند عودتها. تُستخدم هذه المعلومات لإنشاء نموذج ثلاثي الأبعاد لسطح الأرض.

تعتمد دقة بياناتها على عدد من العوامل، بما في ذلك قوة الليزر، وحساسية الماسح الضوئي، وسرعة جهاز استقبال نظام تحديد المواقع العالمي (GPS).

تطبيقات تقنية الليدار الطبوغرافية

يمكن استخدام بياناتها في مجموعة متنوعة من التطبيقات، بما في ذلك:

  • رسم خرائط سطح الأرض
  • رصد التغيرات في سطح الأرض
  • تقييم المخاطر الطبيعية
  • تخطيط مشاريع البنية التحتية
  • إجراء البحوث العلمية

رسم خرائط سطح الأرض

يمكن استخدامه لإنشاء خرائط تفصيلية لسطح الأرض. ويمكن استخدام هذه الخرائط لأغراض متنوعة، مثل تخطيط مشاريع البنية التحتية، وتقييم المخاطر الطبيعية، وإجراء البحوث العلمية.

رصد التغيرات في سطح الأرض

يمكن استخدامها لرصد التغيرات التي تطرأ على سطح الأرض بمرور الوقت. ويمكن استخدام هذه المعلومات لتتبع آثار العمليات الطبيعية، مثل التعرية والترسيب، والأنشطة البشرية، مثل إزالة الغابات والبناء.

تقييم المخاطر الطبيعية

تُستخدم هذه المعلومات لتقييم المخاطر الطبيعية، مثل الانهيارات الأرضية والفيضانات والزلازل. ويمكن استخدامها لتحديد المناطق المعرضة للخطر ووضع استراتيجيات للتخفيف من آثارها.

تخطيط مشاريع البنية التحتية

تُستخدم هذه المعلومات في تخطيط مشاريع البنية التحتية، مثل الطرق والجسور وخطوط الأنابيب. ويمكن استخدامها لتحديد أفضل مسارات المشاريع وتقليل تأثيرها على البيئة.

إجراء البحوث العلمية

يمكن استخدامها لإجراء البحوث العلمية في مواضيع متنوعة، مثل الجيولوجيا والهيدرولوجيا والبيئة. ويمكن استخدام هذه المعلومات لفهم أنظمة الأرض بشكل أفضل وتطوير تقنيات جديدة.

فوائد تقنية الليدار الطبوغرافية

يتميز هذا الأسلوب بعدد من المزايا مقارنة بالأساليب الأخرى لرسم خرائط سطح الأرض، بما في ذلك:

  • دقةإنها دقيقة للغاية، مما يجعلها مثالية للتطبيقات التي تكون فيها الدقة مهمة.
  • سرعةيمكن جمعها بسرعة، مما يجعلها خيارًا فعالًا من حيث التكلفة لمشاريع رسم الخرائط واسعة النطاق.
  • المرونة: يمكن استخدامه لرسم خرائط لمجموعة متنوعة من المعالم، بما في ذلك الأشياء الطبيعية والأشياء التي صنعها الإنسان.
  • بيانات ثلاثية الأبعادإنها ثلاثية الأبعاد، مما يسمح بتقديم تمثيلات أكثر دقة وتفصيلاً لسطح الأرض.

يُعدّ النمذجة الطبوغرافية أداةً فعّالة تُستخدم لإنشاء مجموعة متنوعة من المخرجات، بما في ذلك الخرائط الطبوغرافية، والنماذج ثلاثية الأبعاد، وحتى تجارب الواقع الافتراضي. وتُقدّم هذه الأداة العديد من المزايا، منها الدقة، والتصوير، والتحليل، والتواصل. 

الطبوغرافيا بناءً على بيانات الماكينات

لا يتم استخدام الكثير من البيانات التي يتم جمعها من الحقول من قبل المزارعين والمهندسين الزراعيين. فعلى سبيل المثال، تحتوي أي آلة حديثة تقريبًا على جهاز استقبال للنظام العالمي لتحديد المواقع قادر على جمع بيانات الارتفاع، وغالبًا ما يتم تحسين الدقة مع حركية في الوقت الحقيقي (RTK). 

لا يتم استخدام معظم هذه البيانات بشكل فعال، لأن استخراج هذه المعلومات وتنظيفها ومعالجتها للحصول على قيمة حقيقية منها يستغرق وقتًا طويلاً. تتمثل إحدى الأفكار الرئيسية لـ GeoPard في تقليل تعقيد استخدام البيانات في الزراعة الدقيقة. 

إن GeoPard قادر على استخراج بيانات الارتفاعات عالية الدقة تلقائيًا من:

  • مجموعات بيانات العوائد
  • المفوضية الأوروبية/مجموعات بيانات أجهزة الاستشعار الأخرى

استخدمت GeoPard أفضل ما هو متاح مجموعة بيانات الطبوغرافيا لكل حقل، ولكن، للأسف، لا تتوفر بيانات ليدار عالية الدقة لكل موقع في العالم. ولذلك، فإن نموذج الارتفاع الرقمي القائم على البيانات الآلية سيكون خياراً مثالياً ويحسن بشكل كبير من المعرفة حول الحقل. 

من الآن فصاعدًا، كأي طبقة بيانات في GeoPard، يمكنك إنشاء مناطق من بيانات ارتفاع الآلات باستخدام منشئ المناطق، واستخدام هذه البيانات في وحدة عمليات المناطق (إيجاد التداخلات بين مجموعات البيانات المختلفة) واستخدامها في تحليلات متعددة الطبقات.

لاحظ أنه من الممكن أيضًا قارن نماذج طوبوغرافيا قائمة على الاستشعار عن بُعد استنادًا إلى الآلات/المعالجة الآلية/المعالجة الآلية للمعلومات عن الأرض.

ما هي المعدات الطبوغرافية؟

تشير المعدات الطبوغرافية إلى الأدوات والأدوات المتخصصة المستخدمة في مجال الطوبوغرافيا، وهي دراسة ورسم خرائط لملامح سطح الأرض.

ما هي المعدات الطبوغرافية

صُممت هذه الأدوات لقياس وتسجيل الجوانب المختلفة لتضاريس الأرض وتسجيلها، بما في ذلك الارتفاع والانحدار والخطوط الكنتورية. فيما يلي بعض المعدات الطبوغرافية الشائعة الاستخدام:

  • إجمالي المحطة: المحطة الكلية هي أداة مسح إلكترونية تجمع بين وظائف الثيودوليت (تستخدم لقياس الزوايا الأفقية والرأسية) ومقياس المسافة الإلكتروني لقياس المسافات. وتستخدم لتحديد المواقع بدقة وقياس الزوايا والمسافات في المسوحات الطبوغرافية.
  • مستقبل نظام تحديد المواقع العالمي (GPS): تستخدم أجهزة استقبال النظام العالمي لتحديد المواقع إشارات من الأقمار الصناعية لتحديد المواقع الدقيقة على سطح الأرض. وفي مجال الطوبوغرافيا، تُستخدم أجهزة استقبال النظام العالمي لتحديد المواقع لتحديد نقاط التحكم وقياس الإحداثيات، وهي أمور ضرورية لوضع خرائط طبوغرافية دقيقة.
  • أداة التسوية: تُستخدم أدوات التسوية، مثل المستوى القماشي أو المستوى الرقمي، لقياس فروق الارتفاع أو الارتفاعات بين النقاط المختلفة على الأرض. وهي تساعد في تحديد معالم الأرض ومنحدراتها.
  • ليدار (كشف الضوء وتحديد المدى): LiDAR هي تقنية استشعار عن بُعد تستخدم ضوء الليزر لقياس المسافات وإنشاء خرائط مفصلة ثلاثية الأبعاد. وهي تُستخدم عادةً في عمليات المسح الجوي أو الأرضي لالتقاط بيانات ارتفاعات عالية الدقة.
  • معدات التصوير الفوتوغرافي: يتضمن القياس التصويري الحصول على القياسات من الصور الفوتوغرافية. تُستخدم كاميرات متخصصة أو آلة طوبوغرافية أو طائرات بدون طيار أو طائرات بدون طيار مزودة بكاميرات عالية الدقة لالتقاط صور جوية. ثم تُستخدم برمجيات القياس التصويري لمعالجة هذه الصور واستخراج المعلومات الطبوغرافية.
  • أجهزة GPS المحمولة باليد: توفر أجهزة النظام العالمي لتحديد المواقع المحمولة باليد بيانات دقيقة عن الموقع في الوقت الفعلي. وهي محمولة وتستخدم للملاحة ورسم الخرائط وجمع البيانات في الميدان.
  • الكتب الميدانية وأدوات القياس: يستخدم المساحون الدفاتر الميدانية لتسجيل القياسات والرسومات والملاحظات أثناء عمليات المسح الطبوغرافي. تُستخدم أدوات القياس مثل أشرطة القياس وأعمدة القياس وأشرطة الأعلام لقياس المسافات وتحديد النقاط المهمة.

هذه بعض المعدات الطبوغرافية الأساسية المستخدمة في هذا المجال. من المهم ملاحظة أن التطورات التكنولوجية قد تُدخل أدوات جديدة أو أشكالاً مختلفة من المعدات الموجودة، لذا يوصى بالاطلاع على آخر التطورات.

ما هو آلة طوبوغرافية؟

آلة رسم الخرائط الطبوغرافية، والمعروفة أيضاً باسم آلة المسح الطبوغرافي أو نظام رسم الخرائط الطبوغرافية، هي أداة متخصصة تُستخدم في الزراعة للقياس الدقيق ورسم الخرائط للسمات الفيزيائية للحقل أو الأرض الزراعية.

ما هي الآلة الطوبوغرافية في الزراعة

وهي مصممة لالتقاط بيانات دقيقة للارتفاعات وإنشاء خرائط طبوغرافية مفصلة تمثل معالم التضاريس والمنحدرات وغيرها من الخصائص الأساسية.

تتكون آلة المسح الطوبوغرافي عادةً من معدات مسح متقدمة، بما في ذلك أجهزة استقبال النظام العالمي لتحديد المواقع (GPS)، وأجهزة المسح بالليزر، وأجهزة استشعار LiDAR (الكشف عن الضوء وتحديد المدى)، وأجهزة كمبيوتر على متن الطائرة.

تعمل هذه المكونات معًا لجمع بيانات دقيقة عن الموقع وقياس ارتفاع نقاط مختلفة عبر الأرض الزراعية.

يتم تشغيل الماكينة بواسطة متخصصين زراعيين أو فنيين مدربين يقومون بنشرها في الحقل. وبينما تتحرك الآلة الطوبوغرافية عبر المنطقة، فإنها تستخدم إشارات النظام العالمي لتحديد المواقع لتحديد موقعها وتقنية الليزر أو الليزر لقياس ارتفاع التضاريس. ثم تتم معالجة البيانات المجمعة وتحليلها لإنشاء خرائط طبوغرافية دقيقة.

توفر الخرائط الطبوغرافية التي تم إنشاؤها معلومات قيمة للمزارعين ومديري الأراضي. فهي تسمح بتخطيط وإدارة أفضل للأنشطة الزراعية، مثل الري والصرف وتسوية الأراضي.

من خلال فهم تضاريس الأرض، يمكن للمزارعين تحسين ممارساتهم الزراعية وتقليل تآكل التربة إلى الحد الأدنى، وتعزيز إنتاجية المحاصيل بشكل عام.

وختاماً، تلعب المعدات الطبوغرافية دوراً حيوياً في قياس ورسم خرائط دقيقة لملامح سطح الأرض في مجال الطبوغرافيا. وتُعد المعلومات التي يتم جمعها باستخدام هذه الأدوات حاسمة في وضع خرائط طبوغرافية مفصلة، والتي بدورها تساعد في الإدارة الفعالة للأراضي وتخطيط الأنشطة الزراعية وتحسين الممارسات الزراعية. 

تحليل البيانات متعدد الطبقات (المتكاملة) في الزراعة الدقيقة

Precision agriculture is capable of generating vast amounts of data in the form of yield data, satellite imagery, and soil fertility, among others.

The lack of easy-to-use cloud precision software toolkits that assist crop producers in converting field data layers into useful knowledge and actionable recommendations limits the application of precision agricultural technologies.

In precision agriculture, management zones are areas within a field that have similar yield potential based on soil type, slope position, soil chemistry, microclimate, and/or other factors that influence crop production.

ال producer’s knowledge of a field is a very important piece of the process. Management zones are thought of as a mechanism to optimize crop inputs and yield potential.

Maps generated with a single data layer and several data layers.

The big challenge is to build management zones that perfectly reflect field variability. A combination of different layers like satellite imagery, soil fertility, topography derivatives, and yield monitor data is the next logical step to generating more responsive management zones.

Multi layer analytics (also known as integrated analysis) is becoming a part of the GeoPard geospatial analytics engine.

Classic combinations of integrated analysis parameters include one or more yield data, NDVI map, elevation, and soil sensor physicochemical characteristics. 

GeoPard supports these parameters and in addition, allows the inclusion of other field data layers either already available in the system or uploaded directly by the user (soil sampling, yield datasets, etc.).

As a result, you are free to operate with the complete set of parameters doing integrated analytics:

Multi layer yield data analytics

بيانات الاستشعار عن بعد:

  • Potential productivity map (single-year and multi-year)
  • Stability/variation map
  • Vegetation indices NDVI, EVI2, WDRVI, LAI, SAVI, OSAVI, GCI, GNDVI

Topography:

  • Digital elevation
  • المنحدر
  • Curvature
  • Wetness index
  • Hillshades

Soil data:

  • الرقم الهيدروجيني
  • CEC (cation exchange capacity)
  • SOM (soil organic matter)
  • K (potassium)
  • Thin topsoil depth, lower available water holding capacity (drought-prone soil)
  • EC (electrical conductivity)
  • and other chemical attributes available in the uploaded dataset

It’s important to emphasize that custom factors are configured on top of every data layer to assign the desired layer weight. You are very welcome to share your integrated analytics use cases, and build management zone maps based on your knowledge of the field while selecting data sources and their weights in GeoPard.

Pictures in this blog contain a sample field with data layers (like a productivity map covering 18 years, digital elevation model, slope, hillshade, 2019 yield data) and various combinations of integration analytics maps. 

You can follow the steps of the evolution of management zones while extending integration analytics with an additional data layer.


الأسئلة الشائعة


1. What is data layers?

Data layers refer to the individual components or elements of data that are organized and stacked together to create a comprehensive representation of a specific area or subject.

Each layer represents a specific aspect of the data, such as geographical features, land use, population density, or environmental factors. These layers can be combined and analyzed collectively to gain insights, visualize patterns, and make informed decisions.

Data layers are commonly used in geographic information systems (GIS) and spatial analysis to better understand and represent complex data in a visual and interpretable manner.

2. What is integrated analysis?

Integrated analysis refers to the process of combining and analyzing data from multiple sources or disciplines to gain a more comprehensive and holistic understanding of a particular problem or phenomenon.

It involves merging data sets, applying statistical techniques, and exploring relationships across different variables or domains.

Integrated analysis allows for a more nuanced and interconnected view of complex systems, facilitating the identification of patterns, trends, and causal relationships that may not be evident when analyzing data in isolation.

This approach enables researchers and decision-makers to make more informed and effective decisions based on a broader range of information.

wpChatIcon
wpChatIcon

    طلب عرض توضيحي وتدريبي مجاني من GeoPard / استشارة


    ب بالنقر على الزر، فإنك توافق على سياسة الخصوصية. نحن بحاجة إليها للرد على طلبك.

      اشتراك


      ب بالنقر على الزر، فإنك توافق على سياسة الخصوصية

        أرسل لنا المعلومات


        ب بالنقر على الزر، فإنك توافق على سياسة الخصوصية