Čo je reprezentatívna vzorka pôdy?

A representative soil sample is a small portion of soil that truly reflects the average properties of the entire area being tested. In other words, it should capture the “true characteristics” (physical, chemical, biological) of the whole field or zone. In practice this means combining many subsamples from across the area so that the final sample is like the average soil. As West Virginia University explains, a representative sample “represents the average in your sampled area.”

A simple analogy is helpful: you wouldn’t judge a whole pot of soup by tasting one unmixed spoonful from the top. First you would stir the soup to mix it, then taste a spoonful. That stirred spoonful represents the whole pot. Soil sampling works the same way: you collect and mix many small cores so that one baggie truly represents the entire field, not just a random spot.

The Critical Importance of a Representative Soil Sample

Soil testing is a cornerstone of modern agriculture and environmental management. Globally, the soil testing market is expected to grow at over 6 % annually through 2030, as farmers and land managers increasingly rely on data-driven decision tools. In India, for example, the National Bureau of Soil Survey & Land Use Planning reports that over 2 million soil samples are analyzed yearly to guide fertilizer prescriptions. In the United States, lab fees and services for soil testing support over 100,000 farm operations annually.

The Critical Importance of a Representative Soil Sample

Recent surveys indicate that nearly 40 % of soil test errors trace back to poor sampling technique rather than laboratory error. In one large-scale agronomic study, fields sampled with improved protocols gained on average 12 % higher yield per fertilizer dollar compared to fields sampled poorly. In environmental sectors, analysts estimate that mis-sampling contributes to cleanup cost overruns of up to 20 %.

Getting the sample right is crucial because all management decisions (fertilizer, lime, irrigation, or remediation) will be based on the lab report. If the soil sample is not representative, the test results will be wrong – a classic “garbage in, garbage out” situation. For example, an unrepresentative sample might show a pH or nutrient level that is higher or lower than most of the field actually has. A farmer might then apply too much lime or fertilizer, wasting money and possibly harming the crop. Or worse, real deficiencies could be missed, and yield would suffer.

Similarly, in environmental testing, a poor sample can mislead cleanup efforts. Standard sampling approaches that fail to account for uneven contaminant distribution can underestimate or overestimate pollution, leading to poor decisions. For instance, if only “clean” spots are sampled (or only obvious hot spots), the average contamination level will be wrong. Sampling only at one depth or one location could overlook contamination deeper down or off to the side. The Interstate Technology & Regulatory Council notes that such errors can cause “decision errors,” including unnecessary cleanup costs or missed hazards.

The goal is to get data that you can trust to manage the whole area. With a representative sample, soil test results can guide efficient, cost-effective decisions – applying fertilizer where it’s really needed, or focusing cleanup only where contamination truly exists. In agriculture, this means maximizing yield while minimizing waste and environmental impact. In sum, a truly representative sample underpins reliable soil fertility and remediation plans for the entire field.

Pre-Sampling Plan For Representative Soil Sample: Laying the Groundwork

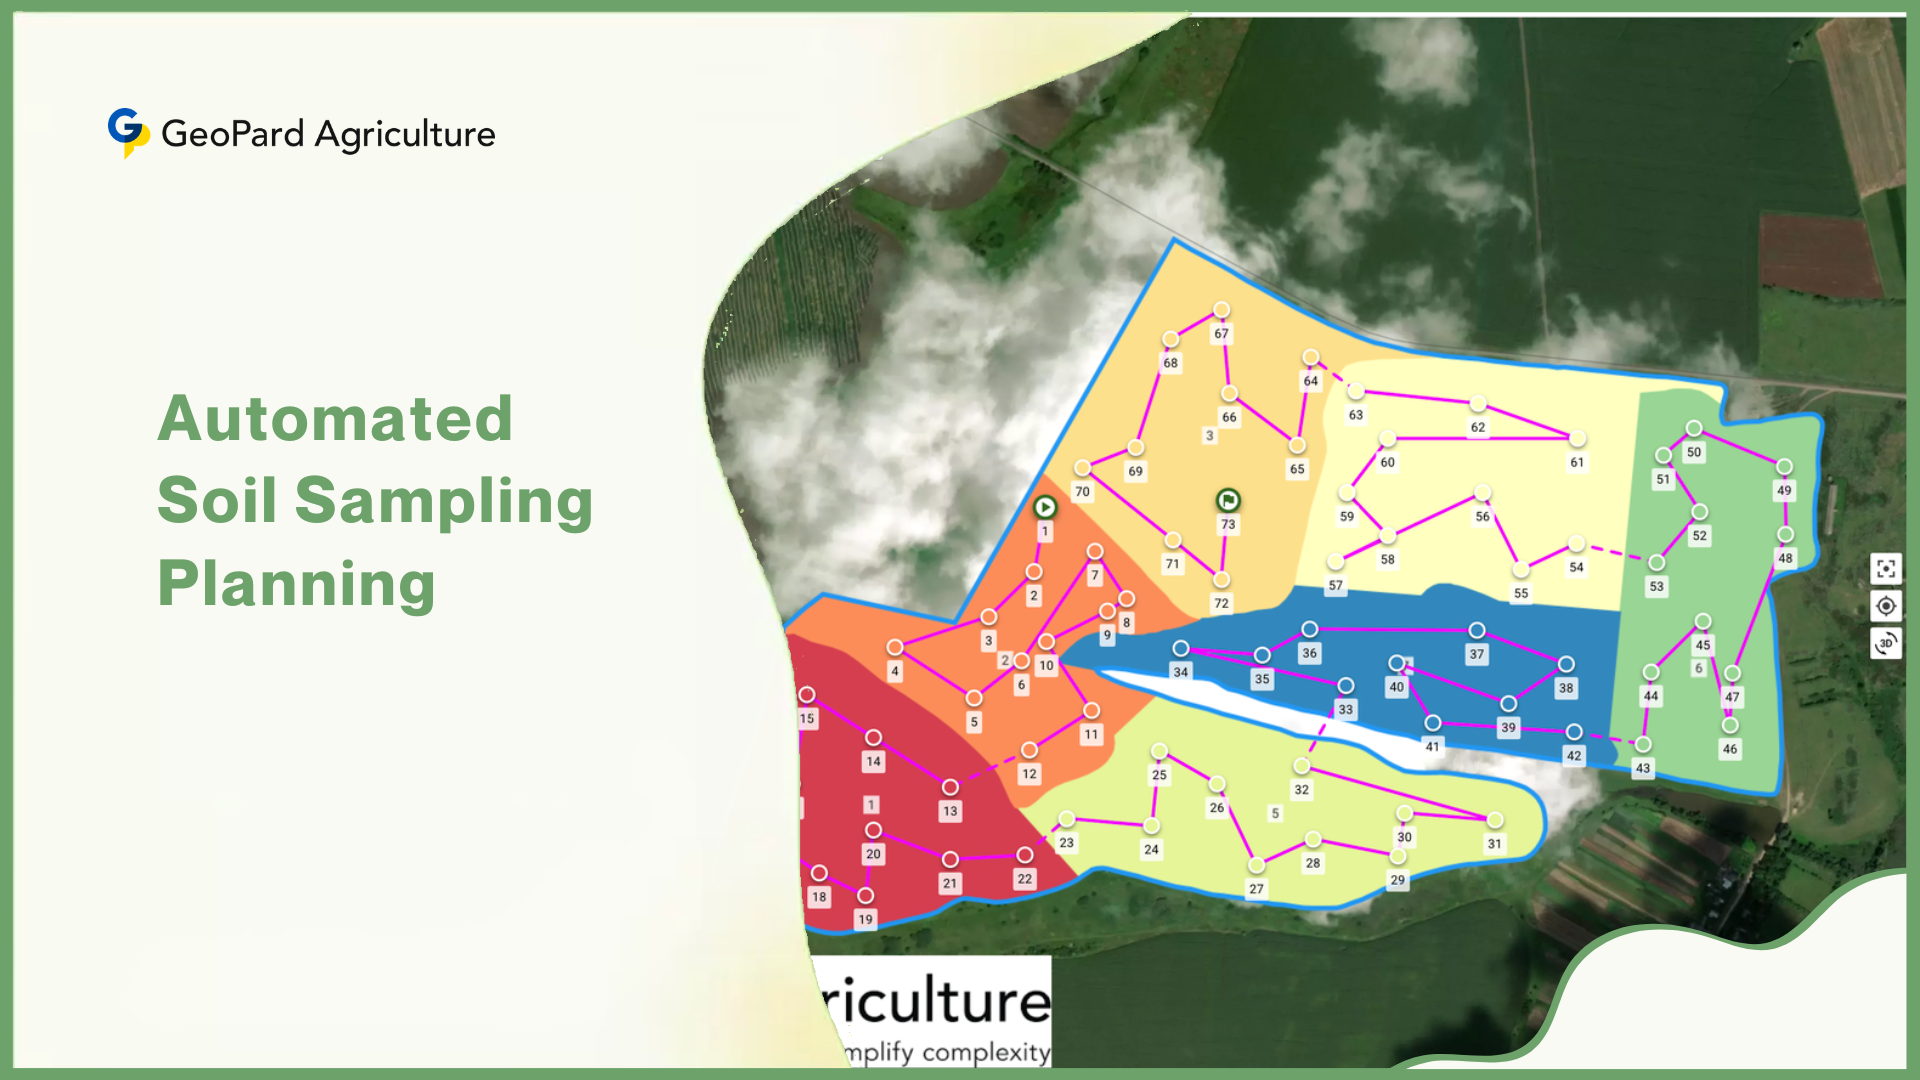
In recent decades, precision agriculture has pushed sampling unit sizes smaller, with some farms using zones as small as 1 acre or less. Satellite imagery and drone-based sensors now help farmers define zones by detecting soil moisture or crop stress variations at high resolution (2–5 m). Studies show yield variability within a single 20-acre field can exceed 30%, underscoring the need to subdivide zones wisely.

Before taking a Representative Soil Sample., plan how you will sample. The first task is to define your sampling units – the areas for which each composite sample will represent. For a very large field, it may make sense to split it into several management zones or uniform areas. Each zone should have roughly uniform soil and management history. For example, one zone might be an area that has had manure spread on it in the past; another might have a different soil type or slope. By sampling each zone separately, each soil sample truly reflects its own area.

Factors for dividing zones include:

  • Past management history: Has part of the field been amended, fertilized heavily, or used for livestock or compost? (e.g. old manure piles, barnyard/feeding areas). Such areas often have higher nutrients, so they should be sampled separately.
  • Soil type or texture: Look at a soil survey map or feel the soil. If a field transitions from sandy soil to clay, consider separate zones. Changes in soil color or feel often signal different properties.
  • Topography and drainage: Uplands, slopes, and low spots tend to behave differently. For example, nutrients can wash downhill, so a hilltop and valley bottom might need separate samples.
  • Crop health or visible differences: Parts of the field that look very different – stunted crops, weeds, wet spots – may indicate different soil conditions and may warrant separate sampling.

Once zones are defined, each zone is sampled and analyzed on its own. This ensures the lab results (and any fertilizer recommendations) apply to that uniform area.

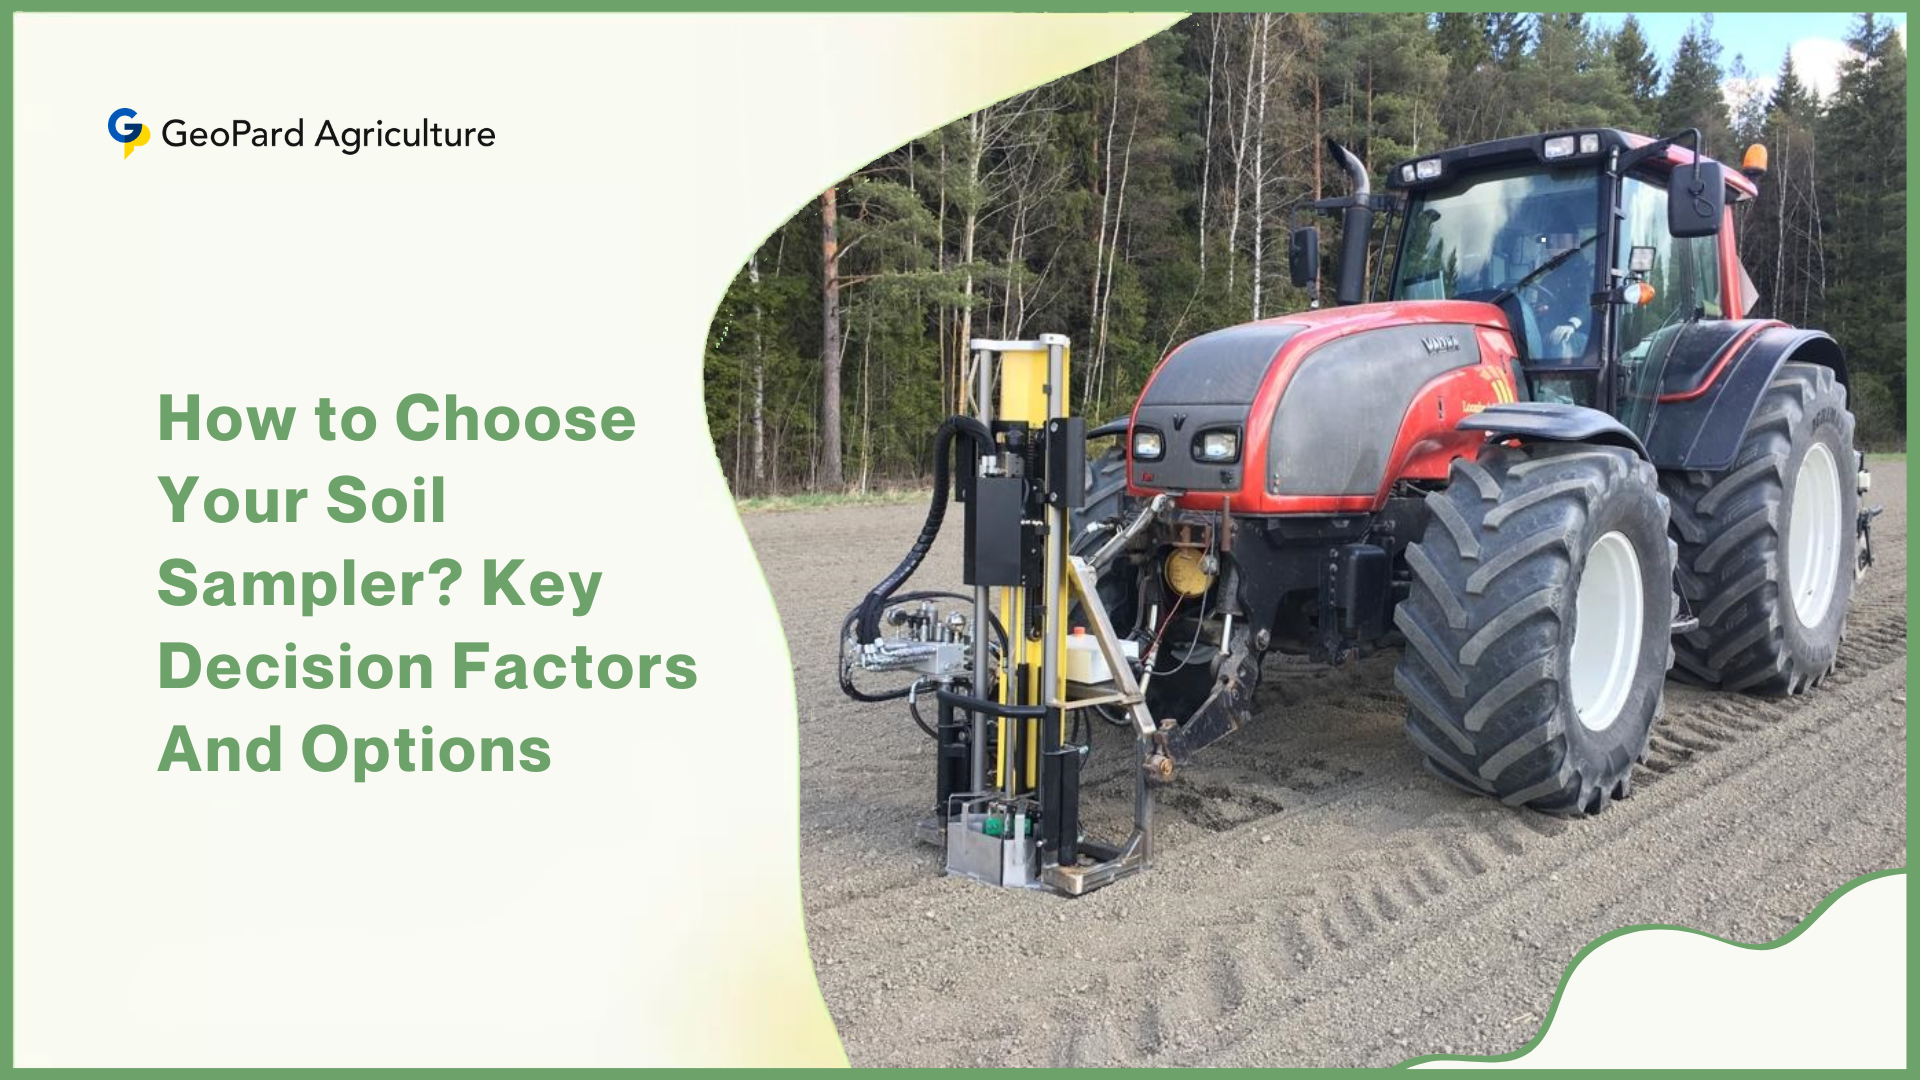
Gather the right tools: Before sampling, assemble your equipment. You will need a soil probe or auger (stainless steel if possible) to extract cores, plus a clean plastic bucket or tray for mixing the samples. (Metal containers are not recommended: they can contaminate samples, especially micronutrient tests.) Other useful items include a small shovel or trowel, clean sampling bags or boxes to hold the final sample, and labels/markers for tagging each bag. Also prepare a field notebook or sampling form to record details like field name, date, and GPS or location notes. Having all tools ready and clean will make the field work go smoothly.

The Field Procedure: A Step-by-Step Guide

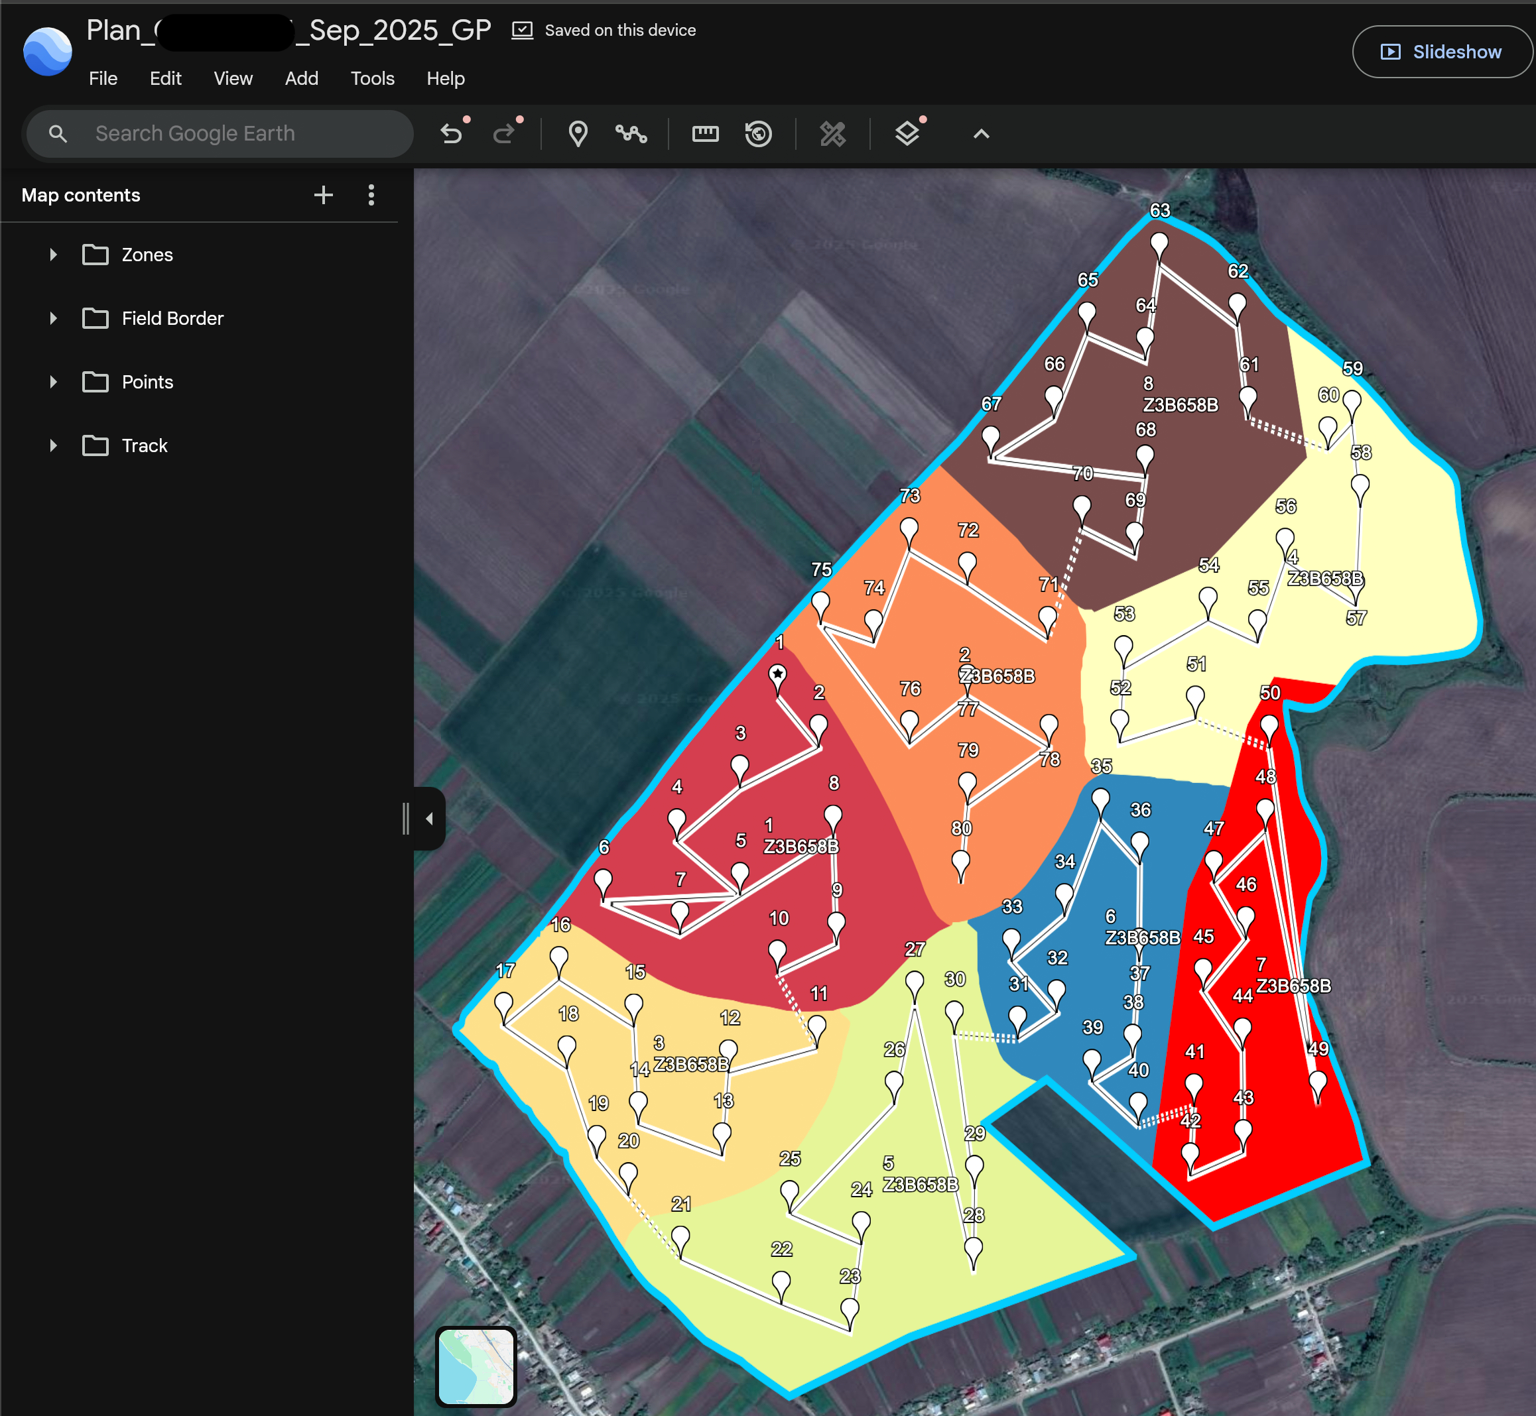
Advances in digital mapping now allow farmers to overlay sampling patterns on field maps, increasing uniform coverage. In one trial, using GPS-assisted zig-zag patterns reduced sample variance by nearly 25 % compared to purely random walking. In some precision farms, mobile apps guide the sampler to predetermined waypoints for consistent coverage for Representative Soil Sample.

1. Collecting Sub-samples: Within each defined zone, collect multiple soil cores (sub-samples). Most agronomists recommend at least 15–20 cores per composite sample. This large number helps capture the natural variability of the soil. Walk through the zone in a zig-zag or grid pattern, taking one core at regular intervals across the entire area. (Vary your path so the cores cover the whole field.) Avoid taking samples from very odd spots – for example, skip fence rows, irrigation ditches, old burn piles, or any small patch that is not typical. Each time, push the probe or auger vertically into the ground to the proper depth (see below), then pull out the soil core and drop it into your bucket. Repeat until you have all 15–20 cores for that zone.

The Field Procedure For Representative Soil Sample A Step-by-Step Guide

2. Consistent Sampling Depth: Be sure all cores for a given sample come from the same depth. For most croplands, this means sampling to the full tillage depth, typically 6–8 inches (about 15–20 cm). (When in doubt, sample the same depth that plows or tillers reach.) For pastures, lawns, or turf, a shallower depth of roughly 3–4 inches (8–10 cm) is standard. In no-till fields, sampling often goes to 6 inches or is split into 0–2″ and 2–6″ increments. Whatever depth you choose, be consistent – all cores for that sample must be taken equally deep. If you mix shallower and deeper cores, the nutrient readings will be diluted or skewed and won’t reflect reality.

3. Creating the Composite Sample: Pour all the cores from one zone into the clean bucket. Thoroughly mix the soil together, breaking up any clumps by hand or with a trowel. The goal is a uniform, homogenous mix. Once mixed, the bucket’s contents are a composite of the zone. However, the lab only needs a few pounds of soil, so you must reduce the bulk. A common method is quartering: spread the mixed soil out on a clean sheet or tray, divide it into four equal parts. Discard two opposite quarters and leave the other two. Then remix the remaining soil and, if still too much, repeat the process. Quartering ensures the final subsample is still representative. When done, take about 1–2 pounds (0.5–1 kg) of soil from the mix and place it in your sample bag or box. That portion is your final composite sample for the lab.

4. Proper Labeling and Documentation: Immediately label the sample container with critical details. At minimum, write the Sample ID, date, field or farm name, and the soil depth. Note any other info on the label or a form: for example the intended crop and any identifiers (e.g. “Zone A – Cornfield, 0–6″”). Also keep a record (notebook or chain-of-custody form) of who collected the sample, from exactly where, and how it was handled. Good records prevent confusion later. Accurate labeling is crucial – a mix-up can invalidate the sample.

Post-Collection: Handling and Submission of Representative Soil Sample

Recent lab audits report that about 15 % of submitted soil samples suffer from poor handling (e.g. contamination, overheating, mislabeling), which reduces confidence in test results. In international lab networks, shipping delays longer than 7 days increase nitrogen test errors by 10–20 %. Accelerated courier services and cold-pack shipping have become more popular to preserve sample integrity.

Once the Representative Soil Sample is collected and bagged, handle it carefully to preserve quality. Keep samples cool and out of direct sun until they reach the lab. Do not leave them baking in a hot vehicle. Do not use metal containers for shipping – even the inside of metal buckets can leach iron or other metals into the soil. If needed, store samples in a refrigerator or cooler, especially if it’s very hot outside. If you must delay sending the sample, you can air-dry most samples at room temperature – spread the soil in a thin layer on paper and let it dry. (Breaking clumps as it dries is okay.) However, if the lab will test for nitrate-nitrogen (NO₃-N), ammonium, or soil microbes, do not air-dry those samples, as drying will alter these measurements. In those cases, ship the sample moist and cool as soon as possible.

When submitting the sample to a lab, fill out their submission form completely. Include all relevant field and crop history – what crops were grown, what fertilizers or manures have been applied recently, and what you plan to grow. This context helps the lab interpret results. Also choose the appropriate tests. A standard soil test typically measures pH, buffer pH, organic matter, cation exchange capacity, phosphorus (P), potassium (K), calcium (Ca), magnesium (Mg), and sometimes micronutrients. If you have specific concerns (e.g. heavy metals, salinity, or soil biology), be sure to request those analyses. In short, provide the lab with as much information as they need to analyze the sample properly and make useful recommendations.

Special Considerations and Variations

In recent research, soil health indicators such as active carbon and microbial biomass are gaining attention. Over 60 % of advanced agronomic programs now include at least one biological test during soil sampling. Environmental regulators in many countries now mandate hotspot mapping with at least 5 discrete samples per 100 m² in suspected contaminated zones.

1. Agricultural Fertility Sampling: For typical crop fields, focus on the root zone (top 6–8 inches) and use management zones as discussed. Each zone’s composite sample reflects its specific soil conditions. If historic fertilizer bands are present, or if precision zones (from yield maps) exist, use those in planning samples.

2. Environmental Contamination: When testing for pollutants, sometimes the goal is to find “hot spots.” In those cases, simple random composites may miss a tiny patch of contamination. Investigators often use a systematic grid or directed sampling in addition to composites. For example, they might overlay a grid on the site and sample each grid cell, or take many small “grab” samples around suspected areas. This strategy sacrifices representativeness for thorough detection. (For formal cleanup work, strict chain-of-custody and discrete samples may be required.)

3. Soil Health/Biological Sampling: If assessing soil biology (microbial activity, earthworms, etc.), handle the sample extra carefully. These tests require living organisms, so samples must be kept cold and processed fast. Do not dry these samples – keep them sealed in a cool box and ship overnight if possible. Even the act of mixing and sampling should be done gently to avoid stressing microbes.

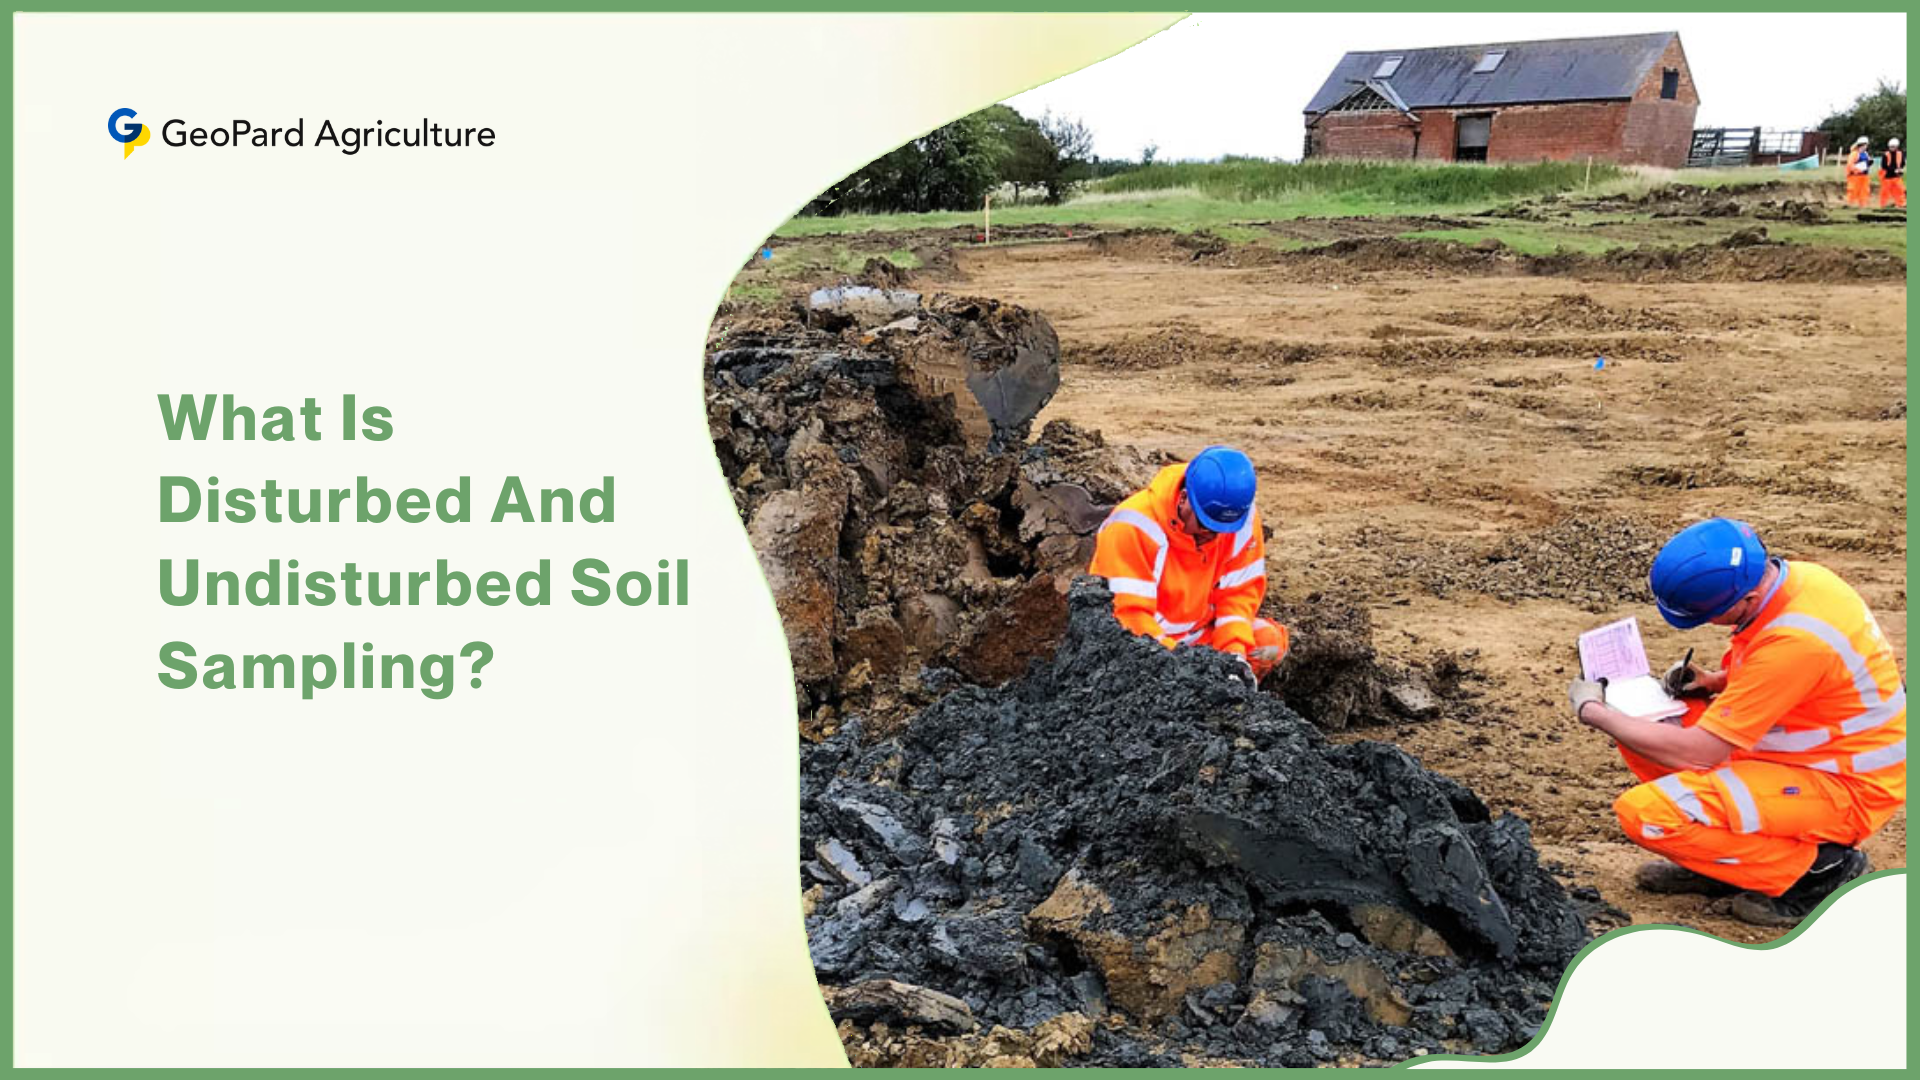
4. Layered (Profile) Sampling: In forests or detailed research, soil often is sampled by depth horizons. For example, take separate cores for 0–15 cm, 15–30 cm, 30–60 cm, etc., and label each depth layer. These layers are then analyzed separately. (A similar idea is splitting for no-till vs. tilled fields.) This approach helps understand how nutrients or contaminants vary with depth.

Common Mistakes to Avoid

Across many extension programs, a survey found that 70 % of farmers make at least one common sampling error (too few cores, poor labeling, or mixing zones). In a recent training program, reducing these errors improved test consistency by 20 %. Therefore, emphasizing best practice in sampling is not just theoretical—it makes lab results more dependable.

  • Too few subsamples: Collecting only a handful of cores (e.g. 3–5) is usually insufficient in a typical field. Experts recommend at least 15 per composite. Too few cores means you may have accidentally sampled a lucky or unlucky spot, and the result won’t reflect the whole area.
  • Sampling only a small or unusual spot: Some people take one or two samples near a convenient corner, gate, or road. This is not representative. A tiny localized area (even if it looks like the rest) can mislead you. Also avoid very strange spots: old fence rows, near manure piles, feedlots or burnt areas should be skipped or sampled separately.
  • Mixing different management zones: Don’t combine soil from different fields or zones into one sample. For example, do not dump soil from both a fertilized corner and an unfertilized corner into the same bucket – their nutrients can cancel out and hide real problems. Each distinct area should have its own composite. (As a rule, one composite sample should represent no more than about 10 acres unless the area is very uniform.)
  • Using dirty or metal tools: A rusty or oily probe, or a metal bucket, can contaminate the sample. Iron or other metals can artificially raise readings of certain nutrients (like zinc or copper). Always use clean tools and plastic containers.
  • Poor labeling or record-keeping: Failing to label the bags immediately or forgetting to note which field the sample came from can ruin everything. If a lab receives unmarked soil, there’s no way to know what fields the results belong to. Always label on-site and double-check your notes.

By avoiding these mistakes and following a careful protocol, you ensure the soil test results are meaningful. A lot of effort goes into taking a representative soil sample – but it pays off by giving you confidence in the data.

Záver

A representative soil sample is the foundation of any good soil test. By planning zones, collecting many cores, mixing thoroughly, and handling samples properly, you help guarantee that lab results truly reflect your land. This attention to detail makes soil testing worth the effort. In the U.S. alone, farmers and consultants analyzed roughly 10 million soil samples in 2020, and they rely on each one to make decisions about fertilizer, lime, and amendments. With so many tests each year, the quality of those tests rests entirely on the samples collected.

When samples are truly representative, the payoff is smarter, more cost-effective management – higher yields where needed and fewer wasted inputs where not. It’s an investment: the work you put into taking a proper sample will return manyfold in the reliability of your fertilization plan or cleanup effort. In short, remember that good sampling is the first step to good soil management.

Automatizované plánovanie odberu vzoriek pôdy

Automatizované plánovanie odberu vzoriek pôdy je moderná technika presného poľnohospodárstva, ktorá využíva softvér a algoritmy na navrhovanie optimalizovaných schém odberu vzoriek pre poľnohospodárske polia. Namiesto manuálneho výberu miest na odber vzoriek (napríklad prechádzaním poľa v sieti alebo kreslením subjektívnych zón) automatizované systémy prijímajú rôzne vrstvy údajov (mapy, historické výnosy, satelitné snímky atď.) a vypočítavajú, kde sa majú odoberať pôdne jadrá.

Stručne povedané, nahrádza väčšinu dohadov a manuálneho úsilia vedeckými poznatkami založenými na údajoch. Moderné nástroje dokážu “zostaviť plány odberu vzoriek pôdy v priebehu niekoľkých minút na jednom alebo mnohých poliach” výberom možností odberu vzoriek v sieti alebo zóne a použitím “inteligentných algoritmov [na] umiestnenie bodov a trasovanie cesty”. Cieľom je presne zachytiť variabilitu pôdy a zároveň minimalizovať čas, náklady a prácu v teréne.

V čom sa líši od tradičného výberu vzoriek?

Tradičné metódy odberu vzoriek často zahŕňali rozdelenie poľa na rovnaké bunky (odber vzoriek z mriežky) alebo heuristické zóny a následný odber pevného počtu jadier v každej z nich. Napríklad pri sieťovom vzorkovaní sa pole rozdelí na pravidelnú sieť (často 1-5 akrov) a v každej bunke sa odoberú pôdne jadrá. Hoci je tento postup široko používaný, môže znamenať stovky vzoriek a veľmi vysoké náklady na prácu: rovnomerne rozmiestnená mriežka môže priniesť veľký počet sond, čo zvyšuje čas a náklady potrebné na odber aj laboratórne práce.

Podobne aj výber vzoriek zón sa spoliehal na úsudok agronóma pri kreslení máp “zón hospodárenia” (predpokladané podobné oblasti), čo však bolo subjektívne a mohlo dôjsť k prehliadnutiu skrytých zákonitostí. Naproti tomu automatizované plánovanie využíva údaje (ako sú mapy úrod, prieskumy pôdy, satelitné snímky NDVI alebo snímky elektrickej vodivosti) na identifikáciu skutočných modelov variability. V skutočnosti umožňuje počítačom určiť, kde by sa mali odobrať malé pôdne jadrá, aby konečné laboratórne testy čo najlepšie reprezentovali pole.

Hlavný cieľ automatizovaného plánovania odberu vzoriek pôdy je jednoduchý: maximalizovať kvalitu údajov a prehľad a zároveň minimalizovať úsilie a náklady. Dobrý odber vzoriek zachytáva skutočnú variabilitu poľa, čo umožňuje neskoršie presné hnojenie alebo vápnenie. Odber tisícov zbytočných vzoriek je zároveň nehospodárny. Automatizované plánovanie hľadá štatistický “sweet spot” - dostatok bodov na presné zmapovanie úrodnosti, ale nie viac, ako je potrebné.

V praxi to znamená vysokú presnosť údajov a použiteľné výsledky s čo najmenšími nákladmi a časom. Napríklad jedna nedávna štúdia ukázala, že zoskupenie poľa do homogénnych zón hospodárenia umožnilo poľnohospodárom znížiť počet potrebných pôdnych vzoriek o 50-75% bez toho, aby sa obetovali informácie.

Takéto zvýšenie efektívnosti priamo podporuje vyššie zisky a nižší vplyv na životné prostredie. Poľnohospodárski výskumníci zdôrazňujú, že presné hospodárenie s pôdou (vrátane dôkladného odberu vzoriek) môže zvýšiť produktivitu a znížiť množstvo odpadu, čo je veľmi dôležité, keďže svetová populácia sa do roku 2050 priblíži k 10 miliardám.

Základné komponenty automatizovaného systému plánovania pôdy

V nedávnych prieskumoch o zavádzaní presného poľnohospodárstva viac ako 40% veľkých poľnohospodárskych podnikov na celom svete uvádza, že v rámci svojich bežných činností používajú pokročilé dátové vrstvy, ako sú satelitné snímky alebo mapy elektrickej vodivosti pôdy (údaje z roku 2024). V roku 2023 globálny trh s presným poľnohospodárstvom presiahol 10 miliárd USD, pričom pôda a služby založené na údajoch rastú ročne tempom takmer 12%.

Tieto skutočnosti zdôrazňujú, že základné komponenty opísané nižšie nie sú teoretickými, ale čoraz bežnejšími nástrojmi v moderných poľnohospodárskych podnikoch. Automatický plánovač odberu pôdnych vzoriek sa zvyčajne skladá z troch častí:

  • dátové vstupy,
  • algoritmy analýzy a
  • výstupy/dodávky.

Každá časť sa kombinuje, aby sa surové údaje z terénu zmenili na plán odberu vzoriek pripravený na použitie.

A. Vstupy a integrácia údajov

Automatizovaný plánovací softvér využíva rôzne údaje z terénu. Medzi bežné vstupy patria:

1. Geopriestorové mapy: Tieto údaje informujú počítač o tom, kde a ako sa pole fyzicky mení. Príkladom sú digitálne hranice poľa (často ako súbory shapefile alebo KML) a modely topografie/výšok (údaje DEM). Nadmorská výška ovplyvňuje vlhkosť pôdy a distribúciu živín, takže plánovači často odlišne zaťažujú vysoké a nízke oblasti. Ak sú k dispozícii, vstupmi môžu byť aj vrstvy GIS poľnohospodárskych podnikov, ako sú existujúce zóny hospodárenia.

Základné komponenty automatizovaného systému plánovania pôdy

2. Historické údaje z testov pôdy: Veľmi cenné sú výsledky predchádzajúcich analýz pôdy (napríklad mapy pH, dusíka, fosforu, draslíka, organických látok). Priamo ukazujú, kde má pôda nízku alebo vysokú úrodnosť. Plánovači môžu importovať predchádzajúce laboratórne výsledky vo forme máp alebo tabuliek. Ak sa na farme testuje už roky, táto história pomáha prispôsobiť plán známym problematickým miestam.

3. Mapy výnosov: Mnohé farmy majú k dispozícii monitory výnosov kombajnov z predchádzajúcich sezón. Vrstvy, ktoré ukazujú, v ktorých častiach poľa sa trvalo dosahujú vysoké alebo nízke výnosy, môžu naznačovať základné rozdiely v pôde. Napríklad časti poľa, ktoré boli vždy málo výnosné, môžu byť chudobné na živiny; plánovači odberu vzoriek používajú mapy frekvencie výnosov, aby našli takéto oblasti. Odporúča sa kombinovať údaje o výnosoch z viacerých rokov, aby neobvyklé počasie v jednom roku (záplavy, sucho) neskreslilo plán.

4. Údaje z diaľkového prieskumu Zeme: Satelitné alebo dronové snímky úrody sú neoceniteľné pri pozorovaní vzorov neviditeľných voľným okom. Vegetačné indexy ako NDVI (Normalized Difference Vegetation Index) alebo NDRE zachytávajú vitalitu rastlín, často odrážajú úrodnosť alebo vlhkosť pôdy. Letná mapa NDVI bez mrakov môže poukázať na zóny trvalo lepšieho alebo horšieho rastu plodín. Mnohí plánovači využívajú aj letecké alebo multispektrálne snímky z dronov. Okrem toho mapy proximitných senzorov, ako je elektromagnetická vodivosť (ECa), poskytujú informácie o štruktúre pôdy a obsahu solí, ktoré často korelujú s úrodnosťou.

V praxi dobré plánovače umožňujú používateľom importovať alebo prepojiť ktorúkoľvek z týchto vrstiev. Napríklad cloudový nástroj môže poľnohospodárovi umožniť nahrať shapefile s hranicami poľa a potom prekryť obrázok NDVI a mapy výnosov pre to isté pole. Softvér ich potom analyzuje spoločne.

Ako sa uvádza v jednej príručke, vlastnosti pôdy, ako je organický uhlík, elektrická vodivosť (ECa), štruktúra pôdy (piesok/piesk/hlina), topografia, letecké snímky a indexy ako NDVI, sa ukázali ako užitočné pri vymedzovaní zón hospodárenia. Spojením týchto vrstiev údajov do jedného systému môže plánovač “vidieť” celkový obraz variability poľa ešte pred výberom vzorkovacích bodov.

B. Plánovací algoritmus a logika

Základom automatizovaného odberu vzoriek pôdy sú algoritmy. Od roku 2025 mnohé komerčné platformy v súčasnosti integrujú techniky zhlukovania strojového učenia, hybridné štatistické modely alebo generovanie zón na základe PCA. Ich výkonnosť sa často porovnáva krížovou validáciou s použitím zadržaných údajov o pôde, pričom používatelia uvádzajú až 15-20% zlepšenie zachytenia odchýlok v porovnaní so starými metódami. Nižšie je uvedené, ako fungujú typické metódy:

1. Zónový (zoskupený) výber vzoriek: Ide o najbežnejšiu metódu. Systém využíva logiku zhlukovania vstupných máp na rozčlenenie poľa na samostatné zóny, ktoré sú si vnútorne podobné. Môže napríklad spustiť k-means zhlukovanie na kombinovaných vrstvách údajov (napr. úroda+NDVI+údaje o pôde), aby vytvoril 3-6 “zón riadenia”. Keďže sa predpokladá, že každá zóna je pomerne jednotná, na každú zónu je potrebných len niekoľko vzoriek.

Softvér potom rozdeľuje body odberu vzoriek v rámci každej zóny (často ako malú mriežku alebo náhodné body), aby sa zachytila zostávajúca variabilita. Moderné nástroje často umožňujú používateľovi vážiť rôzne vrstvy údajov alebo upraviť počet zón. Niektoré dokonca používajú PCA (analýzu hlavných komponentov), aby najprv zredukovali údaje a potom zoskupili výsledky.

Algoritmus plánovania a logika automatizovaného odberu vzoriek pôdy

2. Odber vzoriek v sieti: V tomto režime softvér jednoducho prekryje pole pravidelnou mriežkou a vygeneruje bod v strede každej bunky. Používatelia môžu nastaviť veľkosť bunky (napr. 1,5 akra) alebo celkový počet bodov. Plánovač môže tiež prispôsobiť hustotu mriežky v premenlivom teréne: napríklad menšie bunky na kopcoch, kde je vyššia variabilita, a väčšie bunky na rovine. Výhodou je rovnomerné pokrytie bez skreslenia.

Nevýhodou je, že veľmi jemná mriežka znamená veľa vzoriek, ale pri hrubej mriežke môžu chýbať detaily. Automatizované systémy môžu pomôcť vybrať primerané rozmiestnenie - napríklad štúdie naznačujú, že mriežka s rozlohou 1 akra zachytí približne 80% variability poľa, zatiaľ čo mriežka s rozlohou 2,5 akra klesne na presnosť ~ 76%. Niektoré softvéry poskytujú spätnú väzbu o očakávanej presnosti alebo pokrytí na základe zvolenej mriežky.

3. Riadený (cielený) výber vzoriek: Niektoré polia majú špecifické známe problémy (napr. zasolené miesta, “mŕtve zóny” s nízkym výnosom alebo oblasti so zhutnením). Automatický plánovač ich môže zahrnúť tak, že tam umiestni dodatočné body. Ak napríklad satelitné snímky alebo mapa ES ukazujú horúce miesto so zasolením, používateľ môže dať nástroju pokyn, aby v tejto oblasti pridal vzorky. Tým sa zabezpečí, že problematické oblasti sa budú vzorkovať intenzívnejšie.

4. Štatistické kontroly: Základom všetkých metód je štatistický základ. Plánovači často zabezpečujú, aby počet a umiestnenie vzoriek spĺňali základné štatistické požiadavky na reprezentatívnosť. Môžu napríklad skontrolovať, či má každá zóna minimálnu plochu alebo či sú vzorky rozložené tak, aby sa zabránilo ich zhlukovaniu.

Niektoré používajú simulácie Monte Carlo alebo priestorovú štatistiku na overenie, že návrh plánu pravdepodobne zachytí variabilitu poľa. Cieľom je vyhnúť sa neobjektívnemu výberu vzoriek; automatickým generovaním bodov systém odstraňuje bežný problém “pohodlného výberu vzoriek” (odber vzoriek len tam, kde sa dá ľahko prejsť) a namiesto toho sa riadi systematickými alebo náhodnými vzormi diktovanými údajmi.

V mnohých systémoch sa algoritmus spustí raz po nastavení všetkých vrstiev a parametrov. Napríklad cloudová aplikácia sa môže spustiť v priebehu niekoľkých sekúnd a vydať mapu červených a žltých bodov v každej zóne (pozri obrázok nižšie). Tieto body predstavujú miesta, kde by sa mali odobrať pôdne jadrá.

Program môže interne používať bežné zhlukovacie nástroje (napr. K-means, fuzzy c-means) alebo vlastné heuristiky na vyváženie umiestnenia bodov. Po definovaní zón mnohé nástroje používajú jednoduché geometrické vzory (napr. jadrové čiary alebo cik-cak) v rámci každej zóny na rozmiestnenie skutočných bodov odberu vzoriek.

C. Výstupy a výsledky

V prieskumoch v roku 2024 viac ako 70% služieb presného poľnohospodárstva uviedlo, že medzi najviac oceňované funkcie patrí automatizovaný export (trasy GPS, štítky s etiketami). Bezproblémové odovzdávanie z plánu na pole sa stáva diferenciátorom v poľnohospodárskom softvéri. Konečným výstupom automatizovaného plánovača odberu vzoriek je zvyčajne súbor konkrétnych pokynov pre poľnú posádku, vrátane:

1. Georeferencovaná mapa bodov odberu vzoriek: Zvyčajne ide o mapu (PDF, vrstvu GIS alebo trasu mobilnej aplikácie), na ktorej sú zobrazené súradnice GPS každého pôdneho jadra. Môže zobrazovať farebné zóny a očíslované body. Terénni technici používajú túto mapu na tablete alebo výtlačku na navigáciu v teréne. Niektoré systémy sa dokonca exportujú do populárnych aplikácií GPS-NAV alebo do formátov (napríklad ISOXML), ktoré sa automaticky načítajú do náhlavných súprav pre presné poľnohospodárstvo.

2. Protokol o odbere vzoriek/objednávka práce: Ide o písomnú príručku, v ktorej je opísaný spôsob realizácie plánu. Zvyčajne obsahuje pokyny týkajúce sa hustoty vzoriek (napr. “odoberte 5 jadier na zónu”), hĺbky (napr. 0 - 6 palcov, 6 - 24 palcov), potrebných nástrojov na odber vzoriek a konvencií označovania. Môže uvádzať, ktoré body sú “jadrové” vzorky (každá odobratá samostatne) alebo “zložené” (viacero zmiešaných čiastkových jadier). Softvér môže generovať laboratórne štítky alebo štítky na vrecia s jedinečnými identifikátormi zodpovedajúcimi každému bodu.

3. Šablóny na import údajov: Po odobratí vzoriek a ich laboratórnom testovaní sa výsledky musia opätovne integrovať do plánovača. Mnohé systémy poskytujú šablónu Excel alebo CSV, do ktorej možno vložiť laboratórne výsledky po riadkoch (jeden riadok na každý bod). Keď sa šablóna nahrá späť, softvér automaticky znovu prepojí údaje o pôde so súradnicami mapy. Tým sa cyklus uzatvára a umožňuje okamžité generovanie máp vlastností pôdy. Automatizované plánovače to často zvládajú bez problémov, takže nové údaje sa vkladajú priamo do systému GIS alebo VRA (aplikácia s premenlivou sadzbou) farmy.

Tieto výstupy zabezpečujú, že plán sa môže vykonať s minimálnymi nejasnosťami a že údaje sa vrátia pripravené na rozhodovanie. Niektoré pokročilé nástroje dokonca automaticky vytlačia súbory s GPS navigáciou a štítky s etiketami. Kľúčom je integrovaný pracovný postup: keď sú údaje v systéme, plánovač vykoná ťažkú analýzu a jednoducho odovzdá jasné pokyny posádke.

Automatizovaný pracovný postup plánovania odberu vzoriek pôdy (krok za krokom)

Hlavní poskytovatelia softvéru pre presné poľnohospodárstvo uvádzajú, že do roku 2025 bude viac ako 60% ich používateľov vytvárať plány odberu vzoriek pôdy ako súčasť rutinných činností. Mnohí poľnohospodári teraz považujú plánovanie odberu vzoriek za štandardný ročný krok, a nie za špeciálny projekt. Toto rastúce prijatie zdôrazňuje dôležitosť pochopenia nižšie uvedeného pracovného postupu. Typický automatizovaný projekt odberu vzoriek pôdy sa riadi jasnou postupnosťou krokov. Tie sú často zabudované do plánovacej aplikácie ako riadený proces:

i. Definujte ciele: Pred plánovaním používateľ uvedie, prečo chce odoberať vzorky. Je to na vytvorenie podrobnej mapy živín pre hnojenie s premenlivou dávkou? Na stanovenie základnej úrovne zdravia pôdy? Na preskúmanie oblasti s výskytom choroby? Jasné ciele (napr. “Optimalizovať zóny hnojenia N” alebo “Overiť potrebu dávky vápna”) pomáhajú usmerniť neskoršie nastavenia.

Automatizovaný pracovný postup plánovania odberu vzoriek pôdy (krok za krokom)

ii. Nahrávanie údajov a výber vrstvy: Potom používateľ nahrá alebo vyberie vrstvy priestorových údajov, ktoré chce použiť. Napríklad: mapa hraníc poľa (povinná), plus niektorá z výnosových máp, pôdnych prieskumov, snímok NDVI, výškových modelov atď. Často je softvér vopred pripojený k údajom v oblakoch (katalógy satelitných snímok alebo údaje farmy z minulosti), takže používateľ len klikne, ktoré roky alebo vrstvy má zahrnúť.

iii. Nastavenie parametrov: Používateľ potom nastaví intenzitu vzorkovania. Môže to byť cieľový počet bodov na aker (napr. 1 bod na 2 akre), počet požadovaných zón (napr. 3 zóny) alebo veľkosť bunky siete. Používateľ si tiež môže vybrať typ odberu vzoriek (mriežka vs. zóna, jadro vs. zložený materiál). Niektoré systémy umožňujú používateľovi priradiť vrstvám váhu (napr. priradiť mapu pH pôdy pri definovaní zón). V tomto kroku sa kalibruje, ako sa bude algoritmus správať.

iv. Spustenie algoritmu (generovanie plánu): Po nastavení údajov a parametrov plánovač vykoná analýzu. V priebehu niekoľkých sekúnd alebo minút spracuje vstupné vrstvy, vymedzí zóny alebo mriežky a umiestni body odberu vzoriek. Výsledkom je návrh plánu. Moderné systémy môžu zobrazovať 2D mapu alebo 3D pohľad na plán.

v. Kontrola a úprava (voliteľné): Používateľ potom skontroluje plán. Väčšina softvéru umožňuje kliknúť na zóny alebo body, aby sa zabezpečil ich zmysluplný vzhľad. Používateľ môže v prípade potreby ručne pridať alebo odstrániť body (napríklad vyhnúť sa neprístupnej mokrej oblasti alebo pridať bod na novo identifikované studené miesto). Niektoré plánovače umožňujú posúvanie bodov alebo spájanie zón za chodu. Cieľom je však minimálne ručné dolaďovanie - v ideálnom prípade je prvý návrh systému v poriadku.

vi. Plán exportu a príprava terénnych prác: Nakoniec sa dokončený plán exportuje do potrebných formátov. Mapa sa odošle do terénneho zariadenia alebo jednotky GPS. Vytlačia sa laboratórne štítky a pracovný príkaz. V tomto okamihu môžu terénne posádky vyraziť a odobrať presne určené vzorky. Celá fáza plánovania, ktorá predtým zaberala hodiny alebo dokonca dni času agronóma, je teraz stlačená do niekoľkých minút práce so softvérom.

V prípade veľkých poľnohospodárskych podnikov alebo družstiev možno rovnaký pracovný postup zopakovať v dávkovom režime. Mnohé platformy podporujú plánovanie viacerých polí, čo znamená, že používateľ vyberie viacero polí naraz a vygeneruje všetky ich plány odberu vzoriek spoločne. To uľahčuje škálovanie z jedného pokusného poľa na stovky akrov plánovania.

Hlavné výhody automatizovaného plánovania odberu vzoriek pôdy

Nedávne správy z odvetvia ukazujú, že farmy, ktoré používajú automatizované plánovanie, skrátili čas plánovania odberu vzoriek pôdy o 80% alebo viac a mnohé z nich hlásia zníženie nákladov súvisiacich s odberom vzoriek o 20-30% v prvej sezóne. Tieto reálne výsledky odrážajú výhody opísané nižšie. Automatizované plánovanie odberu vzoriek pôdy ponúka v porovnaní s tradičnými metódami niekoľko hlavných výhod:

1. Oveľa vyššia účinnosť: Vďaka automatizácii procesu návrhu sa to, čo predtým trvalo hodiny alebo dni, dá urobiť za niekoľko minút. Keď sú zadané všetky vrstvy údajov, softvér spustí algoritmus takmer okamžite. Jedna platforma napríklad inzeruje, že plány odberu vzoriek pre mnohé oblasti možno vytvoriť “za niekoľko minút”. To výrazne skracuje čas technikov a agronómov. V praxi jediné kliknutie na plánovač vygeneruje desiatky vzorkovacích bodov s presným GPS, čím sa nahradí prácne manuálne mapovanie.

Hlavné výhody automatizovaného plánovania odberu vzoriek pôdy

2. Zvýšená presnosť a objektivita: Plány založené na údajoch odstraňujú ľudskú zaujatosť. Tradičné mapy zón kreslené okom môžu prehliadnuť skrytú variabilitu; automatizované zóny sú založené na skutočne nameraných vzoroch údajov. Algoritmy zabezpečujú, aby body vzorky systematicky pokrývali rozmanitosť poľa. Ako uvádza odborník z MSU Extension, stanovenie zón hospodárenia na základe údajov je “rozhodujúce pre zabezpečenie platnosti a presnosti výsledkov”, pretože zohľadňuje skutočné priestorové rozdiely. Algoritmy zabezpečujú, aby body vzorkovania systematicky pokrývali rozmanitosť poľa.

3. Nákladová efektívnosť: Ak sa vzorky sústredia na dôležité miesta, môže byť celkovo potrebných menej jadier. Štúdie zistili, že dobré plány odberu vzoriek zóny môžu znížiť náklady na laboratórium tým, že si vyžiadajú o 50-75% menej vzoriek. Každý laboratórny test pôdy stojí peniaze, takže obmedzenie duplicitných alebo nepotrebných testov šetrí doláre. Aj skrátenie času stráveného v teréne (menej chodiacich slučiek) šetrí pracovnú silu alebo palivo strojov. Automatizované plánovanie tak zlepšuje návratnosť investícií do testovania pôdy.

4. Lepšia podpora rozhodovania: Kvalitný odber vzoriek vedie ku kvalitnejším predpisom hnojív a rozhodnutiam o hospodárení. Pomocou priestorového vzorkovania môžu poľnohospodári napríklad variabilne upravovať aplikácie vápna a živín na celom poli. Vizualizácia máp nedostatkov (odvodených z hustého vzorkovania) pomáha “efektívne riešiť problémové oblasti” a “dosiahnuť priestorovo variabilné aplikácie živín”. Stručne povedané, lepšie údaje o pôde umožňujú presnejšie dávky P, K, vápna atď., čím sa zvyšujú výnosy alebo šetria vstupné náklady.

5. Škálovateľnosť: Automatizované plánovače sa dajú ľahko rozšíriť. Zvládnu jedno malé pole alebo desiatky polí bez dodatočného úsilia. Funkcie pre viac polí znamenajú, že konzultant môže nahrať 100 polí a automaticky vygenerovať 100 plánov. To sa hodí pre veľké farmy alebo poľnohospodárske služby, ktoré ponúkajú testovanie pôdy vo veľkom rozsahu. S rastom poľnohospodárskych prevádzok funguje rovnaký pracovný postup bez dodatočnej manuálnej záťaže.

Automatizované plánovanie mení odber vzoriek pôdy z ťažkopádnej povinnosti na zjednodušený pracovný postup. Umožňuje poľnohospodárom a agronómom rýchlejšie a lacnejšie získať lepšie pôdne mapy, čo následne zvyšuje efektívnosť hnojenia plodín a hospodárenia s pôdou.

Ako softvér GeoPard pomáha pri automatizovanom plánovaní odberu vzoriek pôdy?

Softvér GeoPard prináša do procesu odberu vzoriek pôdy automatizáciu, inteligenciu a jednoduchosť. GeoPard je určený pre poľnohospodárov, agronómov, pôdne laboratóriá, predajcov a obchodníkov a pomáha vytvárať optimalizované plány odberu pôdnych vzoriek pomocou softvéru v priebehu niekoľkých minút - pre jedno pole alebo celú farmu. Pomocou stránky Návod na používanie softvéru GeoPard na odber vzoriek pôdy, môžete si vybrať medzi odberom vzoriek na základe mriežky alebo zóny, vybrať základné alebo zložené metódy a nechať algoritmy poháňané umelou inteligenciou automaticky umiestniť body odberu, vypočítať trasy, vytlačiť štítky a exportovať mapy pripravené na použitie.

1. Inteligentnejšie plánovanie, rýchlejšie výsledky
Softvérový pracovný postup GeoPard uľahčuje a zefektívňuje plánovanie odberu vzoriek pôdy:

  1. Začatie nového plánu - Vyberte jedno alebo viacero polí alebo skopírujte nastavenia z minulých plánov, aby ste dosiahli konzistenciu.
  2. Typ výberu vzorky - Vyberte si odber vzoriek na základe mriežky pre rovnomerné pokrytie alebo odber vzoriek na základe zón, aby ste sa zamerali na variabilitu terénu.
  3. Nastavenie štýlu ukážky - Zvoľte kompozitný materiál pre nákladovú efektívnosť alebo odber jadrových vzoriek pre podrobnú analýzu pôdy.
  4. Konfigurácia bodov a cesty - Inteligentná logika programu GeoPard umiestňuje body pomocou adaptívnych algoritmov, ako je inteligentné odporúčanie, základná línia, vzory N/Z alebo W.
  5. Optimalizácia smerovania - Vyberte možnosť Smart Optimal Path (Inteligentná optimálna cesta) pre automatické vzorkovače alebo Zone-by-Zone routing (Smerovanie po jednotlivých zónach) pre manuálne tímy.
  6. Tlač a export - Tlačte vlastné štítky a exportujte plány ako KML alebo Shapefile pre navigáciu GPS.

Ako GeoPard pomáha pri automatizovanom plánovaní odberu vzoriek pôdy

2. Inteligentné funkcie, ktoré šetria čas
Softvér GeoPard riadený umelou inteligenciou sa automaticky prispôsobuje tvaru, variabilite a údajom každého poľa. Môžete ovládať veľkosť mriežky, počet bodov na zónu, hĺbku vzorkovania a uhly natočenia - čím sa zabezpečí presné a zároveň efektívne pokrytie vzorkovaním.

Plánovanie na viacerých poliach umožňuje konzultantom alebo veľkým farmám vytvoriť viacero plánov odberu vzoriek pôdy v jednom kroku, pričom sa zachováva konzistentnosť v rôznych ročných obdobiach a regiónoch.

3. Vykonávanie plánov v teréne pomocou aplikácie GeoPard Mobile
Mobilná aplikácia GeoPard umožňuje tímom v teréne bezproblémovo vykonávať odber vzoriek. Môžete si prezerať mapy, navigovať sa na jednotlivé body a označovať vzorky ako dokončené, a to aj v režime offline. Aplikácia podporuje aj sledovanie v reálnom čase, zaznamenávanie poznámok a tlač štítkov priamo z mobilných zariadení.

Ako GeoPard pomáha pri automatizovanom plánovaní odberu vzoriek pôdy

4. Jednoduché označovanie a export
GeoPard zjednodušuje označovanie pomocou automatických zónových alebo bodových šablón. Používatelia si môžu stiahnuť a vytlačiť hotové štítky PDF pre vrecia s pôdou alebo laboratórne vzorky, vďaka čomu je možné sledovať každé jadro. Plány a trasy je možné exportovať aj do navigačných aplikácií, čím sa zabezpečí plynulá realizácia od plánovania až po dodanie do laboratória.

5. Prečo si profesionáli vyberajú softvér GeoPard na odber vzoriek pôdy

  • Rýchlosť: Plány odberu vzoriek pôdy zostavíte za niekoľko minút.
  • Presnosť: Inteligentné algoritmy optimalizujú každý bod odberu vzoriek.
  • Flexibilita: Podporuje odber vzoriek v mriežke aj v zóne, jadrové a kompozitné metódy.
  • Škálovateľnosť: Plánujte pre jedno pole alebo stovky.
  • Účinnosť v teréne: Navigácia v režime offline a živé sledovanie postupu.

GeoPard mení odber vzoriek pôdy na zjednodušený pracovný postup založený na údajoch. Vďaka plánovaniu s umelou inteligenciou, inteligentnému smerovaniu a integrovaným mobilným nástrojom pomáha používateľom zbierať spoľahlivejšie údaje o pôde - rýchlejšie a dôslednejšie. Vďaka nemu je automatizované plánovanie odberu pôdnych vzoriek inteligentnejšie, rýchlejšie a pripravené na budúcnosť presného poľnohospodárstva.

Praktické aspekty implementácie

V štúdii z roku 2025 sa zistilo, že viac ako 30% neúspešných projektov presného merania bolo spôsobených nízkou integritou údajov alebo nesúladom medzi softvérom a hardvérom. To zdôrazňuje, aké dôležité sú nasledujúce praktické body pri zavádzaní automatizovaného plánovania odberu vzoriek. Hoci výhody sú jasné, úspešné používanie automatizovaného plánovania odberu vzoriek závisí od niekoľkých kľúčových praktických faktorov:

1. Kvalita údajov je rozhodujúca: Odpadky dovnútra, odpadky von. Automatizovaný plán môže byť len taký dobrý, aké dobré sú údaje, ktoré sa do neho vkladajú. Ak majú mapy výnosov chyby GPS alebo ak je vrstva pôdneho prieskumu zastaraná, výsledné zóny môžu byť zavádzajúce. Odborníci na presné poľnohospodárstvo zdôrazňujú starostlivú správu údajov: vždy zhromažďujte a kalibrujte svoje zdrojové údaje.


Praktické aspekty implementácie automatizovaného plánovania odberu vzoriek pôdy

Napríklad zlá kalibrácia monitorov výnosu alebo nesprávne označené polia môžu neskôr viesť k zlým predpisom. V jednom z článkov sa pestovateľom priamo pripomína: “Všetci sme počuli frázu ‘odpadky dovnútra, odpadky von’. Nepresné alebo zlé údaje môžu mať následky na mnoho rokov.” Inými slovami, pred spustením automatizovaných plánov investujte čas do čistenia a overovania vstupov.

2. Softvér a platformy: Tieto nástroje majú rôzne formy. Niektoré sú samostatné programy GIS pre stolové počítače, iné sú cloudové alebo mobilné aplikácie. Mnohé cloudové platformy pre presnú agrotechniku (napríklad Trimble Ag Software, Climate FieldView, FarmLogs alebo špecializované nástroje ako GeoPard alebo AgLeader SMS) v súčasnosti obsahujú moduly pre automatický odber vzoriek.

Poľnohospodári alebo poradcovia by si mali vybrať platformu, ktorá sa dobre integruje s ich existujúcimi systémami. Mala by importovať bežné formáty údajov (shapefile, výnosy .csv, snímky) a exportovať ich do jednotiek GPS alebo mapovacích aplikácií. Zvážte aj náklady/predplatné: niektoré služby sa účtujú za plán alebo za aker.

3. Kompatibilita hardvéru a exportu: Plán je užitočný len vtedy, ak ho vzorkovateľ dokáže dodržiavať. Uistite sa, že výstupný formát (mapy, súbor GPS alebo údaje z aplikácie) funguje s vašimi terénnymi zariadeniami. Mnohé systémy exportujú priamo do mobilných tabletov alebo nástrojov RTK-GPS. Iné môžu poskytovať súbory KML alebo shapefile, ktoré možno načítať do všeobecných navigačných aplikácií. Skontrolujte, či štítky a dátové listy zodpovedajú tomu, čo očakáva vaše pôdne laboratórium. V podstate by mal byť prepojený celý reťazec - od plánovania cez zber vzoriek až po laboratórnu analýzu.

4. Integrácia do pracovného postupu presnej poľnohospodárskej výroby: Odber vzoriek pôdy je jedným z krokov v širšom cykle presného poľnohospodárstva. Po plánovaní (Plan) nasleduje odber vzoriek (vykonanie prác na poli) → analýza (odoslanie jadier do laboratória, získanie výsledkov) → predpísanie (použitie údajov na vytvorenie aplikačných máp) → aplikácia (variabilná dávka aplikácie na poli). Automatizované plánovanie by malo hladko zapadnúť do tohto cyklu.

Napríklad po získaní výsledkov by sa údaje mali zapojiť do softvéru na riadenie živín alebo nástrojov na hnojenie VR. Dobrý plánovací softvér sa často s týmito systémami integruje. MSU Extension uvádza, že po odbere vzoriek vizualizácia výsledkov umožňuje efektívnu aplikáciu: napríklad poľnohospodári môžu na základe laboratórnych máp meniť dávky vápna alebo hnojív v jednotlivých zónach.

5. Školenie a zapojenie používateľov: Napokon, prijatie automatizovaného plánovania znamená dôveru v technológiu. Manažéri fariem a agronómovia môžu potrebovať školenie, aby pochopili, ako sa zóny vytvárajú. Je rozumné začať s pilotnými skúškami: spustite automatizovaný plán paralelne s osvedčeným manuálnym plánom pre jedno pole a porovnajte výsledky.

Postupom času, keď používatelia uvidia úsporu času a (v ideálnom prípade) lepšiu konzistenciu, dôvera vzrastie. V mnohých prípadových štúdiách pestovatelia zisťujú, že objektívne odvodené zóny sa často zhodujú s ich intuíciou až dodatočne - ale ich vytvorenie si vyžaduje oveľa menej úsilia.

Budúce trendy v automatizovanom odbere vzoriek

Podľa odhadov trhu presiahne do roku 2025 kombinovaný trh s autonómnymi poľnými robotmi a nástrojmi na presné plánovanie pôdy 1,2 miliardy USD s dvojciferným ročným rastom. Prvé skúšky zároveň ukazujú, že robotické vzorkovače dokážu trafiť body GPS s chybou <10 cm, čím prekonávajú manuálne posádky v hustej vegetácii. Tieto signály naznačujú, kam toto odvetvie smeruje. Oblasť odberu vzoriek pôdy sa naďalej rýchlo vyvíja. Aj okrem automatizovaných plánovacích algoritmov vidíme na obzore niekoľko zaujímavých trendov:

1. Umelá inteligencia a strojové učenie: Okrem jednoduchého zhlukovania sa používajú aj pokročilé metódy umelej inteligencie. Výskumníci napríklad vyvíjajú nástroje, ktoré využívajú hlboké učenie na historických satelitných snímkach na predpovedanie stavu pôdy a navrhovanie vzorkovacích bodov. Štátna univerzita v Mississippi je súčasťou projektu 11 inštitúcií financovaného USDA-NIFA, ktorého cieľom je vyvinúť nástroj “Satellite-based Soil Sampling Design” (S3DTool).

Tento systém bude používať algoritmus hlbokého učenia na viacročných satelitných snímkach na automatické odporúčanie miest odberu vzoriek, pričom sa v podstate na základe minulých satelitných údajov naučí, v ktorých oblastiach je potrebné odoberať vzorky. V prípade úspechu by takéto nástroje založené na umelej inteligencii mohli umožniť ešte autonómnejšie a predvídavejšie plánovanie, ktoré by zohľadňovalo jemné vzorce počasia a plodín v priebehu času.

2. Senzory v reálnom čase a proximálne senzory: Výskumníci a spoločnosti skúmajú senzory na cestách, ktoré by mohli znížiť potrebu fyzických jadier. Napríklad optické senzory namontované na zariadeniach môžu nepretržite merať odrazivosť plodín alebo pôdy. Senzory elektrickej vodivosti ťahané po poli môžu vytvárať mapy štruktúry pôdy za chodu.

V budúcnosti sa dá predpokladať, že sadzač alebo postrekovač bude mať na sebe pôdne sondy, ktoré budú automaticky odoberať vzorky počas pohybu. Tieto údaje by sa mohli priamo vkladať do plánovacieho systému (alebo dokonca nahradiť diskrétne jadrá) na takmer kontinuálne mapovanie pôdy. Ako uvádza jeden z blogov o presnom poľnohospodárstve, už teraz máme senzory ako Greenseeker alebo Veris EC, ktoré vytvárajú mapy vo veľmi jemnom meradle - trend smeruje k ich prepojeniu s analýzou v reálnom čase.

3. Autonómny robotický odber vzoriek: Okrem plánovania sa objavujú aj úplne autonómne vzorkovače. Namiesto technika so sondou niektoré farmy nasadia robotické vozidlá, ktoré budú zbierať jadrá presne v plánovaných bodoch GPS. Spoločnosti ako RogoAg už predávajú samočinné odbery vzoriek pôdy s navádzaním RTK-GPS, aby zakaždým presne trafili miesta (v poľných skúškach dosiahli robotické odbery vzoriek vyššiu presnosť a konzistenciu ako ľudská obsluha).

Keď sa tieto roboty stanú bežnými, pracovný postup odberu vzoriek by sa mohol stať skutočne bezproblémovým: automatizovaný plán → nasadenie robota → automatizovaný odber jadra → označovanie vzoriek. Tým sa výrazne zvýši priepustnosť testovania pôdy. Aj keď je to stále novinka, odborné prieskumy naznačujú, že robotizácia (pri pletí, prieskume atď.) sa rozširuje - a odber pôdnych vzoriek je prirodzene vhodný pre automatizáciu, pretože každé miesto jadra je bodom GPS.

4. Integrované rozhodovacie platformy: Napokon očakávame, že plánovanie odberu vzoriek bude jednou zo súčastí stále väčších integrovaných systémov riadenia fariem. Budúce platformy môžu nielen navrhovať miesta odberu vzoriek, ale aj okamžite analyzovať vrátené údaje, prepojiť ich s trhmi s hnojivami, predpoveďami počasia a agronomickými modelmi.

Jednou z vízií je napríklad systém, ktorý monitoruje trendy stavu pôdy z roka na rok a automaticky upravuje intenzitu odberu vzoriek na základe minulých trendov alebo rizika úrody. To si bude vyžadovať dátové potrubia - analýzy riadené umelou inteligenciou, cloudové výpočty a pripojenie k internetu vecí. Stručne povedané, “inteligentná farma” budúcnosti bude brať odber vzoriek pôdy ako nepretržitý, automatizovaný proces, integrovaný so všetkým od traktorov s GPS až po prísun údajov o počasí.

Záver

Automatizované plánovanie odberu pôdnych vzoriek predstavuje silnú konvergenciu poľnohospodárstva a dátovej vedy. Využitím GIS, senzorov a inteligentných algoritmov mení odber vzoriek pôdy z únavnej práce na rýchly, presný a škálovateľný proces. Poľnohospodári a agronómovia využívajúci tieto nástroje môžu získať presnejší obraz o úrodnosti pôdy a zároveň ušetriť prácu a náklady. V praxi to znamená bohatšie mapy pôdy, lepšie cielené hnojenie a v konečnom dôsledku zdravšie plodiny a pôdu.

S pokračujúcim pokrokom presného poľnohospodárstva očakávame ešte užšiu integráciu odberu vzoriek pôdy s analýzou a robotikou v reálnom čase. V súčasnosti už aj základné automatizované plánovanie poskytuje významnú výhodu: plány, ktoré predtým trvali hodiny, sa dajú urobiť za niekoľko minút s istotou, že je zohľadnená každá časť poľa. Pre každého pestovateľa, ktorý má záujem o inteligentnejšie riadenie živín, je pochopenie a prijatie automatizovaného plánovania odberu pôdnych vzoriek kľúčovým krokom k vyššej efektívnosti a udržateľnosti.

Ako si vybrať vzorkovač pôdy? Kľúčové faktory a možnosti rozhodovania

“Nemôžete riadiť to, čo nemeriate” - to platí najmä v poľnohospodárstve, stavebníctve a environmentálnych vedách. Odber pôdnych vzoriek je prvým krokom k pochopeniu stavu pôdy a zabezpečeniu úspechu akéhokoľvek projektu v krajine. V skutočnosti je celosvetový trh s testovaním pôdy na vzostupe: predpokladá sa, že do roku 2025 vzrastie z približne $4,3 miliardy na $6,9 miliardy do roku 2035 (CAGR ≈ 4,9%).

Poľnohospodári, krajinári a inžinieri hľadajú lepšie údaje o živinách, zhutnení a kontaminantoch v pôde. Ako si však pri takom množstve dostupných vzorkovačov vybrať ten správny?

Definujte svoju aplikáciu a typ pôdy

Vlastnosti pôdy priamo ovplyvňujú produktivitu, bezpečnosť a environmentálne výsledky. Napríklad Organizácia OSN pre výživu a poľnohospodárstvo uvádza, že nízka úrodnosť pôdy prispieva k stratám výnosov až do výšky 30% v malých poľnohospodárskych podnikoch na celom svete.

Geotechnické prieskumy pritom ukazujú, že viac ako 50% porúch stavieb v rozvojových krajinách súvisí so zlým posúdením pôdy. Výber správneho vzorkovača pre vašu aplikáciu a typ pôdy je prvým krokom k predchádzaniu týmto rizikám.

Na čo budete vzorky používať? Rôzne oblasti si vyžadujú rôzne funkcie vzorkovača. Zvážte tieto scenáre:

1. Poľnohospodárstvo a starostlivosť o trávnik: Zvyčajne je cieľom analýza živín a pH vrchnej vrstvy pôdy. Poľnohospodári a záhradkári často odoberajú mnoho malých vzoriek na celom poli (napr. 15 - 20 vzoriek na 4 - 5 hektárov) a zmiešajú ich do jednej zloženej vzorky. Táto zložená vzorka sa testuje na pH a kľúčové živiny, aby bolo možné usmerniť hnojenie. Na tento účel často stačí jednoduchá ručná sonda alebo vrták. Keďže vzorky budú zmiešané, zachovanie vrstiev pôdy nie je dôležité.

2. Životné prostredie a geotechnika: Tu môže byť potrebné vykonať test na kontamináciu, zhutnenie alebo štrukturálnu stabilitu. Pri environmentálnych prieskumoch technici často odoberajú narušené vzorky vrtuľou na mnohých miestach, aby skontrolovali úroveň znečisťujúcich látok, pretože je to rýchle a nákladovo efektívne.

Ak však potrebujete zistiť, ako sa kontaminanty pohybujú v pôde, alebo potrebujete údaje o pevnosti a zhutnení pôdy, budete potrebovať neporušené jadrá. Geotechnickí inžinieri (pre budovy alebo cesty) zvyčajne trvajú na Shelbyho trubkách alebo piestových vzorkovačoch, aby získali neporušené vzorky na testy pevnosti a konsolidácie.

Definujte svoju aplikáciu a typ pôdy

3. Výskum a archeológia: Niektoré výskumné projekty si vyžadujú takmer dokonalé jadrá. Archeológovia napríklad používajú malé tlačné sondy alebo nástroje na mikrokorigovanie, aby získali neporušené vrstvy pôdy bez ich premiešania. (Tieto nástroje môžu byť veľmi špecializované, často vyrobené na mieru pre tenké jadrá a jadrá s vložkami.)

Myslite aj na pôdne podmienky na vašom mieste:

  • Mäkká/piesočnatá/hlinitá pôda: Väčšina vzorkovačov bude fungovať dobre. Ručný šnek alebo tlačná sonda môžu ľahko preniknúť.
  • Tvrdá/hlinitá pôda: Možno budete potrebovať väčšiu silu. Zaťažené klzné kladivo alebo hydraulická sonda pomáhajú pri zatláčaní nástroja do hustej hliny. Niektoré sondy majú vymeniteľné ťažké hroty pre dodatočný úder.
  • Kamenistá/štrkovitá pôda: Oceľové vzorkovače sa môžu zaseknúť. V týchto pôdach je zvyčajne potrebné použiť klzné kladivo alebo vŕtačku s pohonom (s vrtákmi na horniny). Hľadajte vzorkovače s vymeniteľnými hrotmi, ktoré dokážu preraziť štrk, a dutými stonkami na odstraňovanie nečistôt.

Pri výbere vždy prispôsobte nástroj typu pôdy. Niektoré tlačné sondy majú napríklad úzke čepele na mokré pôdy alebo rúrky z nehrdzavejúcej ocele na abrazívne pôdy. Porovnávajte modely na základe ceny, odolnosti, jednoduchosti používania, typu hrotu (vrták vs. špicatý hrot) a priemeru, aby vyhovovali vašim podmienkam.

Určenie hĺbky odberu vzoriek pôdy

Hĺbka pôdy je jedným z najväčších faktorov pri poľnohospodárskom a environmentálnom testovaní. Štúdie ukazujú, že koncentrácie živín sa môžu líšiť o viac ako 40% medzi hornými 6 cm a podorničnou vrstvou. V stavebníctve je viac ako 60% zlyhaní základov spojených so zlým pochopením správania sa pôdy v hĺbke.

Preto je výber hĺbky pri výbere vzorkovnice kľúčovým rozhodnutím. Ako hlboko musí vzorka siahať? To závisí od vašich cieľov:

Určenie hĺbky odberu vzoriek pôdy

1. Plytké (0-12 palcov, ~0-30 cm): Typické pre trávniky, záhrady, pastviny alebo vrchnú vrstvu pôdy na poľnohospodárskom poli. Pri testoch pôdy (pH, fosfor, draslík) sa často používajú 6-8-centimetrové jadrá. Napríklad pri mnohých testoch plodín sa odoberá vzorka 0-6 palcov, pretože v tomto mieste sa sústreďuje najviac koreňov a živín. Na poliach bez obrábania alebo na pastvinách môžu laboratóriá použiť hĺbku 6-8 palcov, aby sa zohľadnili zvyšky.

2. Stredná (1-6 stôp, ~0,3-1,8 m): Používa sa, keď chcete získať informácie o podloží. V poľnohospodárstve sa na testovanie dusičnanov môžu odobrať hlbšie vzorky (napr. 6-24 cm). Pri plytkých prieskumoch podzemných vôd alebo kontaminácie môžu sondy odoberať vzorky v hĺbke niekoľkých metrov. Ručné sondy môžu pracovať v tomto rozsahu, ale je to ťažšie. Vo všeobecnosti ručné sondy bez problémov pracujú do hĺbky približne 5 až 10 stôp (1,5 až 3 m).

3. Hlboké (6+ stôp, >1,8 m): Potrebné pre geotechnické práce alebo práce s veľmi hlbokým znečistením (napr. testovanie ílových vrstiev alebo rozhrania horniny). Tieto hĺbky si vyžadujú ťažké zariadenia, ako sú vrtáky s dutým kmeňom alebo hydraulické súpravy. Ručné vrtáky sa stávajú nepraktickými v hĺbkach nad ~5-10 stôp.

Dokonca aj šneky s pohonom majú zvyčajne limity (často 10-15 stôp súvislého jadra). Na veľmi hlboké jadrá (až do 80 a viac stôp) sa používajú geotechnické vrtné súpravy a špeciálne vzorkovače (napr. skalné jadrovníky, duté stonkové vrtáky na plášte).

Vždy si vyberte vzorkovač dimenzovaný aspoň na potrebnú hĺbku. Nezabudnite, že odber viacerých plytších vzoriek alebo jednej hlbokej vzorky môže priniesť rôzne informácie. Uistite sa tiež, že máte na nástroji hĺbkové zarážky alebo značky, aby každé jadro malo presne rovnakú dĺžku - konzistentnosť je rozhodujúca pre spoľahlivé údaje.

Vyberte si typ vzorky pôdy: Zvoľte si typ pôdy: narušená vs. nenarušená.

Spôsob, akým manipulujete s pôdnymi jadrami, môže ovplyvniť presnosť vašich výsledkov. Nedávne správy ukazujú, že až 25% chýb pri laboratórnych testoch možno pripísať nesprávnym metódam odberu vzoriek. Narušené a nenarušené vzorky slúžia na rôzne účely a výber nesprávneho typu môže viesť k nákladným chybám. Ide o zásadné rozhodnutie:

Narušená vzorka: Pôda sa premieša vo vzorkovači. Rozbijete ju a homogenizujete (akoby ste zmiešali všetky odobraté jadrá dohromady). To je v poriadku pre chemické testy (živiny, pH, úroveň znečistenia), pretože na pôvodnej štruktúre pôdy nezáleží. Narušený odber vzoriek (vrtáky, vývrtky s veľkým priemerom alebo dokonca lopaty) je rýchly a lacný.

Je to štandardný spôsob odberu vzoriek úrodnosti na farme: odoberiete veľa jadier v cik-cak alebo mriežke, premiešate ich a pošlete do laboratória. Výhodou je rýchlosť a nízke náklady - môžete rýchlo odoberať vzorky z veľkých plôch. Nevýhodou je, že z narušeného jadra sa nedá zistiť nič o vrstvení, zhutnení alebo štruktúre pôdy.

Výber typu vzorky pôdy Narušená vs. nenarušená

Narušená vzorka: Pôda sa vyťaží neporušená, čím sa zachovajú jej vrstvy a vlhkosť. Používajú sa nástroje ako Shelbyho trubice, vzorkovače s delenými lyžicami alebo piestové vývrtky. Tie odoberajú pevné jadro pôdy. To je nevyhnutné, keď potrebujete fyzikálne alebo technické vlastnosti (napr. hustotu, pevnosť v šmyku, hydraulickú vodivosť).

Vďaka zachovaniu prirodzenej štruktúry vzorky môžu laboratórne testy simulovať skutočné podmienky v teréne. Kompromisom sú náklady a úsilie: odber vzoriek bez narušenia si zvyčajne vyžaduje špecializované vybavenie (často hydraulické súpravy) a kvalifikovanú obsluhu.

Dobré pravidlo: používať narušený (zložený) odber vzoriek na bežné agronomické a rozsiahle chemické kontroly. Pri geotechnickom alebo hĺbkovom environmentálnom prieskume prejdite na odber vzoriek bez narušenia (jadro).

Vyberte spôsob napájania: Ručný vs. mechanický vzorkovač pôdy

Efektivita práce sa stala určujúcim faktorom pri modernom odbere vzoriek pôdy. So zväčšujúcimi sa poľnohospodárskymi podnikmi vzrástol dopyt po rýchlych a konzistentných vzorkách. Len v Severnej Amerike sa v súčasnosti viac ako 60% profesionálneho testovania pôdy v poľnohospodárstve opiera o mechanizované alebo hydraulické zariadenia na odber vzoriek.

Manuálne nástroje však zostávajú voľbou pre väčšinu malých používateľov vďaka ich cenovej dostupnosti a prenosnosti. Rozhodnite sa, či si vyberiete ručné alebo strojové náradie:

1. Manuálne vzorkovače: Ide o ručne ovládané sondy, šneky alebo lopaty. Príkladom sú tlačné sondy (s nožnými stupačkami alebo T-rukoväťami), ručné vrtáky, lopatky na obkladačky a vrtáky do jamiek.

  • Klady: Prenosné, jednoduché a cenovo dostupné. Bez motora ich môžete vziať kamkoľvek a zriedka sa rozbijú.
  • Nevýhody: Pracovne náročné a pomalšie. Ručný odber mnohých vzoriek je náročný, najmä v tvrdej pôde.

Manuálne vzorkovače sú vo všeobecnosti obmedzené v hĺbke; väčšina z nich pracuje pohodlne len v hĺbke niekoľkých metrov. Aj ľudská chyba môže viesť k nejednotnej hĺbke (každý človek tlačí inak). Na malú záhradu alebo niekoľko rýchlych jadier je manuálne vzorkovanie vhodné.

Výber metódy napájania Manuálny vs. mechanický vzorkovač pôdy

2. Hydraulické/mechanické vzorkovače: Pripájajú sa k traktorom, štvorkolkám alebo samostatným zariadeniam. Zahŕňajú hydraulické ručné kladivá, motorizované pôdne sondy a kompletné súpravy s priamym tlakom.

  • Klady: Výkon a rýchlosť.

Sonda alebo robot namontovaný na traktore dokáže ľahko naraziť do tvrdej hliny alebo dosiahnuť viac ako 10 stôp. Hĺbka je konzistentná a je oveľa menej únavná. Je možné dosiahnuť vysokú priepustnosť vzoriek (ideálne pre presné agrotechniky s desiatkami vzoriek).

  • Nevýhody: Náklady a zložitosť.

Potrebujete motory alebo hydrauliku, palivo/batériu a niekedy aj vlastné držiaky. Počiatočná investícia je vyššia (často tisíce dolárov) a údržba je náročnejšia. Príklady: hydraulický systém AMS “Coresense” alebo súpravy Geoprobe s priamym tlakom.

Spodný riadok: Ak odoberáte vzorky na niekoľkých plytkých miestach, postačí vám ručná tlačná sonda alebo šnek. Ak potrebujete odobrať veľa jadier, ísť do hĺbky alebo cez tvrdé vrstvy, oplatí sa použiť poháňaný vrták alebo hydraulickú sondu.

Vyhodnotenie funkcií a ergonómie vzorkovača pôdy

Komfort a účinnosť sú pri odbere vzoriek pôdy čoraz dôležitejšie. Nedávny prieskum medzi agronómami ukázal, že viac ako 45% považuje ergonómiu a jednoduchosť čistenia za hlavné faktory pri výbere náradia. Keďže opakovaný odber vzoriek sa v presnom poľnohospodárstve stáva normou, aj malé konštrukčné rozdiely môžu výrazne ovplyvniť produktivitu a únavu používateľa. Po zúžení výberu sa zamerajte na detaily. Aj malé rozdiely v dizajne môžu ovplyvniť jednoduchosť používania a kvalitu vzoriek:

Priemer jadra: Menšie skúmavky (1-1¼ palca) vyžadujú menej úsilia, ale poskytujú malú vzorku; väčšie skúmavky (2-3 palce) vyžadujú väčšie jadrá. Väčšie jadrá môžu byť “reprezentatívnejšie” a znižujú chybu vzorky, ale vyžadujú viac sily a vytvárajú ťažšie vzorky. Na zložené testy živín často postačujú jadrá s priemerom ½ ¾ palca. Na presnú prácu alebo testy štruktúry môžu byť lepšie jadrá s priemerom viac ako 2 palce.

Materiál: Oceľové sondy sú bežné. Nerezová oceľ je odolná voči korózii (vhodná do vlhkej pôdy), ale je ťažšia. Uhlíková oceľ je ľahšia, ale môže korodovať. V niektorých vzorkovačoch sa kvôli pevnosti používa chrómová oceľ. Skontrolujte, či má vzorkovač ochranný povlak alebo pokovovanie.

Rukoväť a dizajn: Na ergonómii záleží. Existujú rukoväte v tvare T, nášľapy a rukoväte s posuvným kladivom. Sonda s T-rukoväťou poskytuje dobrý pákový efekt, zatiaľ čo niektoré sondy majú podložky pre nohy. Vzorkovače s posuvným kladivom potrebujú pevný rám, ktorý sa neohýba. Pri opakovanom odbere vzoriek hľadajte polstrované rukoväte alebo pružinové napínacie mechanizmy.

Prenosnosť: Aký je ťažký a objemný? Na prenosné použitie si vyberte ľahšie sondy (s hliníkovými časťami alebo dutými hriadeľmi). V prípade zariadenia do terénu sa uistite, že je bezpečne namontované. Zvážte aj dĺžku rukoväte (vyššie rukoväte znižujú namáhanie chrbta) a skladovanie (nezlomia sa nadstavce?).

Jednoduchosť čistenia: Vzorkovače pôdy sa môžu upchať. Nástroje, ako sú šneky s odnímateľnými letkami, delené trubice, ktoré sa otvárajú, alebo posuvné kladivá (ktoré vysúvajú jadro), sa čistia ľahšie. Niektoré súpravy tlačných sond obsahujú skladacie vložky alebo zachytávače jadier, ktoré zjednodušujú vyberanie vzorky.

Trvanlivosť: Ak sa budete pohybovať v kamenistej alebo abrazívnej pôde, hľadajte odolnú konštrukciu. Skontrolujte recenzie alebo špecifikácie, či sú bity odolné voči opotrebovaniu a či majú pevné puzdro.

Typy vzorkovačov pôdy - podrobné rozdelenie

Techniky odberu vzoriek pôdy sa rýchlo vyvíjajú - nedávne prieskumy ukazujú, že viac ako 65 % veľkých poľnohospodárskych prevádzok a 80 % geotechnických firiem teraz používa jadrové alebo mechanické nástroje na odber vzoriek namiesto jednoduchých ručných vrtákov. Dopyt po presných, neporušených jadrách sa na trhoch environmentálneho poradenstva zvýšil o 12 % ročne. Vzhľadom na to je pochopenie silných stránok a obmedzení jednotlivých typov vzorkovačov dôležitejšie ako kedykoľvek predtým.

1. Vrtáky (pre narušené vzorky pôdy)

Šneky sú klasické narušené vzorkovače. Vyzerajú ako obrovské vrtáky alebo naberačky. Pri otáčaní sa ich rezné hrany zarývajú do pôdy a valec (vedro) zbiera vzorku. Existuje niekoľko typov:

i. Vretenové šneky: (nazývané aj špirálové alebo Wrightove šneky) majú veľký špirálovitý let s reznou hranou. Môžu sa zavŕtať niekoľko metrov hlboko. Zachytávajú a zadržiavajú pôdu vo valci, čím minimalizujú straty pri vyťahovaní. Sú to pracovné kone pre farmy, terénne úpravy a geotechniku.

Vretenový vrták je “vynikajúci na dosiahnutie hĺbky niekoľkých metrov a účinný v sypkých, piesčitých alebo súdržných pôdach”. Používajú sa vždy, keď potrebujete kvalitnú objemovú vzorku pôdy (napr. na miešanie živín) - vrátane poľnohospodárskych polí, prieskumu kontaminácie alebo geologického prieskumu. Vzorka z vedrového vrtáka je zvyčajne dosť narušená (premiešaná).

Typy vzorkovačov pôdy (pre narušené vzorky)

ii. Holandské/ručné vrtáky: Tie majú jednoduchšiu konštrukciu (zvyčajne jedna špirála alebo rovné lopatky). Dobre sa používajú na 1-3 ft jadrá v mäkších pôdach. Sú ľahšie a ľahšie sa obsluhujú jednou osobou. Skvelé na testovanie v záhrade alebo na trávniku. Majú však tendenciu pri vŕtaní vypľúvať pôdu (odpad), preto s nimi treba opatrne zaobchádzať.

iii. Pieskové vruty: Tie majú otvorené letky a väčšie medzery na zber veľmi sypkej, vlhkej alebo piesočnatej pôdy. Piesok z nich padá do letu. Používajú sa najmä pri geotechnických a environmentálnych vrtných prácach pre plytké vrstvy piesku.

Vo všeobecnosti sú šneky rýchle a univerzálne. Ak potrebujete rýchlo získať vzorku pôdy na základnú analýzu, zvyčajne je vhodnou voľbou vrták. Len nezabudnite, že vzorka je narušená. Mnohí profesionáli tvrdia, že vrtáky poskytujú “vysokú úroveň presnosti” a “konzistentný odber vzoriek” pre úrodnosť, kontamináciu alebo geotechnické práce, pretože umožňujú odobrať dobrý objem pôdy aj v hĺbke.

2. Jadrové odbery vzoriek pôdy a tlačné sondy (pre neporušené vzorky)

Jadrové alebo rúrkové vzorkovače sú skonštruované na odber neporušených jadier. Predstavte si ostrú tenkostennú rúrku, ktorá sa zatĺka alebo tlačí do pôdy a vyťahuje valec neporušenej pôdy vo vnútri. Príkladom sú tlačné sondy, jadrové odbery s otvorenou trubicou (Shelbyho trubice) a vzorkovače s delenou trubicou. Tie zachovávajú vrstvy pôdy a jej vlhkosť.

i. Sondy s otvorenou trubicou (niekedy s odnímateľnými vložkami) sú bežné v trávnikoch a v poľnohospodárstve. Rúrku jednoducho stlačíte alebo vyrazíte do požadovanej hĺbky, potom ju vytiahnete a obsah vysypete. Vzorkovače s delenou trubicou majú dve polovice, ktoré sa upínajú okolo jadra a môžu sa zatĺkať kladivom.

Po vytiahnutí odskrutkujte konce, aby ste odstránili stĺpec pôdy. Výhoda je jasná: získate neporušený stĺpec. Používajú sa vo všetkých prípadoch, keď je “obsah vlhkosti a celistvosť štruktúry kritická” - napríklad pri analýze kontaminácie (na zachovanie prchavých chemických látok) alebo pri skúškach stability pôdy.

Pri správe trávnika alebo starostlivosti o trávnik často stačí otvorená sonda s malým priemerom (napr. 3/4" alebo 1"). V geotechnike sú pre ílovité pôdy štandardom Shelbyho trubice (~2-3″). Na obrázku vyššie sú znázornené rôzne konštrukcie vzorkovačov pôdnych jadier.

Jadrové vzorkovače sú zvyčajne ťažšie a vyžadujú si opatrnejšiu manipuláciu (po odobratí často utesníte oba konce). Ak však potrebujete testovať zhutnenie, pevnosť v strihu alebo hydraulickú vodivosť, neporušený jadrový vzorkovač je správnou voľbou.

Typy vzorkovačov jadrových vzorkovačov Push Probes (pre neporušené vzorky)

3. Kladivové vzorkovače (pre zhutnené pôdy)

V nedávnych terénnych štúdiách znížili vzorkovače s posuvným kladivom únavu obsluhy až o 40 % a zvýšili úspešnosť penetrácie v zhutnených ílovitých pôdach o 15-25 % v porovnaní s ručnými tlakovými sondami. Ak je pôda veľmi tvrdá alebo zhutnená, môže byť náročné dokonca aj zavedenie oceľovej trubice.

V tomto prípade sa používajú vzorkovnice s posuvným kladivom. Posuvné kladivo je v podstate ťažké závažie (“kladivo”), ktoré sa posúva hore a dole po vzorkovacej tyči. Pripevníte ho k šneku alebo jadrovému vrtáku.

Ako to funguje: umiestnite vzorkovač na hladinu, potom nechajte záťaž klesnúť a udicu zaklapnite. Moment hybnosti zaborí špičku do zeme. Tento postup opakujete až do dosiahnutia hĺbky. Tým istým kladivom môžete tiež zatlačiť na tyč, aby ste pomohli vytiahnuť nástroj. V podstate je to ako keby ste k sonde pridali funkciu kladiva.

Táto metóda je veľmi užitočná pri odbere vzoriek zo strednej hĺbky (niekoľko stôp) v hustej hline alebo výplni. Napríklad pri odbere vzoriek zhutnenej zeminy môžete k posuvnému kladivu pripojiť 1″ sondu a získať jadrá s priemerom 3 až 5 stôp.

Podľa spoločnosti AMS sú klzné kladivá “univerzálnym nástrojom na zatláčanie pôdnych sond” a poskytujú priamu hnaciu silu vďaka klesajúcej hmotnosti. Umožňujú dosiahnuť väčšiu hĺbku v náročných pôdach. V praxi, ak ručná sonda jednoducho neprenikne, vyskúšajte sondu s posuvným kladivom: vďaka dodatočnému úderu je to oveľa jednoduchšie.

4. Špecializované vzorkovače pôdy

Používanie špecializovaných vzorkovačov vzrástlo za posledných päť rokov o 20 % pri environmentálnych a geotechnických prácach, najmä pri sanácii kontaminovaných lokalít a projektoch hlbokých jadrových vrtov. Okrem uvedených bežných typov existujú aj špecializované vzorkovače pre konkrétne potreby:

i. Shelbyho trubice (tenkostenné vzorkovače): Ide o tenké oceľové rúry (priemer 2-6 palcov), ktoré sa používajú najmä pri geotechnických prácach. Shelbyho rúrka má naostrenú skosenú hranu a zatláča sa do neporušeného ílu/nánosu, aby sa vyrezalo neporušené jadro. Zvyčajne sa do vyvŕtanej diery vháňajú hydraulicky, aby sa predišlo narušeniu. Shelbyho trubice nie sú ručné nástroje; potrebujú vrtnú súpravu alebo špecializované vybavenie.

Použite ich, keď potrebujete vysokokvalitnú neporušenú vzorku na skúšky stlačiteľnosti alebo šmyku. (Často sa nazývajú aj tlakové alebo Ackerove rúrky.) Shelbyho rúrky sú ideálne pre jemnozrnné pôdy - len vedzte, že ich vedenie môže byť náročné v čomkoľvek tuhšom ako mäkký íl.

Špecializované vzorkovače pôdy

ii. Vzorkovače s delenou lyžičkou: Delená lyžica je klasická vzorkovnica pre štandardné penetračné skúšky (SPT). Je to hrubá oceľová rúrka, rozdelená na polovice, poháňaná kladivom. Pôda vstupujúca do delenej lyžice je technicky narušená, ale stále môže byť relatívne súdržná.

Môžete to vidieť v geotechnike na rýchly odber vzoriek z rôznych vrstiev. Nie je to pre dokonale neporušené jadrá (pretože kladivo narúša vzorku), ale často poskytuje dostatočne dobré jadro pre klasifikáciu a niektoré odhady pevnosti.

iii. Stacionárne piestové vzorkovače: Tie majú piest, ktorý sa počas zavádzania nachádza na dne vzorkovača a zabraňuje tak nasávaniu. Keď sa hadička hydraulicky zatlačí nadol (namiesto zatĺkania), piest udrží vzorku na mieste až do jej vybratia. Výsledkom je veľmi neporušené jadro. Piestové vzorkovače sa používajú vo veľmi citlivých pôdach, kde by aj Shelbyho trubica mohla spôsobiť rozmazanie.

iv. Súpravy Pit-Hammer: Niektoré súpravy (napr. súprava AMS na meranie objemovej hmotnosti) obsahujú jamkové kladivo s kruhovou reznou hlavou. Úderom kladiva a následným vytiahnutím sa získa objemové jadro (vyrazí sa zátka). To je užitočné, ak potrebujete presný objem (na skúšky objemovej hustoty alebo pórovitosti).

v. Bahenné šneky: Tieto šneky majú drážky alebo široké dráhy, aby si poradili s mokrou a lepkavou zeminou. Ak robíte vývrt v nasýtených hlinách alebo v močaristej pôde, bahenný vrták (s výrezmi v stene rúrky) pomáha odstrániť ťažký íl. Často majú zátkové ventily alebo dodatočné otvory, aby ste mohli hlinu ľahko vyprázdniť. Zjednodušene povedané: na nasýtených alebo na íl bohatých lokalitách používajte bahenný šnek, aby ste sa vyhli upchatiu.

Každý z týchto špecializovaných vzorkovačov je vybraný pre konkrétne terénne podmienky. Na väčšinu úloh odberu vzoriek pôdy si vyberiete z uvedených všeobecnejších kategórií, ale ak narazíte na lepkavé alebo bahnité pôdy alebo potrebujete presný objem jadier, majte na pamäti tieto.

Popredné spoločnosti a možnosti odberu vzoriek pôdy

Trh so zariadeniami na odber pôdnych vzoriek v posledných rokoch neustále rastie vďaka dopytu po presnom poľnohospodárstve, monitorovaní životného prostredia a infraštruktúrnych projektoch. Podľa správy o trhu na rok 2024 sa predpokladá, že globálny sektor zariadení na testovanie pôdy dosiahne do roku 2035 hodnotu $6,9 miliardy EUR, pričom od roku 2025 bude rásť tempom takmer 5% CAGR.

Tento rast je do veľkej miery podporovaný rastúcim zavádzaním inteligentného poľnohospodárstva, vládnymi nariadeniami o využívaní pôdy a potrebou presných údajov o pôde pred výstavbou. Keďže tento dopyt rastie, na trhu dominuje niekoľko spoločností so špecializovanými nástrojmi, ktoré sú určené pre poľnohospodárov, agronómov a inžinierov na celom svete. Ak ste pripravení na nákup, tu je niekoľko špičkových značiek a to, čím sú známe:

1. AMS (Art's Manufacturing & Supply)

Štvrtá generácia rodinnej firmy (založená v roku 1942), ktorá sa špecializuje na nástroje na odber vzoriek pôdy (ams-samplers.com). Ponúkajú všetko od základných tlačných sond a vrtákov až po hydraulické systémy. Spoločnosť AMS sa často uvádza ako líder v oblasti inovácií.

Možnosti: Vyrábajú jednoduché ručné sondy, šneky, posuvné kladivá a pokročilé systémy, ako je AMS PowerProbe.

Presné funkcie: Hydraulické vzorkovače AMS, ako napríklad Coresense, sú určené na odber veľkého množstva vzoriek a možno ich namontovať na traktory alebo úžitkové vozidlá. Tieto stroje sú kompatibilné s GPS, takže sú veľmi užitočné na odber vzoriek v zónach presného poľnohospodárstva. Dôsledná kontrola hĺbky zabezpečuje spoľahlivé údaje na celých poliach.

Prečo je to dôležité: Ak spravujete stovky hektárov, systém AMS vám poskytne prenosnosť aj výkon. Ich vzorkovače znižujú počet ľudských chýb a zabezpečujú, aby vaše vzorky zodpovedali presným mapám.

2. Clements Associates Inc.

Clements sa výrazne zameriava na poľnohospodárstvo a odber vzoriek z oblasti životného prostredia a vytvára nástroje, ktoré sú odolné a presné. Sondy Clements sú často vzduchové alebo pneumatické, čo umožňuje hĺbku viac ako 30 stôp.

Možnosti: Ich najznámejšie výrobky sú sondy JMC Environmentalist Subsoil Probe a vzorkovače Enviro-Safe.

Presné funkcie: Tieto nástroje sa vo veľkej miere používajú pri sieťovom a zónovom vzorkovaní, ktoré je nevyhnutné pre presné poľnohospodárstvo. Mnohí agronómovia spájajú sondy Clements s ručnými jednotkami GPS, čím zabezpečujú odber vzoriek z presne rovnakých miest rok čo rok. Táto opakovateľnosť je rozhodujúca pre sledovanie úrodnosti pôdy v priebehu času.

Prečo je to dôležité: Clements je vynikajúcou voľbou pre profesionálnych agronómov alebo konzultantov, ktorí potrebujú spoľahlivé sondy na dlhodobé monitorovanie pôdy.

Popredné spoločnosti a možnosti odberu vzoriek pôdy

3. Wintex

Kanadská spoločnosť vyrábajúca robustné manuálne vzorkovače. Výstroj Wintex (a príbuzné značky ako Radius) sú známe svojou celooceľovou odolnosťou. Ak potrebujete jednoduché, robustné náradie pre akýkoľvek typ pôdy, Wintex je obľúbenou voľbou. Ich posuvné kladivá a sondy s T-rukoväťou sú konštruované na drsné používanie.

Možnosti: Vyrábajú tlačné sondy, ručné šneky a kladivom poháňané vzorkovače.

Presné funkcie: Hoci sú nástroje Wintex väčšinou manuálne, často sa spájajú so zariadeniami GPS alebo softvérom na riadenie farmy, aby sa zaznamenali presné miesta vzoriek. To ich robí užitočnými pre menšie farmy, ktoré používajú presné techniky bez veľkých investícií do strojov.

Prečo je to dôležité: Wintex poskytuje odolnosť a cenovú dostupnosť. Ich vzorkovače sú jednoduché, ale v kombinácii so sledovaním GPS sa dajú zaradiť do presných pracovných postupov.

4. Falcon

Falcon sa viac zameriava na geotechnický a environmentálny výskum než na poľnohospodárstvo. Predávajú aj jamové kladivá a blokové vzorkovače. Geotechnickí inžinieri si často objednávajú zariadenia Falcon, keď potrebujú pôdne jadrá regulačnej kvality.

Možnosti: Sú známe Shelbyho trubicami, piestovými vzorkovačmi a súpravami na dynamické vzorkovanie U100.

Presné funkcie: Nástroje spoločnosti Falcon nie sú vybavené zabudovaným systémom GPS, ale často sa integrujú do environmentálnych pracovných postupov, v ktorých sa mapovanie GPS a diaľkové snímanie používajú na určovanie polohy vrtov. Ich špecializácia spočíva v poskytovaní neporušených pôdnych jadier pre stavebné štúdie a štúdie kontaminácie.

Prečo je to dôležité: Falcon je voľbou pre inžinierov, ktorí potrebujú hlboké, neporušené vzorky na posúdenie staveniska alebo environmentálnych rizík.

5. Prístroje Oakfield

Spoločnosť so sídlom v Nebraske, ktorá vyrába kvalitné manuálne vzorkovače za priateľskú cenu. Oakfield sa zameriava na jednoduché, ľahko použiteľné sondy a príslušenstvo (ako sú vrecká na vzorky a vložky) - skvelá voľba pre záhradkárov alebo začínajúcich používateľov.

Možnosti: Vyrábajú tlačné sondy z nehrdzavejúcej ocele, pôdne trubice a príslušenstvo, ako sú vrecká na vzorky.

Presné funkcie: Nástroje Oakfield sú plne manuálne, ale možno ich ľahko používať s aplikáciami na zaznamenávanie GPS, aby sa zaznamenalo miesto odberu každej vzorky. Hoci nemajú zabudované presné funkcie, často sa používajú na malých farmách, v projektoch správy trávnika alebo v záhradách, kde sú náklady faktorom.

Prečo je to dôležité: Oakfield je ideálny pre hobbyistov, záhradkárov a menšie farmy. Ich sondy sú ľahké, odolné a ľahko sa čistia.

6. Geosondy

Spoločnosť Geoprobe Systems je lídrom v oblasti mechanických vrtných súprav s priamym tlakom (v skutočnosti vyrába kompletné vŕtacie vozíky). Ich stroje dokážu vŕtať a odoberať vzorky v jednom kroku. Geoprobe je lídrom v oblasti ťažkých vzorkovacích zariadení, často namontovaných na nákladných vozidlách alebo prívesoch.

Možnosti: Vyrábajú súpravy s priamym tlakom a hydraulické systémy na odber vzoriek, ktoré sú schopné odoberať vzorky z veľkých hĺbok a vo veľkých objemoch.

Presné funkcie: Geosondy možno kombinovať s navádzaním pomocou GPS a mapami diaľkového prieskumu, vďaka čomu sú veľmi efektívne na environmentálne štúdie a pokročilý prieskum lokality. Ich vybavenie zaručuje presnosť a rýchlosť pri veľkých projektoch, kde sú potrebné desiatky hĺbkových jadier.

Prečo je to dôležité: Geosonda je najvhodnejšia pre inžinierov, veľké farmy a vládne projekty, pri ktorých je rozhodujúca hĺbka aj objem vzoriek.

7. Spektrum technológií

Spektrum spája tradičný odber vzoriek pôdy s digitálnou technológiou a senzormi.

Možnosti: Poskytujú pôdne sondy, merače vlhkosti a súpravy na testovanie živín.

Presné funkcie: Spoločnosť Spectrum sa špecializuje na kombináciu vzorkovačov pôdy so senzormi v reálnom čase. Ich nástroje sa často spájajú s údajmi diaľkového prieskumu, čo umožňuje poľnohospodárom porovnať výsledky z laboratória so snímkami z dronu alebo satelitu. Tým sa vytvára lepší obraz o zdraví pôdy a výkonnosti plodín.

Prečo je to dôležité: Spektrum je ideálne pre poľnohospodárov a výskumníkov, ktorí chcú integrovať odber vzoriek pôdy priamo do systémov presného poľnohospodárstva založených na údajoch.

Každá z týchto značiek má svoju medzeru. Napríklad zariadenia AMS a Clements možno vidieť na veľkých farmách a vo výskumných projektoch. Výstroj Wintex a Oakfield je všade na menších farmách a ekologických lokalitách. Falcon je určený pre inžinierov. Pri výbere značky berte do úvahy nielen cenu, ale aj podporu, dostupnosť dielov a siete miestnych distribútorov.

Moderný kontext presného poľnohospodárstva, diaľkového snímania a vzorkovania pôdy

Očakáva sa, že celosvetový trh s presným poľnohospodárstvom vzrastie z $9,7 miliardy v roku 2024 na $16,4 miliardy do roku 2030, s CAGR približne 9,2%, čo je spôsobené potrebou presného riadenia poľnohospodárskych podnikov na základe údajov. Odber vzoriek pôdy je rozhodujúcim prvkom tohto rastu, keďže viac ako 80% veľkých poľnohospodárskych podnikov v Severnej Amerike a Európe v súčasnosti využíva metódy odberu vzoriek pôdy riadené pomocou GPS.

Štúdie ukazujú, že presné odbery pôdnych vzoriek môžu znížiť náklady na hnojivá až o 20% a zároveň zvýšiť výnosy o 5-15%, čo z nich robí jeden z nákladovo najefektívnejších postupov v modernom poľnohospodárstve. V posledných rokoch technológia zmenila odber pôdnych vzoriek. Poľnohospodári a vedci teraz kombinujú satelity, drony, GPS a robotiku s nástrojmi starej školy. Tu sú informácie o tom, čo sa zmenilo:

1. Od odberu vzoriek v pokrývke k odberu vzoriek v zóne

V minulosti sa vzorky z mnohých polí odoberali ako z jedného celku (tzv. plošný odber vzoriek). Dnes sa v rámci presného poľnohospodárstva polia rozdeľujú na zóny hospodárenia. Pomocou satelitných snímok, máp z dronov alebo monitorov úrody agronómovia identifikujú oblasti s podobnou produktivitou alebo typom pôdy. Potom sa z každej zóny odoberajú vzorky samostatne. Napríklad namiesto odberu jednej kompozitnej vzorky na 40 akrov môže poľnohospodár odoberať jednu kompozitnú vzorku na 10 akrov.

Moderný kontext presného poľnohospodárstva, diaľkového snímania a vzorkovania pôdy


Sieťové vs. zónové dizajny: Existujú dve hlavné konštrukcie. Vzor mriežky (napr. každých 2-5 akrov) sa ku každej bunke mriežky správa rovnako. Týmto spôsobom možno mapovať jemné odchýlky, ale ak sa to robí pri vysokej hustote, môže to byť nákladné. Zónový prístup rozdeľuje pole podľa farby pôdy, histórie výnosov alebo sklonu a vzorky sa odoberajú z každej zóny. Zónový odber vzoriek môže poskytnúť “takmer rovnakú presnosť ako odber vzoriek z mriežky” s menším počtom vzoriek.

Diaľkové snímanie: Nástroje ako NDVI (vitalita plodín), vodivosť pôdy EM a údaje o úrode vytvárajú mapy variability. Pôdne laboratóriá teraz často dostávajú georeferencované vzorky. Ako sa uvádza v jednej štúdii, mapa výnosov alebo mapa NDVI môže identifikovať “oblasti s vysokou/strednou/nízkou produktivitou”, ktoré sa stanú samostatnými zónami odberu vzoriek. Tento cielený prístup zvyšuje efektívnosť. Zistilo sa, že úroveň živín sa môže v rámci tej istej 10-akrovej zóny líšiť až o 40%! Odberom vzoriek podľa tejto variability sa poľnohospodár vyhne “skrytým” problémovým miestam.

V praxi je presný pracovný postup nasledovný: vzdialené senzory označia problematické oblasti (“kde”) a potom tím alebo robot fyzicky odoberie vzorky z týchto oblastí, aby zistil, “čo” sa v pôde skutočne nachádza. Táto metóda poskytuje oveľa viac použiteľných údajov ako jedna vzorka na pole.

2. Ako technológia mení požiadavky na vzorkovače

Vyššia intenzita a presnosť vzorkovania si vyžaduje lepšie nástroje:

Rýchlosť a objem: Ak na jedno pole odoberáte viac ako 20 jadier, manuálne metódy môžu byť nepraktické. Mnohí profesionáli v oblasti presného poľnohospodárstva používajú hydraulické alebo automatizované vzorkovače. Napríklad automatický vzorkovač AFS (Auto-Field Sampler) od spoločnosti AMS namontovaný na traktore alebo robot na odber vzoriek pôdy dokáže odobrať desiatky jadier za čas, za ktorý by človek zvládol niekoľko jadier. Moderné zariadenia sú často vybavené vákuovým vedením alebo pružinovým vysúvaním na rýchle vysypanie jadra.

Konzistentnosť hĺbky: Pri vzorkovaní mnohých bodov potrebujete rovnaké hĺbky. Pokročilé sondy používajú hĺbkové obojky alebo snímače. Robotické vzorkovače, ako je systém ROGO, dosahujú dokonca presnosť hĺbky ±1/8″. “Učia sa” z každého jadra a upravujú silu tak, aby každé jadro malo presne rovnakú dĺžku. Hľadajte nástroje s jasným označením hĺbky, zarážkami alebo ovládacími prvkami so spätnou väzbou.

Navádzanie pomocou GPS: Dnešné vzorkovače zvyčajne obsahujú GPS. Niektoré ručné sondy majú držiaky na prijímač GPS, zatiaľ čo automatizované systémy používajú navádzanie RTK-GPS. Napríklad spoločnosť ROGO uvádza, že s RTK GPS môžu “opakovať miesta vzoriek presne z roka na rok”. Pri jednoduchších rozpočtoch môže vašu trasu cez zónu viesť aj telefón alebo tablet s mapovými aplikáciami. Vždy si zaznamenajte súradnice každého jadra.

Zaznamenávanie údajov: Nové vzorkovače môžu dokonca zaznamenávať údaje digitálne. Po každom stlačení tlačidla sa môže vzorka označiť ID a polohou. Niektoré systémy sú priamo prepojené so softvérom na riadenie farmy. Kľúčom je, že každé pôdne jadro sa stáva základnou pravdou viazanou na konkrétnu zónu poľa.

Odolnosť pri používaní v teréne: Vzhľadom na to, že pri odbere vzoriek sa zvyšuje riziko, spoločnosti vyrábajú náročnejšie vzorkovače. Hľadajte robustné rámy, utesnené ložiská na posuvných kladivách a kovové spoje, ktoré sú odolné voči opotrebovaniu. Moderné presné poľnohospodárstvo si skrátka vyžaduje konzistentné, opakovateľné nástroje - nielen príležitostné sondy.

3. Pracovný postup založený na údajoch

Ak to všetko zhrnieme, môžeme povedať, ako fungujú mnohé presné farmy:

  • Identifikujte zóny: Na vytvorenie manažmentových zón použite satelitné/dronové snímky alebo mapy výnosov. Každá zóna by mala byť relatívne jednotná alebo by sa mala týkať známeho problému (napr. nízkeho bodu alebo odvodňovanej oblasti). Toto je vaša mapa “kde” odobrať vzorky.
  • Naplánujte miesta odberu vzoriek: Rozhodnite sa, koľko jadier na zónu (bežne 15-20) a v akej hĺbke (napr. 0-6″ a 6-24″). Na rovnomerné rozmiestnenie bodov použite GPS alebo označené vlajky. Mnohí pestovatelia chodia po každej zóne cik-cak alebo v tvare písmena “W”.
  • Zber vzoriek: Pomocou vybraného vzorkovača a metódy odoberte každé jadro. Udržiavajte konštantnú hĺbku a vyhýbajte sa akémukoľvek skresleniu (napr. neberte vzorky vždy v blízkosti ciest). Ak odoberáte kompozitné vzorky, vložte všetky jadrá zo zóny do jedného vedra a dôkladne ich premiešajte. (Štúdie ukazujú, že použitie 15 - 20 jadier na kompozit môže znížiť chybu odberu vzoriek o ~ 90% v porovnaní s použitím iba 5 jadier).
  • Všetko zdokumentujte: Každú vzorku označte poľom, zónou, hĺbkou a súradnicami GPS. Dokonca aj správy FAO uvádzajú, že až 30% laboratórnych chýb pochádza zo zlého označovania alebo manipulácie.
  • Laboratórna analýza: Laboratórium zasiela podrobné údaje (pH, živiny, kontaminanty). Keďže každá vzorka má informácie o polohe, máte teraz mapu vlastností pôdy.
  • Presná aplikácia: Nakoniec sa tieto informácie dostanú do zariadenia s premenlivou sadzbou. V každej zóne môžete aplikovať vápno alebo hnojivo inak, alebo kopať hlbšie len tam, kde je kontaminácia označená.

Záver

Výber správneho vzorkovača pôdy spočíva v niekoľkých základných otázkach: Prečo odoberám vzorky, s akým druhom pôdy mám do činenia, ako hlboko potrebujem ísť, aký typ údajov potrebujem a ako ich budem zbierať? Zodpovedaním týchto otázok môžete rýchlo prispôsobiť vzorkovač svojmu projektu. Pre hobbyistov a záhradkárov je jednoduchá tlačná sonda alebo ručný vrták, ako napríklad model Oakfield z nehrdzavejúcej ocele, cenovo dostupným a odolným spôsobom kontroly plytkých pôdnych podmienok. Ľahko sa používajú a sú ideálne na rýchle testy v záhradách a na trávnikoch.

Profesionálni agronómovia najviac využívajú mechanické sondy alebo hydraulické systémy. Nástroje, ako sú hydraulické sondy Clements JMC alebo AMS, šetria čas, zlepšujú konzistenciu a bez problémov spolupracujú s GPS na presné mapovanie úrodnosti na veľkých poliach. Na druhej strane geotechnickí inžinieri potrebujú neporušené vzorky. Shelbyho trubice a vzorkovače s delenou lyžicou od spoločností Falcon alebo AMS sú priemyselnými štandardmi, ktoré sa často spájajú s hydraulickými súpravami na hlboké a presné jadrá nevyhnutné pre stavebné a environmentálne štúdie.

Bez ohľadu na to, kto ste, správny vzorkovač vám umožní získať presné informácie o pôde. Vďaka tejto príručke máte teraz istotu, že si môžete vybrať správny nástroj a začať odhaľovať príbeh pod svojou pôdou.

Zber pôdnych vzoriek na mriežke a diaľkové zisťovanie: Dátami riadený posun v precíznom poľnohospodárstve

Traditional farming often treats an entire field uniformly – applying the same seed, fertilizer or lime rate everywhere. In reality, fields usually contain very different soil types and fertility levels in different spots. However, in recent years, more farmers are using grid soil sampling and precision soil testing as part of digital agriculture.

In one survey of U.S. cropland, soil core testing is now used on around 27% of corn acres and 14% of wheat acres, up from much lower numbers a few years ago. The adoption of these tests is rising as the cost of lab work falls and as farmers see clearer return from nutrient-targeted applications. Meanwhile, global spending on precision farming hardware (which supports grid soil sampling among other tools) is fueling market growth estimated at USD 10.5 billion in 2024, with projections to double over the next several years.

Studies show that applying fertilizer based on average field values “treat[s] all soil as equal” – a practice that tends to “make farmers lose yield and money.” For example, one review found that basing fertilization on field averages often wastes inputs in some areas and underfeeds others, cutting potential yield.

Yet soils are naturally variable: past erosion, topography and crop history create “extreme field-scale variability” in soil pH, nutrients, moisture, and organic matter even within a single field. High spots may have depleted topsoil, while low spots may hold more moisture and nutrients. Treating all these areas the same ignores these differences.

What is Grid Soil Sampling?

Grid soil sampling is a systematic way to sample soil across a whole field. Instead of taking one or two random samples, the field is overlaid with an imaginary grid of small, equal-sized cells (for example, 1–2.5 acre per cell). A GPS device guides the sampler to the center of each cell. At each grid point, the sampler takes multiple cores (typically 10–15 cores) from around that point and mixes them into one composite sample.

Each cell thus yields one soil sample that represents that tiny area of the field. The size of the grid (cell area) is chosen to balance detail versus cost – smaller cells (more points) give finer resolution but cost more to sample. Research suggests that 1-acre grids capture more than 80% of field variability, while 2.5-acre grids capture somewhat less. Some key points are:

  • Divides the field into equal cells (e.g. 1–2.5 acres each)
  • Uses GPS to sample points at fixed locations (black dots in figure).
  • Collects 10–15 soil cores per point and sends composite to lab

What is Grid Soil Sampling?

1. Planning the Grid: Before sampling, farmers choose a grid size based on field size, variability and budget. A common choice is around 2.5 acres per sample; very high-resolution work might use 1-acre cells. GPS coordinates for each grid point are generated in a map or sampling plan.

2. Collecting Samples: At each marked point, the sampler collects soil cores from within a few feet of that location. All cores for the point are combined into one sample bag. Using a clean stainless-steel probe or auger and a GPS ensures accuracy. Sampling depth and number of cores per point follow best practices (for example, 10–15 cores per point to average out microscale variability).

3. Lab Analysis: The composite samples are sent to a soil lab. The lab measures key soil properties: pH, available nutrients (phosphorus, potassium, nitrogen, etc.), organic matter, and sometimes micronutrients or micronutrient supply capacity. This nutrient data is then linked back to the GPS coordinates of each grid point.

4. The Output – Soil Nutrient Maps: Once all lab results are in, the data points are interpolated to create continuous soil maps for the field. Software can draw contours or shaded zone maps for each parameter – for example showing “high”, “medium”, and “low” regions of soil phosphorus or pH.

These soil variability maps let the farmer see exactly which parts of the field are rich or poor in each nutrient. For instance, one study notes that grid sampling maps “reveal differences in fertility that traditional field testing… can overlook,” allowing nutrients like P and K fertilizer, or lime, to be applied only where they will pay off.

Grid sampling produces a very fine-grained view of soil fertility. In the precision-ag map above, each dot corresponds to a sampled location. The resulting maps (not shown) can highlight patterns, such as a band of low pH or a pocket of low nitrogen. For example, one U.S. survey found that when farmers adopted soil-sampling-based nutrient management, 67% reported higher yields and saved about $24 per acre in corn costs.

These gains come from applying the right nutrients in the right places – a decision only possible with detailed grid maps of soil chemistry. Over time, repeating grid sampling every few years also helps track whether fertility is improving under new management.

Role of Remote Sensing in Grid Soil Sampling

Remote sensing means gathering information about the field from a distance, without physically touching the soil or crops. In agriculture, this typically involves satellites, manned aircraft or drones equipped with cameras or sensors. These sensors detect reflected sunlight (often in visible and infrared bands) or other signals from the surface. The most common output is an image layer that reflects plant health or soil moisture.

For example, satellites such as Sentinel-2 or Landsat regularly capture multi-spectral images of every field in the world. Aerial flights (fixed-wing planes) can take higher-resolution photos over large areas. Unmanned drones (UAVs) can even fly under clouds to get very high-resolution images on demand over a few fields.

The most famous remote-sensing output for crops is the Normalized Difference Vegetation Index (NDVI). NDVI compares how much light plants reflect in the red versus near-infrared wavelengths. Since healthy green plants absorb red light (for photosynthesis) and reflect near-infrared (NIR). Bare soil and water give NDVI near 0 or negative. In simple terms, higher NDVI means greener, healthier plants; lower NDVI means sparser or stressed vegetation.

Role of Remote Sensing in Grid Soil Sampling

How Remote Sensing Helps: Remote sensing does not replace soil sampling, but it provides a crucial complement. Imagery can reveal spatial patterns of crop health that often mirror soil variability. For instance, drought-stressed or nutrient-deficient areas may show up as low-NDVI patches.

As one precision-ag platform notes, satellites “show patterns of plant growth that typically mirror soil variability,” helping to plan sampling and management. Over time, satellite NDVI maps allow farmers to track trends: for example, if a certain corner of the field consistently has lower NDVI year after year, that signals a chronic issue (poor drainage, low pH, etc.).

Remote sensing is also temporal. Unlike a one-time soil sample, we can get an image of the field every week or even daily. This lets farmers see how plant health is changing through the season. If an area suddenly turns red (low NDVI) between two images, that indicates a new stress (pest outbreak, drought spot, etc.). This temporal view guides when and where to scout fields or to adjust management mid-season.

Finally, historical imagery can guide sampling strategy. If remote sensing shows that only part of a field ever exhibits problems, a farmer might choose a finer sampling grid in that zone and a coarser grid elsewhere. In other words, satellite/drone maps can help target soil sampling to where it matters most, making the process more efficient.

Integrating Grid Sampling and Remote Sensing

The integration of grid sampling and remote sensing is now being adopted more widely: in the U.S., more than half of farm acres now use tools like sprayer section controllers, planter row controllers, and precision soil samples. Also, yield monitoring is used on about 70% of corn acres, and market forecasts show the combined precision farming market (hardware + software + services) will grow from around USD 10.5 billion in 2024 to more than USD 21 billion by 2032.

These numbers show the fusion of ground-truth soil data with aerial and satellite sensing is becoming the foundation of many farms’ practices. The real power comes when we fuse grid samples with remote imagery in a continuous feedback loop. Each method covers the other’s weaknesses.

1. Ground Truthing (Calibrating Imagery): Grid soil samples provide the “ground truth” that helps interpret remote-sensed data. For example, if an NDVI map shows a low-vigor area, a soil sample from that spot may reveal it’s low in potassium. Over multiple fields, researchers have found strong correlations between soil measures and spectral indices (e.g. linking soil pH or nutrients to satellite data). By building a model that relates NDVI (or other spectral bands) to lab-measured values, we can use remote sensing to predict soil fertility in unsampled locations.

2. Extrapolation and Interpolation: Because satellites cover the entire field at once, they fill in the gaps between sample points. For instance, suppose we sampled every 2.5 acres but want a finer map. If NDVI correlates with nutrient levels, we can interpolate between grid points using NDVI gradients. This dramatically increases effective resolution. In one case study, researchers used satellite data correlated with soil pH to design optimal sampling and then create accurate high-resolution pH maps with far fewer samples.

Integrating Grid Sampling and Remote Sensing

3. Creating VRT Prescription Maps: The combination of detailed soil maps and imagery is the basis for Variable Rate Technology (VRT). For example, to apply fertilizer, software can overlay an NDVI map with a soil nutrient map and generate a prescription map that varies input rates across the field. One scenario is: the NDVI map shows a southern corner of the field lagging in growth, and grid samples there confirm it’s low in phosphorus.

The farmer can then create a high-phosphorus prescription exactly for that zone, while saving fertilizer in healthy zones. In practice, NDVI-driven fertilizer management has led to dramatic improvements. For instance, a Thai corn grower found mid-season NDVI imagery that isolated stress zones.

Soil testing confirmed these zones were nitrogen-deficient, so he applied fertilizer only there. The crops then recovered within weeks. This targeted approach boosted yield and uniformity, demonstrating how imagery and samples together drive effective VRT.

4. Management Zone Delineation: Rather than blindly using a fixed grid forever, farmers can evolve to management zones – larger areas within which conditions are roughly uniform. Zones are often defined by combining many layers: grid soil results, yield maps, elevation, and historical imagery.

For example, fields can be split into “zones” of similar soil type or NDVI pattern. Future soil sampling can then be done per zone instead of per grid point. This can reduce cost: one study notes that fields pre-planned into zones can achieve up to 25% higher fertilizer use efficiency. In essence, satellite images and yield data help refine those zones over time.

5. Environmental and Economic Benefits: By applying inputs variably, farmers use only what is needed where it’s needed, improving nutrient use efficiency. Grid-sample-based maps have been shown to reduce nutrient runoff risk, because high-fertilizer areas are constrained. More uniform crop growth also stabilizes yields.

In the long term, these tools help maintain soil fertility and cut costs. For instance, precision lime application guided by this data avoids overliming some spots and ignoring others, saving money on lime while preventing soil acidification.

6. Feedback Over Time: Another key advantage is that this is an ongoing process, not one-off. Each season, farmers collect yield data, drone images, and new soil tests. A platform can layer these data to learn why certain areas behave differently. In other words, grid sampling tells you what’s in the soil now; remote sensing shows how the crops responded.

Combining them year after year creates a learning cycle. An EOSDA study explains that after the first soil test cycle you know “where you stand,” and as you repeat sampling and overlay satellite/yield data, you see how the field is changing under your inputs, refining management continuously.

Key Applications of Grid Soil Sampling in Precision Agriculture

With the global precision agriculture market projected to reach $16.35 billion by 2030 (growing at a CAGR of nearly 13%), digital farming tools are becoming central to modern agriculture. Farmers today face rising input costs, climate uncertainty, and sustainability pressures, making data-driven input application more crucial than ever.

Key Applications of Grid Soil Sampling in Precision Agriculture

By integrating grid soil analysis maps, satellite imagery, and machine data, farmers can increase yields while cutting waste. With this integrated data, farmers create precise input prescriptions. For example:

Variable Rate Technology (VRT) Maps: Using soil nutrient maps and NDVI patterns, software draws maps for GPS-controlled spreaders. Lime trucks use a lime-map to neutralize acidity only where pH is low. Fertilizer spreaders use a P or K map from the lab results. Modern systems can even download NDVI maps directly to the spreader, so high-NDVI (vigorous) zones might get more fertilizer while low-NDVI zones get less.

In soybeans, a Brazilian farmer did exactly this: his machine applied almost no fertilizer in poor-response zones and richer doses in high-response areas, increasing yield in the good parts and eliminating waste in the poor parts.

Manažérske zóny: Globally, around 70% of farmers adopting precision agriculture are now using management zones to optimize inputs. This approach allows them to focus resources where they matter most, rather than treating fields uniformly. Research shows that farmers can cut fertilizer use by up to 20% while maintaining or even improving yields.

As described, combining all data can identify 3–10 zones per field with similar needs. Future grids or targeted sampling occur within each zone rather than the whole field. This saves time and money while still capturing the main variability. Zones also simplify management – instead of dozens of grid rectangles, a farmer might manage 4 zones with one fertility rate each.

Udržateľnosť: Agriculture accounts for over 30% of global greenhouse gas emissions, with fertilizer overuse being a major contributor. Precision nutrient management is increasingly recognized as a solution, helping farmers reduce emissions while protecting water quality. In fact, targeted fertilizer applications can reduce nitrogen runoff by 15–25%, while improving nutrient-use efficiency.

Targeted application means less excess fertilizer in the environment. Farmers apply nutrients only to areas with low soil levels or crop response, reducing leaching and runoff. This not only cuts costs but also protects waterways. Moreover, monitoring trends (through repeated sampling and imagery) helps avoid buildup of salts or nutrients in “hot spots”. The bottom line is higher nutrient use efficiency and often higher profits.

Using GeoPard to Enhance Efficiency And Practicality of Grid Soil Sampling

GeoPard enhances the efficiency and practicality of grid-based sampling by introducing advanced digital tools that automate and optimize the entire process. Through its Smart Sampling Platform, GeoPard allows users to generate sampling grids with customizable cell sizes tailored to the size of the field, crop type, or grower preference. The system then assigns precise GPS coordinates to each sampling point, eliminating guesswork and ensuring repeatability over multiple seasons.

  • Smart Grid Creation: Automatically generates customizable grids with precise GPS coordinates for each point.
  • Optimal Path Planning: Calculates the most efficient walking/driving route across all points, saving time and fuel.
  • Real-Time Navigation: Mobile integration guides operators directly to each sampling point in the field.
  • Smart Labeling & Data Management: Each sample is uniquely tagged to its GPS location, reducing errors and simplifying lab workflows.
  • Easy Data Integration: Lab results can be imported directly into GeoPard to create nutrient maps for each grid cell.
  • Actionable Prescriptions: Enables creation of variable-rate fertilizer or lime applications tailored to grid data.

By combining the traditional strengths of grid soil sampling with modern digital technology, GeoPard transforms what was once a labor-intensive process into a highly efficient, data-driven workflow. This ensures that farmers not only gain an accurate baseline understanding of their soils but also build a strong foundation for ongoing precision agriculture practices.

Challenges and Considerations

While powerful, both grid sampling and remote sensing have limits, and neither is a “silver bullet” on its own.

1. Grid Sampling Limitations: Collecting many soil samples is expensive and time-consuming. Driving over the field to take 10–15 cores at every grid point (often hundreds of points on a large farm) can take hours. Each sample costs for lab analysis. This is why grid spacing is often a compromise.

Also, grid sampling is only a snapshot in time – it tells you the soil situation at sampling, but not how it will change during the season. Finally, turning raw sample data into actionable recommendations requires specialized software or agronomic advice. (In some cases, simple averaging or zoning from the data may be needed to make it usable.)

2. Remote Sensing Limitations: Satellite or drone imagery can show where something is wrong, but not why. A low-NDVI patch might be due to drought, disease, pests, or soil nutrient deficiency – the imagery itself doesn’t diagnose the cause. Cloud cover can delay getting a clear image.

Higher-resolution imagery (e.g. <10 m pixels) may cost money or require special access. Thermal and radar sensors exist to address some gaps (e.g. moisture imaging or day/night views), but these add complexity. In summary, NDVI is a powerful indicator of plant health, but by itself it doesn’t tell the farmer which fertilizer or treatment is needed.

3. Integration is Essential: Because of these limits, the real strength is in using both tools together. Soil samples without imagery leave many unsampled areas in doubt, and imagery without samples leaves the farmer guessing the cause of stress. By cross-checking data (for example, verifying low-NDVI zones with soil lab results), farmers get confidence in what their maps mean.

In practice, experts stress that proper management combines both datasets. In other words, grid sampling gives you precise nutrient maps but on a fixed grid; remote sensing gives you broad vision but needs calibration. Together they overcome each other’s blind spots.

The technology is advancing rapidly. Drone usage in agriculture is exploding – some estimates predict that 80% of all commercial drones will be used on farms. Drones can carry ever-cheaper multispectral cameras, allowing farmers to capture ultra-high-resolution NDVI maps on-demand. Meanwhile, satellite constellations are growing; new mini-satellites can revisit fields daily at 5–10 m resolution.

Another big trend is AI and Machine Learning. Algorithms are being developed to automatically detect patterns in the combined data: for instance, clustering images and soil tests to suggest optimal zones, or using historical satellite time series and previous yields to predict problem areas. Smart platforms can now automatically generate VRT prescriptions from uploaded soil and image layers.

We also expect more sensor integration: for example, low-cost sensors in tractors could measure soil electrical conductivity or moisture on the go, adding another layer to the maps. These data too can be fused with satellite data. All of these point to a future where satellites, drones, sensors, and AI jointly deliver almost real-time soil and crop intelligence. As one market report notes, the availability of high-resolution imagery and UAV technology “indicate that the use of remote sensing data sources in precision agriculture is anticipated to surge in the next ten years”

Záver

In summary, grid soil sampling provides the essential ground-truth on soil nutrients and chemistry, while remote sensing provides the spatial and temporal context of how crops grow. Grid samples answer “what is in the soil here?”; remote images answer “how is the crop doing there (and when)?” Together they form the data backbone of precision farming. With this fused data, farmers can create Variable-Rate application maps and meaningful management zones. This enables applying exactly the right amount of fertilizer or lime in each part of the field – cutting waste, raising crop uniformity, and improving yields.

Odber kompozitných vzoriek pôdy a úloha presného poľnohospodárstva a diaľkového prieskumu

Composite soil sampling means taking many small soil cores from across a field and mixing them into one sample. This single composite sample provides average soil test values (nutrients, pH, etc.) for that entire area. Traditionally, farmers have used composite sampling to determine uniform fertilizer or lime rates for a whole field.

Recent advances in precision agriculture (PA) and remote sensing (RS) are changing how we do soil sampling. Today’s tools (GPS-guided equipment, satellite/drone imagery, yield maps, and soil sensors) allow farmers to “see” differences within a field and create more tailored sampling zones.

Instead of “one field – one sample,” PA encourages “many zones – many samples,” each averaged separately. In short, composite sampling remains a key part of soil testing, but PA/RS data help define where those composites should be taken and how their results are used. For example, 68% of large U.S. crop farms now use yield monitors or soil-mapping tools, reflecting how common precision data have become.

What Is Composite Soil Sampling?

Composite sampling combines sub-samples from many spots into one mixed sample. For instance, to sample a 10-acre zone, you might take 15–20 small cores (each a few inches deep) at various points, mix them, and send the mixture to the lab. The lab analyzes this one composite soil to give an average test value for the whole zone.

What Is Composite Soil Sampling?

This contrasts with discrete (individual) samples, where each core is tested separately. Composite sampling is often done when an area seems fairly uniform and a general fertility level is needed. In the U.S., over 70% of commercial farms report using some form of soil testing, and composite sampling remains the most common and cost-effective method.

A soil extension bulletin explains: “Soil sampling begins with a representative composite soil sample”. That composite result guides management (fertilizer, lime, etc.) for the entire area. If conditions really are uniform, one composite per 10–15 acres can suffice. However, that assumes all parts of the zone are similar. However, precision tools help identify where that assumption holds, and where it does not.

When composite samples are taken within well-defined management zones, they lead to better decisions. For example, instead of applying one fertilizer rate to an entire 100-acre field (based on one composite), a farmer might apply one rate to the field’s top third, a different rate to the middle third, and another rate to the bottom third – each guided by that zone’s soil test. This targeted approach can increase yields or save fertilizer (and reduce runoff).

Advantages of Composite Sampling

Globally, fertilizer prices have increased by nearly 80% since 2020, pushing farmers to adopt more cost-efficient soil testing methods. Composite sampling helps reduce testing expenses while still providing valuable insights. A recent U.S. survey shows that more than 60% of mid-sized farms rely on composite soil testing as their primary fertility assessment tool.

1. Cost-effective: Fewer lab tests are needed compared to testing every location. A single composite replaces many individual tests, saving money on analysis.

2. Time-efficient: It is faster to collect and process one mixed sample than dozens of separate samples. This means soil testing can be done more quickly and frequently.

3. Simplicity: Composite sampling requires less planning and data management. For example, large lawns, pastures, or fields with uniform cropping often use simple “one area – one sample” protocols.

4. Suitable for uniform areas: When a zone truly has uniform soil and management, the composite gives a reliable average fertility. Many extension guides note that a “reasonably uniform area” up to 10–15 acres can be well-characterized by one composite.

These benefits have made composite sampling a common practice. One crop consultant notes that GPS grid sampling (using many points) is more detailed and costly, while composite sampling “involves mixing soil from various locations… to create a single sample,” which is simpler. In uniform fields (or lawns, gardens, and research plots), composite tests are a practical way to track nutrients and pH with moderate cost.

Limitations of Composite Sampling

As of 2025, studies show that nearly 45% of sampled agricultural fields exhibit enough spatial variability that composite sampling obscures critical nutrient differences—making precision zone sampling essential. Recent data also reveals a 12% increase in undetected contamination events when using composite methods in variable soils. Despite its convenience, composite sampling has important drawbacks:

a. Masks variability: By averaging many points, composites hide “hot spots” and “cold spots.” For example, a patch with very high phosphorus or a corner with low pH will be diluted into the average. A precision-farming blog warns that composite mixing of different locations “can mask variations in soil nutrients”. In other words, you lose information about where the soil is better or worse than average.

Limitations of Composite Sampling

b. Not for small problems: Composite samples are a poor choice if you suspect a localized issue. For example, if a specific spot had a pesticide spill or extreme plant stunting, one composite over the whole field might not detect it. That problem area would be mixed with many normal spots. Extension educators explicitly caution that whole-field (blanket) samples are not recommended for fields with variability.

c. Dilution risk: If a small sub-area is contaminated or highly enriched, its signal can be diluted below detection. This is known as the “nondetectable average” problem: a few cores from a contaminated patch might vanish into the overall sample. That is why composite sampling is often avoided in environmental hazard investigations unless combined with retesting of individual cores.

d. Uniform treatment despite variation: A composite test leads to one recommendation for the entire zone. This can mean over-applying fertilizer on already-rich spots and under-applying where soil was poorer. Over time, this inefficiency can waste inputs and money. As one precision-ag blog notes, composite sampling “may lead to inefficiencies and higher costs over time” because it lacks the detailed information needed for precise management.

Composite sampling is best for areas known to be fairly uniform. However, in highly variable fields, its averaging nature can cause uneven crop response, lower efficiency, and environmental concerns (nutrient runoff).

Planning the Sampling: Zones and Tools

As of mid-2025, modern approaches to soil sampling recommend collecting 15–20 subsamples per sampling area, each composite ideally representing ≤ 2.5 acres in fields with high variability.

Some precision agriculture grids now recommend 1 sample per acre for long-term mapping accuracy, with mobile robotic systems capable of obtaining 50 g soil samples at 200 mm depth, analyzed in ~10 minutes each for real-time nutrient and pH data. Before going into the field, carefully plan where and how you will sample. Key steps include:

1. Define sampling zones: Break the field into sections where soil and history are similar. Use information on soil type, past crop rotations, topography, and management. For example, if part of a field was heavily limed or manured in the past, that area should be sampled separately.

Many guidelines advise sketching a map of uniform areas before sampling. Within each zone, one composite will be taken. If a field is truly uniform, up to 10–15 acres may be covered by one composite; if not, split it. Modern tools can help define zones, too: GIS soil surveys, yield maps, and aerial images often reveal natural divisions in the field.

2. When to split areas: Consider separate composites if you see clear differences in soil color, slope, or management. Typical examples: a low spot vs. a hilltop; a field corner with different irrigation; or former barnyard vs. the rest of the field. Also split by crop zones – e.g. if you planted corn on part and soy on another. Essentially, only mix soil cores that belong to the same general environment.

Planning the Sampling: Zones and Tools

3. Sampling unit size: Extension sources give guidelines for composite zone size. MSU recommends that each composite sample represent no more than ~10–15 acres in uniform fields. Iowa State says a uniform zone sample should cover about 10 acres max. If you suspect the soil is variable, plan smaller zones (e.g. each 2–5 acres) so that fewer differences are averaged together.

4. Tools and equipment: Gather clean, ready tools. A soil probe or auger is preferred for consistent depth cores. (In very stony fields, a screw-type auger can work better than a push probe.) Also have a clean bucket (plastic is best, especially if testing micronutrients), a sharp clean shovel or trowel, and plenty of sample bags or boxes with labels.

Bring labels, a waterproof marker or pen, and (optionally) a GPS or field map to mark sampling points. Cleanliness is important: scrub or rinse tools if moving between fields to avoid cross-contamination.

Having a plan ahead of time (a map of zones and number of samples) makes the job efficient. For example, you might decide to take one composite per 10-acre zone in each field corner.

Many farmers use GPS units or smartphones to mark sample locations as they go, which aids in future sampling. Modern precision tools (like smartphone apps) can even guide pattern or grid sampling. But even without tech, a simple zigzag or W-pattern walk through each zone works well.

Composite Sampling Procedure (Step by Step)

Soil testing through composite sampling remains the backbone of precision agriculture. Global studies show that using standardized composite sampling can reduce nutrient mismanagement by 20–30%, improve fertilizer efficiency, and increase yield by 5–15% on average.

As farming operations adopt digital tools, composite sampling remains a critical first step in generating reliable lab data for nutrient recommendations. Once zones are defined and tools are ready, follow a consistent procedure. The basic steps are: pattern, depth, collect, mix, subsample, label. Each step ensures the composite is truly representative:

Step 1: Choose a Sampling Pattern

Soil variability within a single field can be significant — recent surveys show nutrient levels may vary up to 40% within the same 10-acre zone. Choosing an effective sampling pattern is therefore essential for accuracy.

To avoid bias, collect subsamples either randomly or systematically within the zone. One simple method is a zigzag or W-pattern: walk across the area in a zigzag, stopping at roughly equal intervals to take a core. This tends to capture the variability evenly.

For large fields, you might overlay a grid (e.g. 2–3 acre squares) and sample at each grid point; this is the classic grid-sampling approach. Alternatively, use a yield map or NDVI map to identify high/medium/low productivity areas (management zones) and sample each separately. In practice, the goal is full coverage without overlap or clustering, so that every part of the zone has a chance to contribute.

Step 2: Determine Sampling Depth

Soil depth affects nutrient availability — studies show that over 70% of plant-available phosphorus and potassium is concentrated in the top 6 inches of soil. Deeper layers hold mobile nutrients like nitrate-N, which leaches more easily.

Take all sub-samples to the same depth, as this affects test results. For most row crops (corn, soybeans, wheat), the standard depth is about 6 inches (0–6″ or 0–15 cm), which aligns with where most roots and nutrients are. For perennial pastures, lawns, or shallow-rooted crops, the 6″ depth is also typical.

In no-till fields, some experts suggest 8 inches because residue slows penetration. If testing for mobile nutrients (especially nitrate-N or salt), take an additional deeper sample from 6–24 inches (as two layers: 0–6″ and 6–24″). Always avoid holes or ravines – sample the plow layer or topsoil.

Step 3: Collect Subsamples (Cores)

On average, 15–20 cores per composite sample reduce sampling error by 90% compared to only 5 cores, according to recent agronomy research. This makes the number of subsamples critical to accuracy.

Using the soil probe (or auger), take one core or slice at each sampling point. Insert the probe vertically and extract the soil core to your chosen depth. Put each core into a clean bucket. Most guidelines recommend 15–25 cores per composite to get a good average. Iowa State suggests 10–15 cores, Michigan State found 20 cores give consistent results.

Composite Sampling Procedure (Step by Step)

In practice, 15–20 cores is common. Space the cores evenly (e.g. 1 per 0.5–1 acre in a 10-acre zone) or follow the chosen pattern. Collect all cores from throughout the zone – for example, mid-row and between rows if crops are planted, and from different areas of the zone.

If one core looks very different (e.g. much darker or gravelly), you may discard it and take another, so that the composite isn’t skewed. Wear disposable gloves or rinse the probe if you move between zones to avoid cross-contamination.

Step 4: Create the Composite

Mixing is crucial: studies show that improper mixing can introduce up to 25% variation in lab results, even when sampling was done correctly.

Dump all the subsamples from the bucket onto a clean tarp or inside the bucket and break them up. Mix them thoroughly until the soil is homogeneous. Remove any rocks, roots, or debris during mixing. This step is important: it ensures the final composite sample is truly representative.

You may need to partially air-dry the soil first if it is very wet or clayey (wet clumps don’t mix well), but do so gently. Continue mixing until you have one blended pile or bucket of soil.

Step 5: Prepare the Final Sample

Most soil labs require about 1 pint (0.5–1 kg) of soil — sending more does not improve results but increases handling errors.

From the well-mixed soil, take a subsample to send to the lab. Typically this is about 1 pint (roughly 0.5–1 kg) of soil. Do not send the entire bucket. Instead, spread the mixed soil on a clean surface and use a measuring cup or scoop to collect the lab sample.

Fill the lab’s container or bag about ½ to 1 liter (or as instructed by the lab). This “aliquot” is your composite sample. The lab needs only the small, uniform portion, not all the cores. Seal the bag securely.

Step 6: Label and Record

According to FAO reports, over 30% of soil test errors occur due to mislabeling or poor record keeping — making this step critical for reliable data.

Label the sample container clearly before or immediately after filling it. Include at least: Field or Zone ID (a unique code), date, depth of sample (e.g. 0–6″), previous crop (if relevant), and your name or sampler name. Some people also note the target crop and GPS coordinates.

Writing this information on the bag or box is critical for the lab and for future reference. Keep a record (logbook or digital file) of each sample ID, what zone/field it came from, and any notes (such as “east end of field” or “south of irrigation pipe”). This metadata ensures you can interpret the results correctly and compare future samples.

Each composite sample (with its label) then goes to the lab. Before shipping, make sure it’s dry or lightly dried. (Some labs prefer samples air-dried at room temperature to avoid mold or nutrient loss.) Keep the samples cool and out of direct sun if there is any delay in shipping. If the lab tests for volatile chemicals (rare in agriculture), do not dry the sample. But for standard fertility tests (pH, P, K, micronutrients, organic matter), air drying in open sacks for a day or two is normal practice.

Applications of Composite Sampling

In 2025, over 60 % of large-scale farms worldwide utilize zone-based composite sampling to tailor fertilizer application rates, and grid sampling continues to play a key role in precision agriculture, enabling detailed fertility mapping across fields.

Composite sampling accelerates soil fertility assessment, aligning with the growing adoption of GPS-tagged field tools—over 90 % of agronomists now use such devices during sampling. Composite soil sampling is widely used in several areas:

1. Agriculture (Crop Fields): Routine fertility testing before planting is perhaps the most common use. Farmers composite-sample fields every few years (often in rotations) to guide fertilizer and lime. Since many fields are fairly uniform or large, one composite per several acres is standard practice.

2. Lawns and Gardens: Homeowners and landscapers often composite-sample lawns, turf, or garden plots to check nutrients and pH. The composite might cover the whole yard or a portion of it. Guidance usually calls for mixing 5–10 cores to represent an entire lawn area.

3. Environmental Screening: To quickly screen a large site for contaminants (e.g. old industrial land), regulators sometimes use composite samples. This tells if any overall contamination exists. If a composite shows high levels of a pollutant, then discrete point samples can be taken to find the specific hot spots. Without that initial composite, testing every corner would be too costly. (However, composites are not used when clean site levels are needed, because they could dilute a real hot spot.)

4. Research and Trials: In experimental plots, researchers often use composite sampling to characterize baseline soil fertility. For example, a university study may composite-sample each experimental block to ensure uniform starting conditions.

In all these cases, composite sampling provides a quick “big picture” of the soil over a broad area. It tells the manager where the average fertility stands and whether general amendments are needed.

How GeoPard Enables Smarter Composite Soil Sampling?

Composite sampling, when combined with advanced data-driven tools, provides growers with accurate nutrient insights at a fraction of the cost of intensive sampling. GeoPard Agriculture takes this process further by integrating remote sensing, smart algorithms, and optimal path generation — making composite soil sampling smarter, faster, and more efficient. GeoPard supports both grid-based and zone-based analysis, giving agronomists flexibility depending on the field’s history and variability.

  • 1. Grid-based sampling divides the field into uniform grid cells and places points at regular intervals, making it an excellent approach for initial field assessments or when no prior data exists.
  • 2. Zone-based sampling, on the other hand, leverages data such as yield maps, soil maps, and satellite imagery to create management zones that reflect the true variability of the field.

By strategically placing samples within each zone, farmers capture the unique characteristics of their fields more efficiently, particularly in areas where variability is already known. Furthermore, when it comes to the type of sampling, GeoPard accommodates both core and composite methods.

  • Core sampling involves analyzing each individual soil sample separately, offering the highest resolution of variability but with higher lab costs.
  • Composite sampling, by mixing multiple cores into a single representative sample for each grid or zone, balances cost-effectiveness with actionable insights — making it especially practical for large fields without losing the advantages of zone-specific data.

To keep workflows organized, GeoPard provides customizable label templates that automatically tag sampling points by zone ID or sequence number. This ensures that samples are well-documented from field collection through to lab analysis and reporting, reducing the risk of errors and making results easier to interpret.

Efficiency in the field is further improved through GeoPard’s path generation logic. The Smart Optimal Path feature automatically calculates the shortest and most efficient walking or driving route across all zones, minimizing time and distance traveled. Alternatively, agronomists can choose a zone-by-zone collection method, which simplifies operations by focusing on one zone at a time regardless of overall path length.

For first-time users, GeoPard’s Smart Sampling Recommendation is the best starting point, as the system adapts to the unique characteristics of each field to balance statistical accuracy with operational efficiency. By combining composite soil sampling with the power of precision agriculture and remote sensing, GeoPard ensures that farmers and agronomists receive the most representative, cost-effective, and actionable soil data possible.

From Uniform to Zoned: Precision Agriculture Concepts

While composite sampling is about averages, precision agriculture (PA) is about recognizing and managing variability. Precision ag uses tools (GPS, sensors, software) to ensure each part of the field gets the right treatment. The USDA defines precision agriculture as “farming tools based on observing, measuring, and responding to within-field variability.” In practice, this means dividing a field into smaller management zones (each relatively uniform) and managing each zone on its own terms.

1. Zone-Based Management

Global adoption of precision agriculture is growing rapidly. According to MarketsandMarkets, the precision farming market is projected to reach $21.9 billion by 2030, growing at a CAGR of nearly 12% from 2025 onward. Around 70–80% of new farm equipment sold in North America now comes with GPS or precision technology capabilities. This reflects a strong shift from traditional uniform approaches to more data-driven, zone-specific management.

The core idea is zone-based management: rather than treating a whole field the same, PA aims to apply inputs (fertilizer, seed, water) variably, matching the differing needs of each zone. Zones might be created using soil type maps, yield history, or sensor data. For example, a low-lying wet area of the field might be one zone, and a higher well-drained area another.

2. Precision Technologies

The global use of precision farming technologies such as drones, soil sensors, and variable-rate applicators is accelerating. Reports indicate that over 80% of large-scale farms in developed countries use GPS-guided equipment, and drone-based crop monitoring is expected to cover more than 60% of arable land in the U.S. by 2027.

These tools are estimated to reduce fertilizer and chemical use by up to 20% while increasing yields by 10–15% on average. Precision technologies help this in two key ways:

  1. Data collection: GPS-enabled planters, yield monitors, and soil sensors record information at very fine resolution.
  2. Variable application equipment: Tractors and sprayers can automatically vary rates as they move.

For example, variable-rate applicators (VRT) use prescription maps to put more fertilizer where needed and less where not. Yield monitors on combines record yield in real time and later create yield maps. The result is site-specific management instead of “one-size-fits-all.”

3. Remote Sensing

As of 2025, the global precision agriculture market is valued at over $12 billion, with remote sensing playing a central role in data-driven decision-making. The adoption of drones for agricultural monitoring is growing at a rate of over 30% annually, while satellites like Sentinel-2 now provide imagery with resolutions as fine as 10 meters every 5 days.

In the United States alone, more than 60% of large-scale farms now use some form of satellite or drone-based sensing for crop monitoring, water management, or soil mapping. This rapid growth highlights the critical role of remote sensing in optimizing yields and resource efficiency.

RS can reveal patterns invisible at ground level. For example, satellite images processed for NDVI (Normalized Difference Vegetation Index) show plant “greenness” and vigor across an entire field. Healthy, dense crops reflect more infrared light; NDVI captures that mathematically.

Remote sensing provides data layers that help define sampling zones. Imagine an NDVI map colored from blue (poor growth) to green (vigorous growth). Those color patterns often align with underlying soil fertility or moisture. Similarly, multispectral drone images can show where crops are stunted, waterlogged, or nutrient-deficient. By overlaying NDVI imagery, yield maps, or soil electrical conductivity maps in a GIS program, agronomists identify stable management zones – areas that tend to act similarly over time.

For example, Iowa researchers have demonstrated that “yield maps from many years and aerial images of both bare soil and crop canopy can be used to identify management zones” because these products tend to reflect underlying soil conditions. In practice, a farmer might use two years of GPS yield data plus a soil survey to split a field into 3–5 zones (high-, medium-, low-yield zones).

Each zone is presumed to have roughly uniform soil conditions, and then each zone is composite-sampled. This data-driven composite sampling yields more precise recommendations than sampling the whole field as one.

Remote sensing is also moving to higher resolution and frequency. New satellites (PlanetScope, Sentinel) deliver NDVI at ~3–10 m resolution every few days. Drones can fly fields weekly, capturing detailed crop color images. These trends mean managers can spot small patches of stress and adjust zones as needed. Already, large farms commonly subscribe to satellite services or have field drones to “scout” crops. These layers feed into modern GIS or farm-management software to help draw the new sampling boundaries.

Integrating Composite Sampling with Precision Ag

Precision agriculture technologies have enabled input application efficiencies of up to 15–20%, with average yield improvement ranging between 8–12 bushels per acre through variable-rate nutrient management—underscoring the importance of integrating composite sampling into data-driven workflows. In a precision-ag workflow, composite sampling still plays a role, but it is guided by the data:

1. Pre-sampling analysis: Gather all available data – past yield maps, satellite NDVI or drone imagery, soil type and topography maps. Use this information to divide the field into 3–6 management zones of roughly uniform soil potential. Each zone might be contiguous, or some zones might include separate areas that look similar (for example, two low spots in different parts of the field could be one “low fertility” zone).

Integrating Composite Sampling with Precision Ag

2. Zone-based composite sampling: For each management zone, collect and composite soil cores as before. In practice, that means taking ~15–20 cores within zone A and mixing them, then a separate composite for zone B, etc. Each zone yields one sample bag. You might end up with several soil tests for one field (one per zone) rather than just one for the whole field.

This approach is sometimes called “directed composite sampling” or “zone sampling.” It retains the cost advantages of compositing (one analysis per zone) but avoids averaging across dissimilar areas.

3. Analysis and prescription: Send each zone sample to the lab. When results come back, you will have different values for each zone. For example, Zone A might need more phosphorus than Zone B. You then create a variable-rate prescription map for fertilizer or lime: treat each zone according to its own needs. Many precision-planter or sprayer controllers can use these zone maps to apply inputs.

4. Validation and refinement: In subsequent seasons, monitor crop performance. Use your combine’s yield monitor (or continued satellite NDVI) to see if the zones you defined were indeed distinct in yield. Adjust your zone boundaries or the number of zones as needed. Over time, this feedback loop should improve the accuracy of zones and the efficiency of input use.

In effect, PA/RS have transformed “composite sampling” from a one-sample-per-field process into a multiple-samples-per-field process, each sample representing a precise, data-defined area. This yields better information. As one industry blog puts it, GPS grid (or zone) sampling “allows for the creation of variable rate prescriptions, ensuring that each area of the field receives the appropriate amount of nutrients.

This level of precision is not possible with composite sampling, which provides only an average nutrient level”. In other words, composites remain used, but within smaller, smarter zones. The integration of composite sampling with technology is still evolving. Some trends on the horizon include:

  • High-resolution sensors: For example, hyperspectral cameras or red-edge bands can detect nitrogen deficiencies, water stress, or disease before the crop shows symptoms.
  • On-the-go soil sensing: Equipment like electromagnetic (EM38) sensors, gamma-ray, or near-infrared probes can “scan” the field in real time. Modern tractors can tow soil sensors or even have sub-surface electromagnetic sensors on the go, producing high-density soil maps on the fly.
  • Artificial intelligence and data fusion: Machine learning models can combine historical soil tests, weather, yield, and remote sensing data to predict nutrient levels or identify zones automatically. For example, an AI system could analyze years of NDVI and yield to suggest new zone boundaries.

Záver

Composite soil sampling is a time-tested, cost-effective method to gauge the average soil fertility of large areas. It simplifies soil testing by giving one result per zone, guiding uniform management for that zone. However, its inherent averaging can mask important differences. The rise of precision agriculture and remote sensing is not eliminating composite sampling; rather, it’s redefining where and how we composite. By using GPS-guided samplers, yield maps, and satellite/drone imagery, farmers now often sample in zones of similar productivity, making each composite sample more meaningful.

Čo je narušený a nenarušený odber pôdnych vzoriek?

Soil sampling is a critical process in agriculture, geotechnical engineering, and environmental management because it provides the basic data on soil condition and quality needed for decision making. It informs farmers about nutrient levels, helps engineers design stable foundations, and allows scientists to monitor contamination.

In practice, vast areas are sampled: for example, China’s recent national soil survey covered about 730 million hectares and collected over 3.11 million soil samples. This reflects the scale of global soil monitoring efforts. In fact, the global soil testing equipment market was valued at around $5.52 billion in 2023 and is expected to grow roughly 10.4% per year through 2030.

However, not all soil samples are collected the same way. The method used can preserve the soil’s natural structure (an undisturbed sample) or mix it (a disturbed sample), and this choice greatly affects what tests can be done on the sample.

Disturbed Soil Sampling

Soil investigations worldwide heavily rely on disturbed samples because they are inexpensive and quick to obtain. According to agricultural surveys, over 80% of farm soil tests in North America and Europe are based on disturbed composite samples, while in construction, disturbed split-spoon samples are part of more than 90% of geotechnical site investigations. This widespread use highlights their practicality in large-scale projects.

A disturbed soil sample is one where the soil’s original structure or moisture regime has been altered during collection. In other words, the layers may have collapsed or mixed, and the particles are no longer in their in-situ arrangement. This type of sample is acceptable when only the soil’s basic composition is needed.

For example, disturbed samples are used for chemical analyses (nutrients, pH, contaminants) and classification tests (grain-size distribution, Atterberg limits). Once mixed, the sample gives accurate results for these properties even though structural details are lost.

Common disturbed-sampling techniques include hand augers, bucket augers, shovels, and split-spoon samplers. These methods are simple, low-cost, and quick. For instance, a hand or power auger (a screw drill) is twisted into the ground and soil cuttings are periodically brought up.

The soil removed (often from a shallow depth) can be collected in a container for analysis. Auger drilling is typically used for disturbed samples in shallow investigations (up to ~20 feet deep). The cuttings from the auger are often mixed together to form a bulk sample. This is a rapid way to collect material for nutrient testing or basic soil classification when detailed layering information is not needed.

Common disturbed-sampling techniques

Another very common disturbed method is the split-spoon sampler (used in the Standard Penetration Test, SPT). A split-spoon is a hollow steel tube driven into the ground by repeated hammer blows. After each 6-inch drive, the number of blows (the “N-value”) is recorded as an indication of soil compactness. When the sampler is withdrawn, the core of soil inside is removed and split open for examination.

The extracted sample is disturbed (it has been hammered and scrapped out of the hole), but it provides good qualitative information on grain size, moisture content, and consistency. Split-spoon samples are widely used on construction sites and environmental assessments because they provide both a disturbed soil sample and an in-situ density index (blow count).

Split-spoon (SPT) sampling uses a hollow tube hammered into the soil to collect a disturbed core and measure resistance. It is widely used in geotechnical and environmental field investigations for soil classification and density testing.

Disturbed sampling is also standard in agriculture and pollution surveys. Farmers typically collect many small cores (using a soil probe or auger) from different parts of a field and mix them into a composite sample for laboratory analysis. For example, one guideline recommends taking 15–20 soil cores per 4–5 hectares of field and combining them into a single mixed sample.

That sample is then tested for pH and nutrient levels to guide fertilization. Similarly, when testing for contaminants, multiple cores across the site may be composited so the lab analysis represents the area. Because the samples are mixed, precise layering or structure is irrelevant for these tests.

The main advantages of disturbed sampling are cost, speed, and simplicity. Little equipment is needed and many samples can be taken quickly. This makes it ideal for large-scale surveys and preliminary screenings. The limitations are that no information about in-situ density, strength, or compaction can be obtained from such samples.

You cannot use a disturbed sample to measure shear strength or settlement. In short, disturbed sampling is best when chemical or classification data is needed, but it cannot support tests of the soil’s natural mechanical or hydraulic behavior.

Undisturbed Soil Sampling

With the global push for safer infrastructure, undisturbed soil sampling has become a standard in major construction projects. For instance, in 2022, more than 65% of infrastructure projects in Asia-Pacific included undisturbed Shelby tube or piston sampling as part of their ground investigation. The demand for accurate geotechnical data is also fueling the growth of advanced samplers, with the market for high-precision soil coring tools expected to grow by over 8% annually through 2030.

An undisturbed soil sample is obtained with minimal alteration so that the soil’s original fabric, stratification, and moisture remain intact. This involves specialized techniques and tools. Undisturbed samples are required when measuring properties that depend on the soil’s structure (e.g. shear strength, compressibility, hydraulic conductivity). By keeping the sample essentially “as it was in the ground,” the laboratory tests will reflect real field conditions.

Undisturbed Soil Sampling

Stránka most common tool for undisturbed sampling is the thin-walled Shelby tube (also known as a push tube or Acker tube). A Shelby tube is a steel cylinder, typically 2–3 inches in diameter and 24–30 inches long, with one sharp end. It is pushed (often hydraulically) into the soil to capture a core.

Because the wall is thin, the cutting edge shears off a cylinder of soil with minimal disturbance. After penetration, the tube is carefully extracted; the soil core inside comes out largely intact. The tube is then sealed (with a cap or wax) to preserve moisture and structure. The extracted core can be transported to a lab for testing.

Thin-walled Shelby tubes are pushed into clay or silt layers to recover nearly undisturbed soil cores for lab tests. Each core is sealed immediately after retrieval to maintain its natural moisture and structure.

Other undisturbed methods include piston samplers a block sampling. A piston sampler works by driving a tube into the soil with a piston inside to prevent suction and disturbance. Block sampling involves cutting out a large cube of soil (rarely used, due to difficulty) to get a fully intact block. The goal of all these methods is to minimize disturbance: the sampler moves steadily and cleanly, avoiding jolts and vibration that could disturb the soil fabric.

Undisturbed samples are used for laboratory tests that cannot tolerate disturbance. Common tests include triaxial shear tests (for strength), oedometer consolidation tests (for settlement), and constant-head or falling-head permeability tests (for flow). For example, a Shelby tube sample of clay will be tested under controlled stress to see how it compresses, which is critical for predicting foundation settlement.

Stránka advantages of undisturbed sampling are accuracy and completeness for engineering properties. An intact sample gives reliable data on how soil will behave in its natural state. The limitations are that it is costly, complex, and sometimes impractical. Drilling rigs and trained operators are needed.

The process is slower, and there is a risk of losing the sample if it crumbles. Even so-called undisturbed samples can acquire some disturbance if not collected properly; this is why careful techniques and standards are critical.

Role of Precision Agriculture in Disturbed vs. Undisturbed Soil Sampling

Precision Agriculture (PA) is fundamentally changing how we collect and utilize soil data, optimizing both disturbed and undisturbed sampling methods for unprecedented efficiency and insight. By integrating advanced sensors, data analytics, and targeted sampling strategies, PA addresses the traditional trade-offs between cost, scale, and accuracy.

Disturbed Sampling: Speed, Scale & Automation

1. Targeted Grids/Zones: PA uses satellite imagery, yield maps, and EM soil sensors to create management zones. Instead of uniform grids (e.g., 1 sample/acre), sampling density drops 50-70% while maintaining or improving accuracy. Farmers sample only key zones, saving time and lab costs.

2. Automation: Robotic soil probes (e.g., Agrowtek, FarmDroid) autonomously collect disturbed samples at predefined points. This slashes labor costs by up to 50% and enables high-frequency monitoring impractical manually.

3. On-the-Go Analysis: Mounted NIR/PXRF sensors on tractors or UTVs provide instant disturbed soil analysis for pH, organic matter (OM), and key nutrients (K, P) in the field, enabling real-time decisions.


Undisturbed Sampling: Precision Placement & Viability

1. Pinpointing Critical Areas: PA identifies high-value or problematic zones (e.g., compaction hotspots via yield maps + penetrometer data, potential contamination areas via historical data) where undisturbed sampling’s cost is justified. Drones with LiDAR or thermal cameras further refine these targets.

2. Guided Extraction: GPS-guided hydraulic coring rigs ensure precise placement of Shelby tubes or piston samplers exactly where needed for critical shear strength or hydraulic conductivity tests, maximizing data value per sample.

3. Reducing “Disturbance”: Technologies like sensor-feedback during coring (monitoring insertion force/vibration) help minimize unintended disturbance, improving sample quality for lab analysis.

Disturbed vs. Undisturbed Soil Sampling Analysis with GeoPard

Modern soil sampling is no longer just about collecting dirt from the ground—it’s about precision, efficiency, and accuracy. This is where GeoPard Agriculture plays a vital role.

By combining advanced algorithms, smart path planning, and zone-based intelligence, GeoPard ensures that both disturbed and undisturbed soil sampling are carried out in a way that saves time, reduces cost, and maximizes data quality. GeoPard supports both grid-based a zone-based sampling strategies.

1. Grid-Based Sampling is useful for disturbed samples in fields where no prior data exists. It divides the land into equal cells and ensures that soil is sampled systematically across the entire area. This provides a solid baseline for nutrient analysis, especially in new fields.

2. Zone-Based Sampling leverages field variability data such as yield maps, satellite imagery, and soil maps. This method is particularly effective when dealing with undisturbed sampling, where soil structure and physical properties must be preserved from representative zones. By focusing only on distinct areas of variability, it avoids unnecessary disturbance and captures meaningful soil differences.

Furthermore, GeoPard allows users to define label templates for each sampling point, whether disturbed or undisturbed. This improves lab processing and ensures that results are easy to trace back to exact field locations. Organized labeling also reduces errors and helps generate clearer reports for decision-making. Meanwhile, GeoPard offers multiple options for point placement within zones:

  • Smart Sampling Recommendation (recommended): Uses AI to optimize point placement, adapting density based on variability. More points are taken in variable areas, fewer in uniform areas. This is especially valuable when sampling disturbed soils for fertility mapping.
  • Core Line Logic: Places points along straight transect lines, ideal for machinery-based sampling and for creating consistent undisturbed cores that reflect natural soil layering.
  • N/Z Logic a W Logic: These zigzag or back-and-forth patterns ensure coverage across irregular or elongated zones. This is helpful for both disturbed and undisturbed samples, especially in fields where soil transitions or compaction issues need to be monitored.

Why GeoPard Matters for Disturbed vs. Undisturbed Sampling?

  • For disturbed samples, GeoPard ensures that sampling is representative, systematic, and cost-effective. Farmers get precise nutrient maps that power variable-rate fertilization and reduce input costs.
  • For undisturbed samples, GeoPard helps identify the most critical zones for careful extraction, making sure that compaction, porosity, and hydraulic properties are assessed where they matter most.

Tip: For first-time soil sampling, GeoPard recommends using its Smart Sampling Recommendation. The system automatically adapts to the unique characteristics of each field, ensuring a balance between accuracy and efficiency.

Choosing a Soil Sampling Method

Globally, around 70% of routine soil tests rely on disturbed samples, but when safety or structural integrity is involved, undisturbed methods dominate. For example, more than 80% of highway and bridge projects in the U.S. and Europe specify undisturbed sampling in their geotechnical contracts. This shows that method choice is not only technical but also tied to regulations and risk management.

The decision between disturbed and undisturbed sampling depends on the project goals, the soil type, and practical constraints. In general:

1. Sampling Objective: If you only need chemical or grain-size information (for example, soil fertility or basic classification), a disturbed sample is sufficient. If you need mechanical or hydraulic properties (strength, compressibility, permeability), you must collect undisturbed samples.

For example, a foundation design study needs data on clay compressibility, so engineers would use Shelby tubes or piston samplers to get intact cores. If the goal is simply to measure nutrient content, a quick auger sample will do.

Choosing a Soil Sampling Method

2. Soil Conditions: Cohesive soils (clays, silts) often require undisturbed sampling to preserve their structure. In contrast, very loose sands or gravels may be difficult to sample intact (the hole tends to collapse). In such cases, engineers may rely on split-spoon samples or perform in-situ tests instead.

3. Depth and Access: Deep sampling or hard layers may only be accessible with heavy equipment. If only shallow samples are needed, hand tools may suffice. Conversely, collecting an undisturbed core from deep ground water often requires large-diameter drilling, which may not be possible on tight budgets.

4. Cost and Time: Disturbed methods are low-cost and fast. An auger or split-spoon rig can rapidly collect many samples. Undisturbed methods are high-cost and slow (equipment rental, labor). This must be balanced against project needs. For example, a large-scale fertilizer survey might use only disturbed samples for speed, whereas a high-value construction project will invest in undisturbed coring for safety.

5. Regulatory Requirements: Sometimes regulations dictate the sampling method. For instance, regulations for ground-water monitoring often require undisturbed sampling for permeability tests. In practice, if testing standards (ASTM, EPA, etc.) call for a “thin-walled tube sample,” then that method must be used.

In summary, match the method to the property of interest: use disturbed sampling when only composition matters, and undisturbed sampling when in-situ structure matters.

Applications of Disturbed And Undisturbed Soil Sampling

The importance of soil sampling is reflected in sector-specific demand. The global agricultural soil testing market exceeded $2.6 billion in 2023, while geotechnical testing contributed heavily to the construction sector’s growth, with investments in soil sampling services increasing by over 12% annually in developing countries. Environmental testing, particularly for contamination, is expected to rise significantly due to stricter regulations.

1. Agriculture: Soil sampling for farming typically focuses on fertility (chemical composition) and rarely requires preserving soil structure. Agronomists usually collect many shallow cores across a field (often 15–30 cores per field or 4–5 hectares) and combine them into a composite sample.

A clean bucket or probe collects soil (usually from 0–15 cm depth) from each point, and these subsamples are mixed in one container. That mixture is sent to a lab to test pH, nitrogen, phosphorus, potassium, etc. The composite approach averages out small-scale variability. The tools are often simple probes or augers and the samples are inherently disturbed, but that is acceptable for chemical tests.

Agricultural soil sampling often uses probes or augers to take many small cores across a field, then mixes them into one composite sample for nutrient analysis.

2. Geotechnical Engineering: Design of foundations, embankments, and pavements requires knowledge of soil strength and deformation. This usually mandates undisturbed sampling (especially in fine-grained soils). In a typical geotech investigation, drillers may alternate between disturbed and undisturbed samplers in the same boring.

For example, in a clay layer they might first drive a split-spoon sampler to get a disturbed sample for Atterberg limits and grain size, and then drive a thin-walled Shelby tube to get an undisturbed core for consolidation and shear tests. The tube cores will then be tested for properties like compressibility and bearing strength, while the spoons are used for classification.

In sandy soils, engineers may rely more on SPT samples (since Shelby tubes don’t work well in loose sand) or use vibracoring to get relatively undisturbed samples if needed.

3. Environmental Investigation: Environmental projects often use a mix of methods. When mapping contamination, technicians commonly collect disturbed auger samples or hand-auger borings at many locations to test for pollutant concentrations. These samples can be quickly obtained and give the concentration of chemicals in the soil.

However, if the study involves understanding how contamination moves (e.g. leaching through soil into groundwater), undisturbed samples are needed to measure permeability or sorption. In practice, a site investigation might use disturbed sampling for basic screening and then one or more undisturbed cores for in-depth hydraulic or mechanical testing.

Challenges and Best Practices

Soil sampling errors cost industries significant money. A recent estimate suggested that poor sampling and handling can lead to up to 25% data inaccuracy, resulting in unnecessary fertilizer costs for farmers and potential safety risks in geotechnical projects. As a result, stricter adherence to best practices has become a focus, with modern labs reporting that quality-controlled undisturbed cores improve reliability of strength testing by over 30% compared to poorly handled samples.

Collecting high-quality soil samples requires careful attention to avoid unintentional disturbance and to preserve the sample. Even an “undisturbed” sample can be compromised if it is shaken or allowed to dry. To minimize disturbance, drillers use slow, steady techniques: for example, pushing a Shelby tube at a constant rate with hydraulic pressure, or using a piston to gently advance a sampler.

Vibration and rapid withdrawal should be avoided in sensitive soils. Standard procedures (e.g. ASTM methods) often specify filling samples slowly to prevent washing away fines or creating pressure changes.

Once collected, preserving the sample is crucial. An undisturbed core must be sealed immediately to keep its moisture and structure. The common practice is to cap and seal the ends of a tube core (often with metal end caps or wax) as soon as it is out of the ground. This prevents water from evaporating and the core from cracking.

The sealed sample is then stored upright or properly supported and transported to the lab. If undisturbed samples are shipped upright in a rigid sleeve, their orientation (vertical axis) is kept the same for testing.

Disturbed samples (bulk or composite) should be placed in clean, airtight bags or containers once collected to avoid contamination or moisture change. Field labeling (borehole ID, depth) and chain-of-custody records are also best practice to avoid mix-ups.

Getting a representative sample is another practical concern. Field variability means sampling should cover the area of interest. In agricultural sampling, this is handled by compositing many subsamples as described above. In site investigations, drillers may use grid or pattern sampling: for example, regulations might require boreholes in a grid so that no major landform is missed.

Within a borehole, samples are usually taken at regular depth intervals and at any visible layer change. Quality control logs often note the recovery of each sample (for instance, if a tube retrieved the full length of soil) to judge sample reliability. Some labs even X-ray or CT-scan undisturbed cores to check if they remained intact during transport.

Záver

In summary, disturbed a undisturbed soil sampling are two complementary approaches that serve different purposes. Disturbed sampling (using augers, spoons, or excavated material) is fast and cost-effective for obtaining chemical and classification data. Undisturbed sampling (using Shelby tubes, piston samplers, etc.) is more complex but necessary for accurately measuring mechanical and hydraulic properties.

The choice of method should always align with the project goals. Routine agronomic surveys will almost always use disturbed, composite sampling for fertility. Major construction or groundwater projects will emphasize undisturbed cores for engineering tests. The need for soil data is only growing. Advances in technology—such as automated soil samplers, in-situ sensors, and precision agriculture tools—are beginning to make sampling more efficient and data-rich.

Odber vzoriek pôdy: Náhodný, sieťový a zónový

Soil sampling is used in many fields, including construction. For example, before building foundations engineers use heavy drill rigs to bore soil cores and test ground stability (as shown above). Collecting soil cores on a construction site or environmental cleanup project helps engineers and regulators detect contamination (like heavy metals or hydrocarbons) and assess ground conditions.

What Is Soil Sampling?

Soil sampling means taking small samples of soil from a field or site and sending them to a lab for analysis. This process reveals the soil’s health and fertility by measuring nutrients (like nitrogen, phosphorus, potassium), pH, organic matter, and other properties.

Well-conducted sampling helps farmers and land managers make better decisions: they can match fertilizer to actual needs, avoid wasting inputs, and protect the environment. For example, a survey of U.S. corn and soybean farmers found that most used grid soil sampling as part of their nutrient management.

Notably, 67% of those farmers reported higher yields and a $24/acre reduction in corn production costs after adopting soil-sampling-driven management. In short, soil sampling provides a “snapshot” of field fertility and soil health, guiding sustainable land management and increased productivity.

In agriculture, similar soil samples ensure crops get the right nutrients. Overall, the key goals of soil sampling are clear: fertility assessment (to guide fertilization), contamination detection (to ensure safety), research, and planning construction or land use. By defining clear objectives and carefully sampling, we get reliable data that underpins good decisions and sustainable soil use.

What Is Soil Sampling

Pre-Sampling Planning

As of 2025, over 80% of precision agriculture operations globally use pre-sampling planning with GIS, satellite imagery, and historical crop data. Pre-sampling planning ensures that the collected soil samples represent the field accurately, saving money and improving decisions.

Fields that undergo proper zoning and planning before sampling show up to 25% higher fertilizer efficiency. This stage is critical for tailoring the sampling method to the objective, whether for farming, environmental studies, or construction.

Before heading to the field, thorough planning is essential. Start by defining the goal: are you sampling for farm nutrient management, environmental cleanup, or construction? For example, an agricultural soil survey might focus on fertility and organic matter, while an environmental assessment might target lead or pesticide residues. Review site history to catch clues: soils “have a long memory.”

An Iowa State extension article notes that old manure storage or feedlots can leave “hot spots” of phosphorus or potassium near barns. Satellite imagery and historical aerial photos are useful: free resources like Google Earth or the USDA’s aerial imagery archives let you see past field layouts. In fact, Iowa’s extension suggests using historic imagery (back to the 1930s) to spot past field uses that explain soil test results.

Map the area first. Use topographic or soil-survey maps to note major soil changes or slopes. Modern tools like GIS and GPS are invaluable. For instance, zone sampling (a precision-agriculture method) uses layers of data – soil type, past yields, management history – to split a field into zones of similar fertility.

Pre-Sampling Planning

Satellite or drone images of vegetation can also hint at variations. The upshot: identify distinct zones or uniform areas so each soil sample represents a meaningful portion of the land. Planning pays off by ensuring samples truly reflect field variability, not random guesswork.

Key tools for planning include field maps or GPS units to mark sample spots, plus any records of previous soil tests or land use. Knowing exactly where each sample comes from (with GPS coordinates or detailed sketch maps) is critical later for labeling and analysis. By delineating zones or grids ahead of time, you can decide how many samples to take and where. Remember: sampling is only useful if it matches your management goals and covers known field differences.

Essential Tools & Equipments

In 2024, over 90% of professional agronomists and large-scale farmers in North America used stainless-steel soil probes and GPS-tagged sampling kits to ensure data quality. Precision tools reduce contamination risks and provide high repeatability. Digital soil testing devices are growing in popularity, but traditional augers, clean buckets, and composite sample bags remain the global standard.

1. Soil probes and augers are the core tools for sampling. These hand-held or machine-driven devices bore into the ground to extract a cylindrical soil core. Common types include hand augers, push probes, or power augers. In general, use stainless steel or clean-plastic tools to avoid contamination.

2. Buckets and bags: Carry a clean plastic bucket to mix cores, and plastic sample bags to hold the final sample. (Plastic is preferred especially if you’re testing for elements like zinc, which metal can contaminate.) Each new sample zone needs its own bucket – do not mix buckets between fields or locations.

3. Sample containers: Use thick plastic or polyethylene bags that seal well. Label each bag with waterproof ink or stickers. GPS or map: Bring a GPS device or printed field map to mark where each sample was taken. Field notebook/labels: Carry waterproof labels or a notebook to write down each sample ID, date, location, depth, and any notes.

4. Clear labeling (site, date, sampler initials) is vital for later analysis and for any regulatory records. Coolers/ice packs: If you can’t ship samples immediately, keep them cool. Chilling samples to about 4°C slows biological changes. (For volatile contaminants, experts recommend sealing cores in a bag with no air and keeping them on ice until sent to the lab.)

5. Finally, contamination-prevention supplies: bring extra zip bags or buckets so tools can be cleaned between sites. Good practice is to decontaminate tools (rinse with water and detergent) between fields, and avoid touching sample soil with bare hands. Keeping tools and containers clean prevents one-sample contamination from skewing results.

Soil Sampling Techniques

According to 2025 global agriculture reports, zone sampling is now used on over 60% of large farms, while grid sampling is preferred for high-resolution soil fertility maps. Consistent sampling depths and good patterns can improve soil test reliability by over 40%. Advances in satellite mapping and variable-rate fertilization rely heavily on precision sampling strategies.

To get meaningful data, choose a sampling pattern and depth that fit your objectives. There are three basic pattern strategies: random, grid, or zone sampling.

1. Random (composite) sampling: For a uniform field or when detailed data is not needed, you can take random cores from across the area and mix them. This gives one average sample for the whole field. However, it may miss variability, so it’s less precise.

2. Grid sampling: Overlay a regular grid (for example, 2.5-acre or 1.0-hectare cells) on the field. At each grid point, take a composite of several cores (often 5–10 cores within an 8–10 ft radius). This creates many smaller-area samples that reveal how fertility varies across the field. Proper grid sampling makes it possible to identify variation within a field and is a foundation of precision agriculture.

3. Zone sampling: If you already know parts of the field behave differently (due to soil type, past management, terrain, or yield history), divide the field into a few “management zones.” Sample each zone separately by taking a composite from it. Zone sampling uses existing knowledge – like soil maps or yield data – to draw boundaries.

This can cut down sampling (fewer samples than a fine grid) while still capturing key differences. In practice, each zone might be sampled with 10–15 cores in a zig-zag (M- or W-shaped) pattern. Georeferencing (recording GPS points of sample spots) lets you revisit or adjust zones in future sampling seasons.

soil Sampling Techniques

Sampling depth: The soil depth you sample depends on the test. For general fertility tests (nutrients and pH for crops), the typical depth is about 6 inches (15 cm) in tillage systems. This is because plant roots mostly exploit the topsoil, and calibration data (fertilizer recommendations) assume that depth.

Subsoil tests (for leaching or deep nutrients) may sample deeper, often 6–24 inches (15–60 cm). And if you’re checking for buried contaminants, you may need layers of soil at multiple depths. The key rule: be consistent and target the zone of interest. Shallow sampling (less than intended) can falsely show high nutrient levels, since nutrients concentrate near the surface.

Composite sampling: In each sampling area (grid cell or zone), collect multiple subsamples and combine them. A standard practice is 10–15 cores per composite sample. Take cores from a representative pattern – for instance, scattered evenly or in an “M” or “W” shape across the area.

Put all the cores in the bucket and thoroughly mix them. This composite better represents the whole area than any single point. While mixing, watch out for outliers: if one core looks very different (darker color, very wet/dry, or contaminated by recent spill), discard it. Removing such anomalies keeps the sample representative.

Step-by-Step Soil Sampling Procedure

Recent field surveys in 2024 found that 42% of sampling errors occurred due to skipped or misapplied steps in the sampling procedure. Proper step-by-step procedures can improve soil data accuracy by over 35%. Experts recommend using field checklists to maintain consistency and reduce oversight during collection.

i. Clear the surface. Remove debris, vegetation, or large rocks where you plan to take cores. For example, clear plant litter or manure piles so the sample is true soil.

ii. Extract cores at a consistent depth. Using your auger or probe, drill into the soil to the target depth. Push or twist the probe straight down and remove the core. Repeat this at 10–15 locations within the area you’re sampling. For fertilizer tests, all cores should reach the same depth (e.g. 6 inches). If you’re sampling deeper for nitrates or contaminants, use a deeper probe or power auger.

Step-by-Step Soil Sampling Procedure

iii. Place cores in a clean bucket and mix. Dump each core into your bucket as you go. After collecting all subsamples for that area, stir the bucket contents thoroughly until uniform. This mixing ensures an even composite.

iv. Take the composite subsample for the lab. From the well-mixed bucket, scoop out the recommended amount of soil (often 1–2 pounds or about 0.5–1 kg) into a labeled sample bag. This is the sample you’ll send to the lab. It represents the average conditions of that field area.

v. Label each sample immediately. Every bag should be clearly marked with an ID number or code, GPS location or field name, depth of sampling, and date. Lab instructions stress labeling with site name, date/time, and sampler initials.

vi. Store or ship properly. If samples can’t go to the lab right away, keep them cool (refrigerate or place in a cooler with ice packs). Chilling to about 4°C slows microbial and chemical changes in the soil. Try to get them to the lab within 24–48 hours.

Soil Sample Handling & Documentation

A 2024 audit of lab soil submissions found that 1 in 5 samples arrived with incorrect or missing labels, leading to delays or rejection. Proper handling and documentation not only maintain sample integrity but also ensure legal and scientific accuracy, especially in regulated industries.

After collecting samples, handle them carefully to avoid mix-ups or contamination. Always use clean gloves when handling soil after extraction – this prevents oils or chemicals from contaminating the sample. Between sampling locations, clean your tools and bucket (soap and water rinse) to prevent carryover of soil.

Document everything. In your field notes (or digital logs), record the GPS coordinates of each sample location, field or site descriptions, cropping history, and any observations (odors, visible contamination, color changes). Note what crop is currently grown or intended, since nutrient needs depend on the crop.

For environmental sampling, note any nearby potential sources of pollution (like an old factory or pesticide storage). All this metadata should accompany the sample to the lab. A good record might read: “Sample 5: Cornfield Zone A, sandy loam with manure history, sampled 0–6″ depth, Aug 3, 2025, composite of 12 cores.”

If the samples are for regulatory or compliance testing (such as EPA soil tests), use a chain-of-custody form. Include the project name, sample IDs, collection dates and times, and analytes required.

This ensures the lab can trace who collected the sample, how it was handled, and meet any quality requirements. Proper documentation – labels, notebooks, and COC forms – ensures the lab can match results to the right field, making your soil data reliable and defensible.

Laboratory Analysis & Interpretation

As of 2025, over 75% of U.S. farmers rely on laboratory soil analysis at least once every three years, with a growing trend toward annual sampling in precision agriculture. The most common tests include pH, NPK, organic matter, and CEC.

Proper interpretation of these results has led to a 20–30% reduction in fertilizer waste in many regions. Once in the lab, the soil samples are analyzed for the requested tests.

Standard fertility tests usually measure:

  • Soil pH and acidity – key for liming decisions.
  • Major nutrients: phosphorus (P), potassium (K), and often nitrogen (N).
  • Secondary nutrients: calcium, magnesium, sulfur.
  • Micronutrients: iron, manganese, zinc, boron, copper, etc.
  • Organic matter content – indicates long-term fertility and soil health.
  • Cation Exchange Capacity (CEC) – soil’s capacity to hold and exchange nutrient ions.

Specialty analyses might be ordered if needed:

  • Heavy metals like lead, arsenic, cadmium, and chromium.
  • Pesticides or organics if there’s potential contamination.
  • Microbial tests to assess biomass or pathogens.
  • Texture and CEC analysis for sand/silt/clay ratios.

When lab reports come back, interpreting them is the next step. Each lab report will list the test values along with either reference guidelines or a rating. For agronomic tests, compare nutrient levels to regional recommendations. For contaminants, use health-based guidelines. Knowing whether a result is above or below an acceptable threshold is crucial. In all cases, ensure you or the agronomist know which test method the lab used, as units and interpretations can vary by method.

Common Errors to Avoid During Soil Sampling

According to field research in 2024, incorrect sampling depth and tool contamination are the two most common errors in soil sampling, together accounting for nearly 60% of test inaccuracies.

Avoiding these simple mistakes can greatly improve the reliability of lab results and prevent costly misinterpretation. Accurate sampling requires consistency and care. Be aware of these common mistakes:

  • Inconsistent depth: Taking some cores too shallow or too deep skews results. Always use your depth marker and train anyone helping you.
  • Dirty tools or containers: Contaminated tools can spoil the sample. Always clean them between sites.
  • Poor mixing: Failing to mix subsamples thoroughly means the sample isn’t representative.
  • Labeling mistakes: Unlabeled or mislabeled bags are useless. Label them immediately during collection.
  • Delays and storage: Letting samples sit in the sun or a hot car can alter pH or nitrogen levels.
  • Combining dissimilar areas: Don’t mix soil from different zones into one sample; keep zones separate for accurate data.

Avoiding these errors is mostly a matter of following protocol carefully. Training samplers and having a checklist ensures reliable data.

Role Of GeoPard In Soil Sampling Planning

GeoPard Agriculture provides advanced tools for precise soil sampling and analysis. It helps users plan sampling locations based on multi-year satellite imagery and historical crop performance, allowing sampling to target real in-field variability. GeoPard supports both zone-based sampling (using management zones defined by soil type, yield, or vegetation data) and grid-based sampling (typically 1 to 2.5-acre grids for uniform coverage).

After sampling, users can upload lab results directly into the platform. GeoPard visualizes each soil attribute—such as pH, nitrogen (N), phosphorus (P), potassium (K), organic matter, and cation exchange capacity (CEC)—as high-resolution heatmaps. This makes it easy to spot nutrient imbalances.

Users can overlay soil maps with other data layers (NDVI, topography, historic yield) to refine management zones. GeoPard also creates Variable Rate Application (VRA) prescription maps, allowing optimized fertilizer use by zone. These tools support better soil fertility decisions, reduce input costs, and improve yield potential.

Advanced Applications For Soil Sampling

By 2025, over 45% of large farms and agri-businesses are integrating soil test data with GPS and drone imagery for variable-rate applications. Time-series sampling, in combination with AI tools, is also being used to model fertility trends and climate impacts on soil health.

A. Precision Agriculture Integration

Soil sampling today is more high-tech than ever. In precision agriculture, GPS-guided samplers collect location-stamped cores. These georeferenced soil data feed variable-rate fertilizer equipment. For instance, software can use soil test maps to prescribe more fertilizer in low-nutrient zones and less where fertility is high. Modern tractors can apply lime or fertilizer at variable rates based on these soil test maps.

Precision Agriculture Integration Soil sampling

Technologies such as variable rate fertilizer applications and yield monitoring, though available since the 1990s, are seeing increasing adoption. In 2023, 27% of U.S. farms or ranches utilized precision agriculture practices, with adoption rates increasing sharply with farm size; for instance, 70% of large-scale crop-producing farms used guidance autosteering systems.

The benefits are substantial: farmers can reduce water and fertilizer use by at least 20-40% with no adverse impact on yields, and in some cases, even achieve increased yields. This translates to increased profits for farmers and significant environmental benefits, including reduced nutrient runoff and improved water quality, which are major factors contributing to water pollution and coastal dead zones.

Advanced soil mapping technologies like EarthOptics, for example, have mapped over five million acres of farmland and rangeland, providing high-resolution insights into soil compaction, moisture levels, and organic matter distribution. Their technologies aim to reduce customer costs by minimizing required sampling and unlocking new value from the soil, such as improved yields or verified carbon sequestration.

This integration of soil sampling with precision agriculture exemplifies how detailed, localized soil knowledge enables optimized interventions, moving beyond broad-brush approaches to achieve both productivity and environmental stewardship.

B. Time-Series And Regulatory Compliance

Some advanced operations repeat soil sampling annually or seasonally to build a time-series dataset. Tracking soil test trends over time reveals whether fertility is improving or declining. Most guidelines recommend baseline sampling every 3–4 years, but some intensive systems sample yearly to monitor changes.

Digital tools even allow farmers to overlay successive soil maps to see how fields evolve. For instance, if soil pH consistently falls to 5.5, nitrogen and potassium availability can drop to 77%, potentially reducing wheat yields by as much as 25%. Regular monitoring allows for timely corrective measures.

For regulatory compliance and research, soil sampling follows strict standards. Agencies like the EPA and ISO have detailed procedures that specify equipment, preservation, and quality control. In contaminated-site work, sampling plans often require duplicates, blanks, and chain-of-custody documentation. Being aware of relevant regulations and laboratory accreditation ensures the samples will be accepted in legal or certification contexts.

Finally, emerging science is expanding soil sampling’s role. Scientists sample soil more deeply to study carbon storage and greenhouse gas flux. Some sample microbial communities or enzyme activities as new “soil health” indicators. Others are exploring drone-mounted sensors that “sample” via spectral measurements. While these advanced topics go beyond basic sampling, the core principle remains: sound sampling yields reliable, actionable data.

Záver

Soil sampling is a powerful tool for sustainable land management. By carefully planning where and how to sample, using the right tools (soil augers, buckets, GPS), and following a consistent procedure, you obtain soil data you can trust. Key steps – collecting uniform-depth cores, compositing and mixing them, labeling properly, and keeping samples clean – ensure accuracy.

Equally important is matching the sampling strategy to your goal, whether that’s fertility mapping, pollution check, or building design. A goal-driven approach, with proper documentation (location, depth, date, chain-of-custody), makes the resulting soil analyses meaningful.

In turn, reliable soil data leads to better decisions: optimized fertilizer use, safer construction, and healthier ecosystems. By avoiding common pitfalls and embracing best practices, soil sampling becomes the foundation of effective soil management and productive land use.

Vytlačené pôdne senzory by mohli pomôcť farmárom zvýšiť výnosy plodín a znížiť náklady

Engineers at the University of Wisconsin–Madison have created affordable sensors to monitor soil nitrate levels in real-time for soil types common in Wisconsin. These printed electrochemical sensors can help farmers make smarter decisions about fertilization, potentially saving them money.

“Our sensors can give farmers a clearer picture of their soil’s nutrient levels and how much nitrate is available for crops. This information allows them to make precise decisions on how much fertilizer is needed,” says Joseph Andrews, a UW–Madison assistant professor of mechanical engineering and lead researcher. “Reducing fertilizer use could mean significant cost savings, especially for large farms.”

Nitrate is essential for crop growth, but too much of it can seep into groundwater, polluting drinking water and harming the environment. These new sensors can also serve as tools in agricultural research, tracking nitrate runoff and guiding better practices to reduce pollution.

Traditional methods to monitor soil nitrate are time-consuming, costly, and don’t offer immediate results. To address this, Andrews, an expert in printed electronics, and his team designed these sensors as a simpler and more economical alternative.

For this project, the researchers used an inkjet printing method to make potentiometric sensors, which are a kind of thin-film sensor that uses electrochemical reactions. These sensors are typically used to measure nitrate levels in liquid solutions accurately. However, they usually don’t work well in soil because rough soil particles can scratch the sensors and affect accurate readings.

Printed Soil Sensors shape and installation.jpg

Andrews explains, “Our main goal was to make these electrochemical sensors work effectively in challenging soil conditions and accurately detect nitrate ions.”

To solve this, the team added a protective layer over the sensor using a material called polyvinylidene fluoride. According to Andrews, this material has two important qualities. First, it has extremely small pores, around 400 nanometers, which let nitrate ions pass through but keep soil particles out. Second, it’s hydrophilic, meaning it attracts water like a sponge.

Andrews says, “This means any water containing nitrates will be absorbed by our sensor, which is crucial because soil also absorbs water. Without this, it would be hard for the sensor to get enough moisture, but since our material matches soil’s water absorption, it helps draw nitrate-rich water to the sensor’s surface for accurate readings.”

The researchers shared their progress in a paper published in March 2024 in Advanced Material Technologies.

Printed Soil Sensors working and testing

The team tested its sensors in two types of soil found in Wisconsin: sandy soil, which is common in the north-central area, and silt loam soil, which is found in southwestern Wisconsin. They found that the sensors gave accurate results in both types.

Now, the researchers are adding their nitrate sensors to a system they call a “sensing sticker.” This system combines three different sensors — for nitrates, moisture, and temperature — on a flexible plastic sheet with adhesive on the back.

They plan to place several of these sensing stickers on a rod at different heights, then bury the rod in the soil. This setup will allow them to measure conditions at different depths in the soil.

Andrews explains, “By measuring nitrate, moisture, and temperature at various soil depths, we can now track the process of nitrate leaching and observe how nitrate moves through the soil, something we couldn’t do before.”

In the summer of 2024, the researchers will continue testing their sensors by placing 30 sensor rods in the soil at UW–Madison’s Hancock and Arlington Agricultural Research Stations.

The team is working to patent this technology through the Wisconsin Alumni Research Foundation.

Co-authors from UW–Madison include Kuan-Yu Chen, Aatresha Biswas, Shuohao Cai, and Professor Jingyi Huang from the Soil Science Department.

This research was funded by the USDA Agriculture and Food Research Initiative Foundational Program (project no. WIS04075), the National Science Foundation’s Signals in the Soil grant 2226568, and the University of Wisconsin–Madison Dairy Innovation Hub.

Analytika založená na rovniciach v precíznom poľnohospodárstve

With the release of the Equation-based analytics module, the GeoPard team has taken a big step forward in empowering farmers, agronomists, and spatial data analysts with actionable insights for each square meter. The module includes a catalog of over 50 predefined GeoPard precision formulas that cover a wide range of agriculture-related analytics.

The precision formulas have been developed based on multi-year independent agronomic university and industry research and have been rigorously tested to ensure their accuracy and usefulness. They can be easily configured to be executed automatically for any field, providing users with powerful and reliable insights that can help them to optimize their crop yields and reduce input costs.

The Equation-based analytics module is a core feature of the GeoPard platform, providing users with a powerful tool to gain a deeper understanding of their operations and make data-driven decisions about their farming practices. With the ever-growing catalog of formulas and the ability to customize formulas for different field scenarios. The GeoPard can meet the specific needs of any farming operation.


Potassium Removal based on Yield data

Potassium Removal based on Yield data


Use Cases (see examples below):

  • Nitrogen Uptake in absolute numbers using Yield and Protein data
  • Nitrogen Use Efficiency (NUE) and Excess calculations with Yield and Protein data layers
  • Lime recommendations based on pH data from soil sampling or soil scanners
  • Sub-field (zones or pixel-level ROI maps)
  • Micro and Macro nutrients fertilization recommendations based on Soil sampling, Field Potential, Topography, and Yield data
  • Carbon modeling
  • Change detection and alerting (calculate difference between Sentinel-2, Landsat8-9 or Planet imagery)
  • Soil and grain moisture modeling
  • Calculation of dry yield out of wet yield datasets
  • Target Rx vs As-applied maps difference calculation


Potassium Recommendations based on Two Yield Targets (Productivity Zones)

Potassium Recommendations based on Two Yield Targets (Productivity Zones)


Fertilizer: Recommendations Guide. Potassium / Corn.

Fertilizer: Recommendations Guide (South Dakota State University): Potassium / Corn. Review and Revision: Jason Clark | Assistant Professor & SDSU Extension Soil Fertility Specialist


Potassium Use Efficiency in Kg/Ha

Potassium Use Efficiency in Kg/Ha


Nitrogen Use Efficiency in percentage. Calculation is based on Yield, Protein and Grain Moisture data layers

Nitrogen Use Efficiency in percentage. Calculation is based on Yield, Protein and Grain Moisture data layers


Nitrogen: Target Rx vs As-Applied

Nitrogen: Target Rx vs As-Applied


Chlorophyll difference between two satellite images

Chlorophyll difference between two satellite images


A user of GeoPard can adjust existing and create their private formulas based on Imagery, Soil, Yield, Topography, or any other data layers GeoPard supports. 

Examples of the template GeoPard Equations

Examples of the template GeoPard Equations


Formula-based analytics helps farmers, agronomists, and data scientists to automate their workflows and make decisions based on multiple data and scientific research to enable easier implementation of sustainable and precision agriculture.

What is Equation-based Analytics in Precision Agriculture? The Use of Precision Formula

Equation-based analytics in precision agriculture refers to the use of mathematical models, equations, precision formula, and algorithms to analyze agricultural data and derive insights that can help farmers make better decisions about crop management.

These analytics methods incorporate various factors such as weather conditions, soil properties, crop growth, and nutrient requirements to optimize agricultural practices and improve crop yields, while minimizing resource waste and environmental impact.

Some of the key components of equation-based analytics in precision agriculture include:

  • Crop growth models: These models describe the relationship between various factors such as weather, soil properties, and crop management practices, to predict crop growth and yield. Examples of such models include the CERES (Crop Environment Resource Synthesis) and APSIM (Agricultural Production Systems sIMulator) models. These models can help farmers make informed decisions about planting dates, crop varieties, and irrigation scheduling.
  • Soil water models: These models estimate the water content in the soil profile based on factors such as rainfall, evaporation, and crop water use. They can help farmers optimize irrigation practices, ensuring that water is applied efficiently and at the right time to maximize crop yields.
  • Nutrient management models: These models predict nutrient requirements for crops and help farmers determine the optimal rates and timing of fertilizer application. By using these models, farmers can ensure that crops receive the right amount of nutrients, while minimizing the risk of nutrient runoff and environmental pollution.
  • Pest and disease models: These models predict the likelihood of pest and disease outbreaks based on factors such as weather conditions, crop growth stages, and management practices. By using these models, farmers can make proactive decisions about pest and disease management, such as adjusting planting dates or applying pesticides at the right time.
  • Remote sensing-based models: These models use satellite imagery and other remote sensing data to monitor crop health, detect stress factors, and estimate yield. By integrating this information with other data sources, farmers can make better decisions about crop management and optimize resource use.

In summary, equation-based analytics in precision agriculture uses mathematical models and algorithms to analyze complex interactions between various factors that affect crop growth and management. By leveraging these analytics, farmers can make data-driven decisions to optimize agricultural practices, improve crop yields, and minimize environmental impact.


Často kladené otázky


1. How can precision agriculture help address resource use and pollution issues in agriculture?

It can help address resource use and pollution issues in agriculture through targeted resource application, efficient resource management, enhanced monitoring, and the adoption of conservation practices. By applying inputs such as fertilizers and pesticides only where needed, farmers can reduce waste and minimize pollution.

Data-driven decision-making enables optimal resource management, while real-time monitoring allows for timely interventions to prevent pollution incidents. Additionally, the implementation of conservation practices promotes sustainable agriculture and reduces environmental impacts.

Normalizovaný diferenciačný index vlhkosti

The number of vegetation indices supported by GeoPard is continuously growing. GeoPard team introduces the Normalized Difference Moisture Index (NDMI). The index determines vegetation water content and normalized difference water index (NDWI). It is useful for finding the spots with existing water stress in plants.

Lower NDMI values mark the spots where the plants are under stress from insufficient moisture.
On the other side, lower normalized difference water index values following the vegetation peak highlight the spots that are becoming ready for harvesting first.

The difference of the vegetation relative water content between two satellite images (Sentinel-2 constellation in this case)

The difference of the vegetation relative water content between two satellite images (Sentinel-2 constellation in this case)

In the following screenshots, you can find the NDMI zones generated based on June 19 (vegetation peak) and July 6 satellite images and the equation map representing the NDMI difference.

Normalized Difference Moisture Index calculated on top of Planet / Sentinel-2 / Landsat imageNDMI calculated on top of Planet / Sentinel-2 / Landsat image

What is Moisture Index?

It is a measure or calculation used to assess the moisture content or availability in a specific area or region. It is typically derived from various environmental factors such as precipitation, evapotranspiration, soil properties, and vegetation cover.

It provides a relative indication of the wetness or dryness of an area, helping to identify potential water stress or drought conditions.

It is a valuable tool for monitoring and managing water resources, agricultural planning, and understanding the ecological conditions of a particular region.

What is Normalized Difference Moisture Index?

Normalized Difference Moisture Index (NDMI) is a vegetation index derived from remote sensing data to assess and monitor the moisture content of vegetation. Like other vegetation indices, it is computed using spectral reflectance values from satellite or aerial imagery.

It is particularly useful in monitoring plant water stress, assessing drought conditions, estimating fire risk, and studying the impacts of climate change on vegetation.

It is calculated using the Near-Infrared (NIR) and Shortwave Infrared (SWIR) bands, which are sensitive to the moisture content in vegetation. The formula for NDMI is:

NDMI = (NIR – SWIR) / (NIR + SWIR)

NDWI values typically range from -1 to 1, with higher values indicating higher vegetation moisture content and lower values indicating lower moisture content or water stress in the vegetation. Negative NDMI values can be associated with non-vegetated areas or areas with very low moisture content.

What is NDWI?

NDWI, or Normalized Difference Water Index, is a remote sensing index used to quantify and assess water content or water-related features in vegetation or landscapes.

It is calculated by analyzing the reflectance of near-infrared and green light bands from satellite or aerial imagery. It is particularly useful for identifying water bodies, monitoring changes in water availability, and assessing vegetation health.

By comparing the absorption and reflection of different wavelengths, it provides valuable information for applications such as drought monitoring, hydrological analysis, and ecosystem management.

Visualization of NDMI to Determine Normalized Difference Water Index

Visualizing the NDMI involves processing satellite or aerial imagery, calculating the NDMI values, and then displaying the results as a color-coded map or image. Here are the general steps to visualize NDMI:

  • Acquire satellite or aerial imagery: Obtain multispectral imagery from a satellite or aerial platform, such as Landsat, Sentinel, or MODIS. Ensure that the imagery includes the necessary bands: Near-Infrared (NIR) and Shortwave Infrared (SWIR).
  • Pre-process the imagery: Depending on the data source, you may need to preprocess the imagery to correct for atmospheric, geometric, and radiometric distortions. Convert the digital numbers (DN) in the image to spectral reflectance values.
  • Calculate NDMI: For each pixel in the image, use the NIR and SWIR reflectance values to compute the NDMI using the formula: NDMI = (NIR – SWIR) / (NIR + SWIR).
  • Color mapping: Assign a color palette to the NDMI values. Typically, a continuous color scale is used, ranging from one color (e.g., red) for low NDMI values (indicating low moisture content) to another color (e.g., green) for high NDMI values (indicating high moisture content). You can use software like QGIS, ArcGIS, or programming libraries like Python’s Rasterio and Matplotlib to create a color map.
  • Visualize the NDMI map: Display the NDMI map or image using GIS software, a programming library, or an online platform. This will allow you to analyze the spatial distribution of vegetation moisture content and identify areas of water stress or high moisture.
  • Interpretation and analysis: Use the NDWI visualization to assess vegetation health, monitor drought conditions, or evaluate fire risk. You can also compare normalized difference water index maps from different time periods to analyze changes in vegetation moisture content over time.

Remember that different software tools or programming libraries may have slightly different workflows, but the overall process will be similar. Additionally, you can overlay other data layers, such as land use, elevation, or administrative boundaries, to enhance your analysis and better understand the relationships between vegetation moisture content and other factors. 

wpChatIcon
wpChatIcon

    Požiadať o bezplatné GeoPard Demo / Konzultáciu


    Kliknutím na tlačidlo súhlasíte s našimi Zásady ochrany osobných údajov. Potrebujeme to na zodpovedanie vašej žiadosti.

      Prihlásiť sa na


      Kliknutím na tlačidlo súhlasíte s našimi Zásady ochrany osobných údajov

        Pošlite nám informácie


        Kliknutím na tlačidlo súhlasíte s našimi Zásady ochrany osobných údajov