Turn Q1 Field Data Into Action: A Step-by-Step Guide to Smarter Agronomic Decisions
Q1 data analytics can reveal hidden patterns in your fields that too often go unnoticed. You’ve already collected yield maps, soil sampling data, and satellite imagery—now it’s time to turn all that into actionable agronomic decision-making. This guide shows you how to refresh management zones, build precise VRA prescriptions, and plan in-season strategies using GeoPard’s AI-powered analytics, so you can make smarter, data-backed choices all season long. For more insights, check this link.
Leveraging Q1 Data Analytics

Digging into Q1 data can feel overwhelming, but it holds the key to smarter farming. As you sift through the numbers, clearer pictures of your fields emerge.
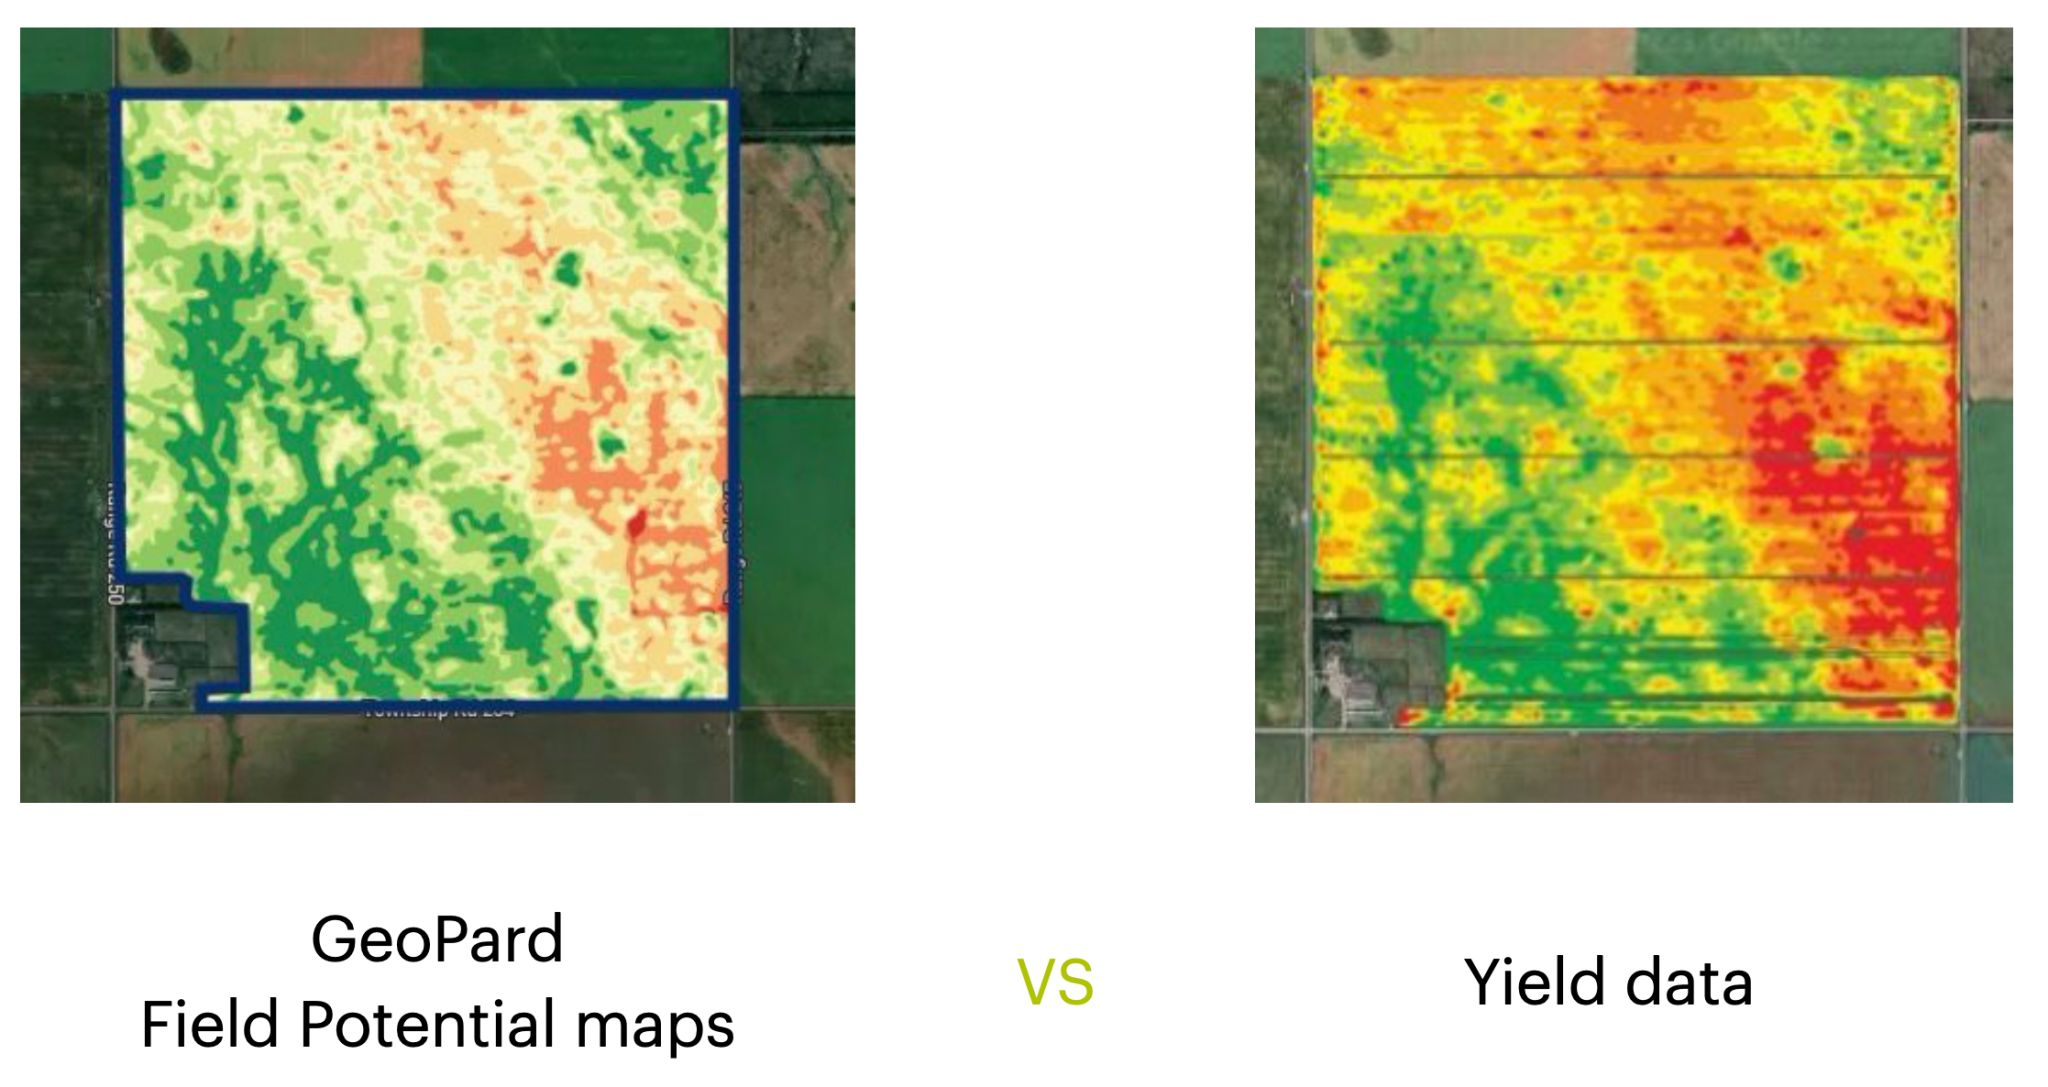
Refreshing Management Zones
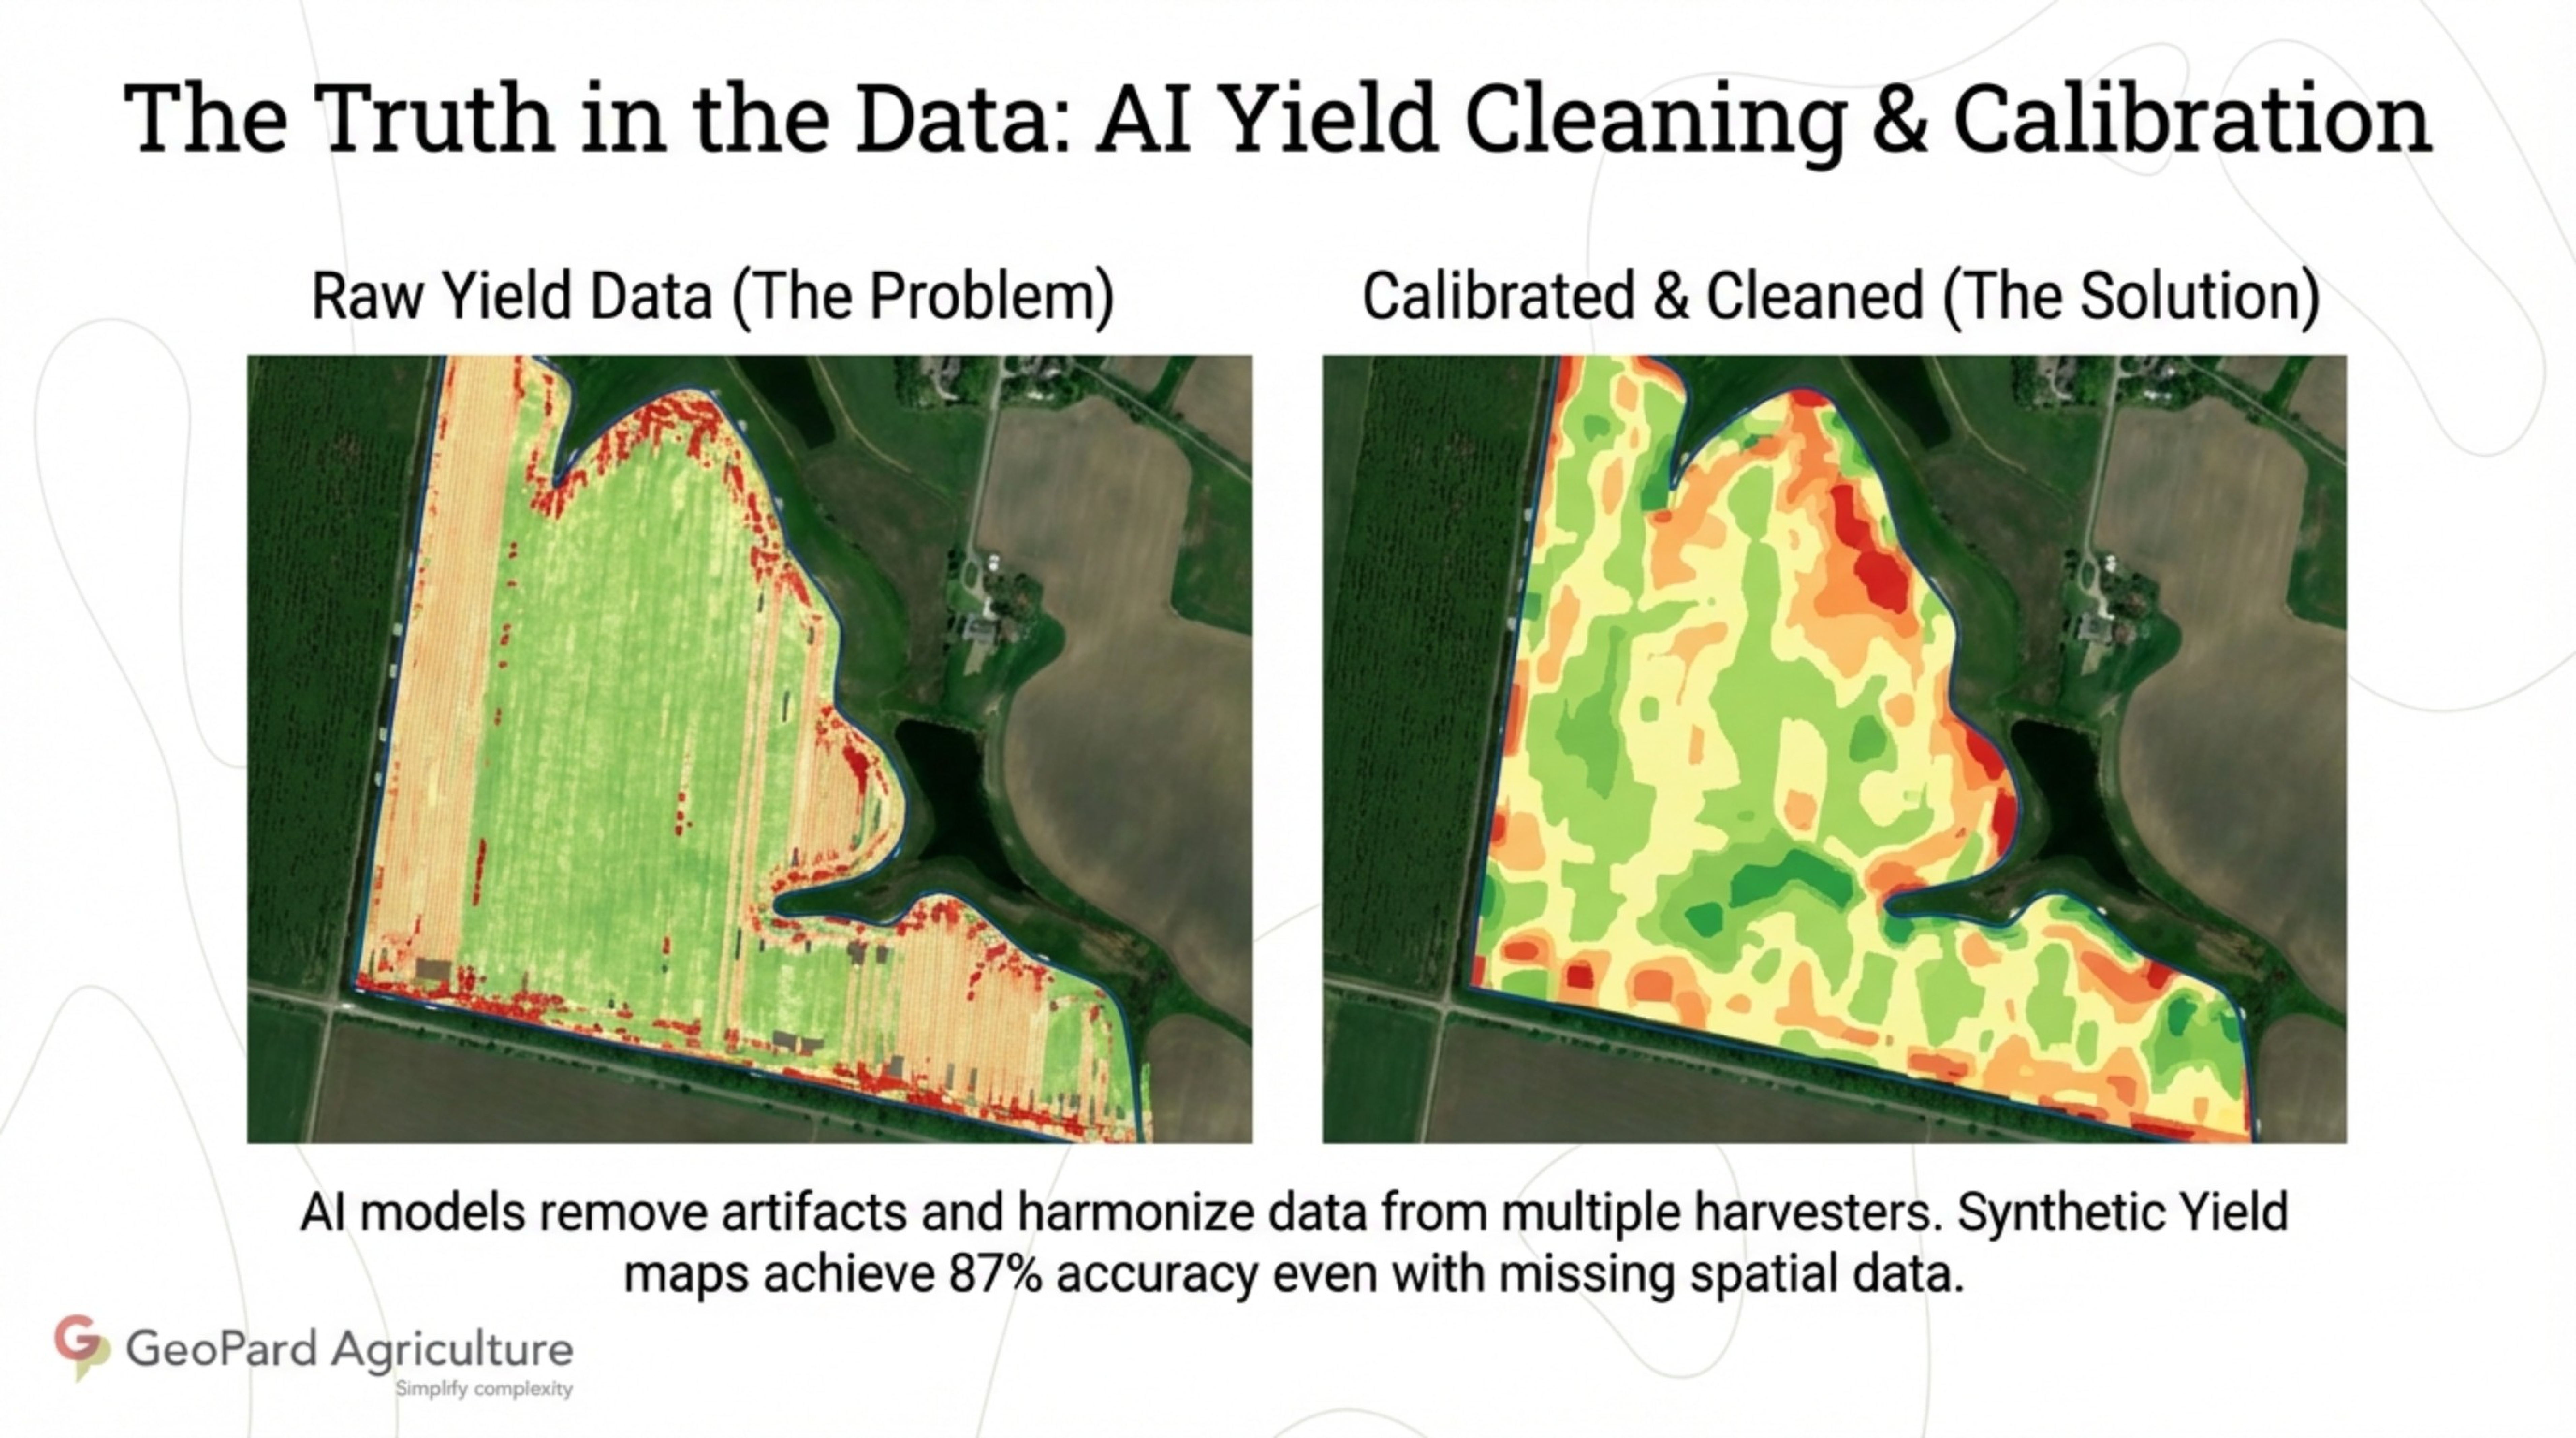
Start by refining your zonas de gestão. This allows you to target specific areas with the right inputs. Use yield maps e dados do solo to identify zones. With tools like GeoPard, you can create dynamic maps that reflect the real-time needs of your land. This approach not only saves time but also boosts productivity.
For example, a farmer noticed low yields in a specific zone. By analyzing Q1 data, he adjusted his inputs, leading to a 15% increase in production the following season. The takeaway? Refreshing zones isn’t just a task—it’s a game-changer.
Building VRA Prescriptions
Next, focus on creating VRA prescriptions. Variable Rate Application means applying the right amount of inputs at the right time. It’s precision at its finest. To build effective VRA maps, combine data from yield maps, soil tests, and historical imagery. This lets you fine-tune input levels across different areas.
Imagine you’re planting corn. Instead of a blanket approach, VRA allows you to apply more fertilizer where the soil needs it and less where it doesn’t. This precision can lead to reduced waste and improved crop health.
Planning In-Season Strategies
Finally, plan your in-season strategies with confidence. GeoPard’s analytics provide insights for every growth stage. Use this data to decide when to irrigate, fertilize, or apply pesticides. Adjust your approach based on real-time field conditions.
Consider the impact: a 10% increase in efficiency by simply timing your actions better. Planning isn’t about guessing; it’s about informed decisions that lead to better yields.
Tools for Agronomic Decision-Making

Understanding the tools at your disposal is crucial. They transform raw data into actionable insights, helping you make informed decisions every step of the way.
AI-Powered Analytics Benefits
AI-powered analytics can revolutionize how you approach farming. These tools process complex datasets quickly, revealing patterns you might miss. They help predict outcomes and suggest the best actions to take.
Think about it: most people believe intuition is enough, but data-driven insights are the future. Embrace this technology to stay ahead in the game. The longer you wait, the more opportunities you might miss.
Integrando o Centro de Operações da John Deere
Integrating systems like the Centro de Operações John Deere makes managing your data seamless. This platform syncs with GeoPard, allowing for smooth data flow. It’s like having all your tools in one toolbox, ready for action.
For instance, you can easily transfer data between your machines and software, saving time and reducing errors. Integration not only simplifies operations but also enhances data accuracy, leading to better decision-making.
Utilizing Yield and Soil Data
Yield and soil data are foundational to effective management. By utilizing them, you get a clear picture of what’s happening under the surface. Use these insights to tweak your strategies and improve outcomes.
For example, by analyzing soil data, you can adjust nutrient applications, ensuring your crops get what they need to thrive. It’s all about making data work for you.
Optimizing Crop Management Practices

With data in hand, it’s time to refine your crop management practices. These strategies ensure your fields reach their full potential.
Monitoring with Satellite Imagery
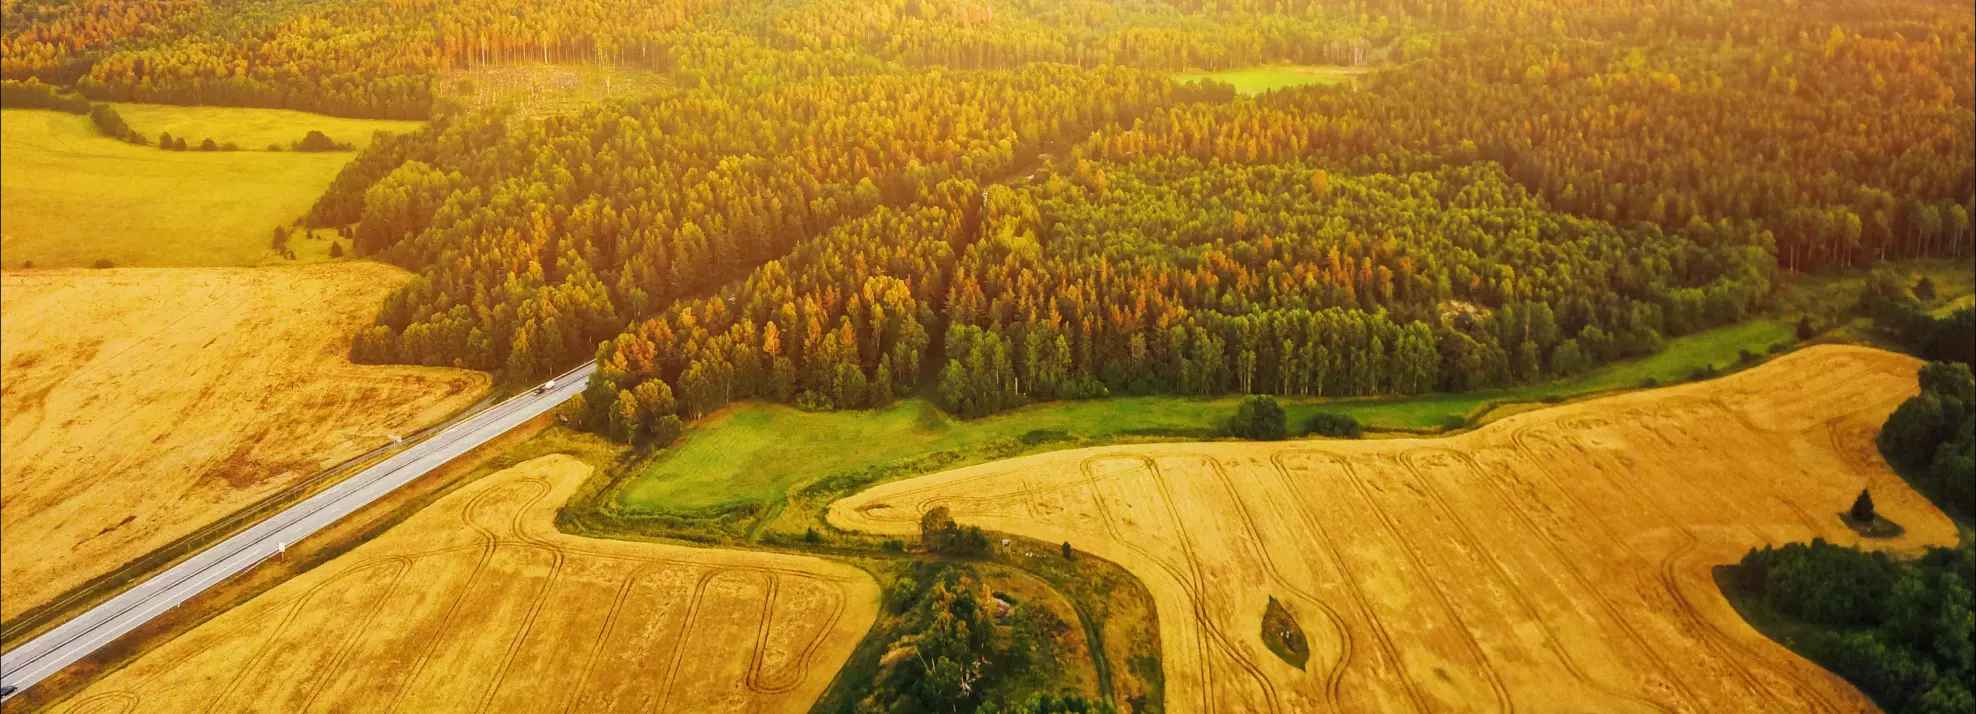
Satellite imagery offers a bird’s-eye view of your fields, revealing patterns invisible from the ground. Regular monitoring helps spot issues like pest infestations or water stress early, allowing timely interventions.
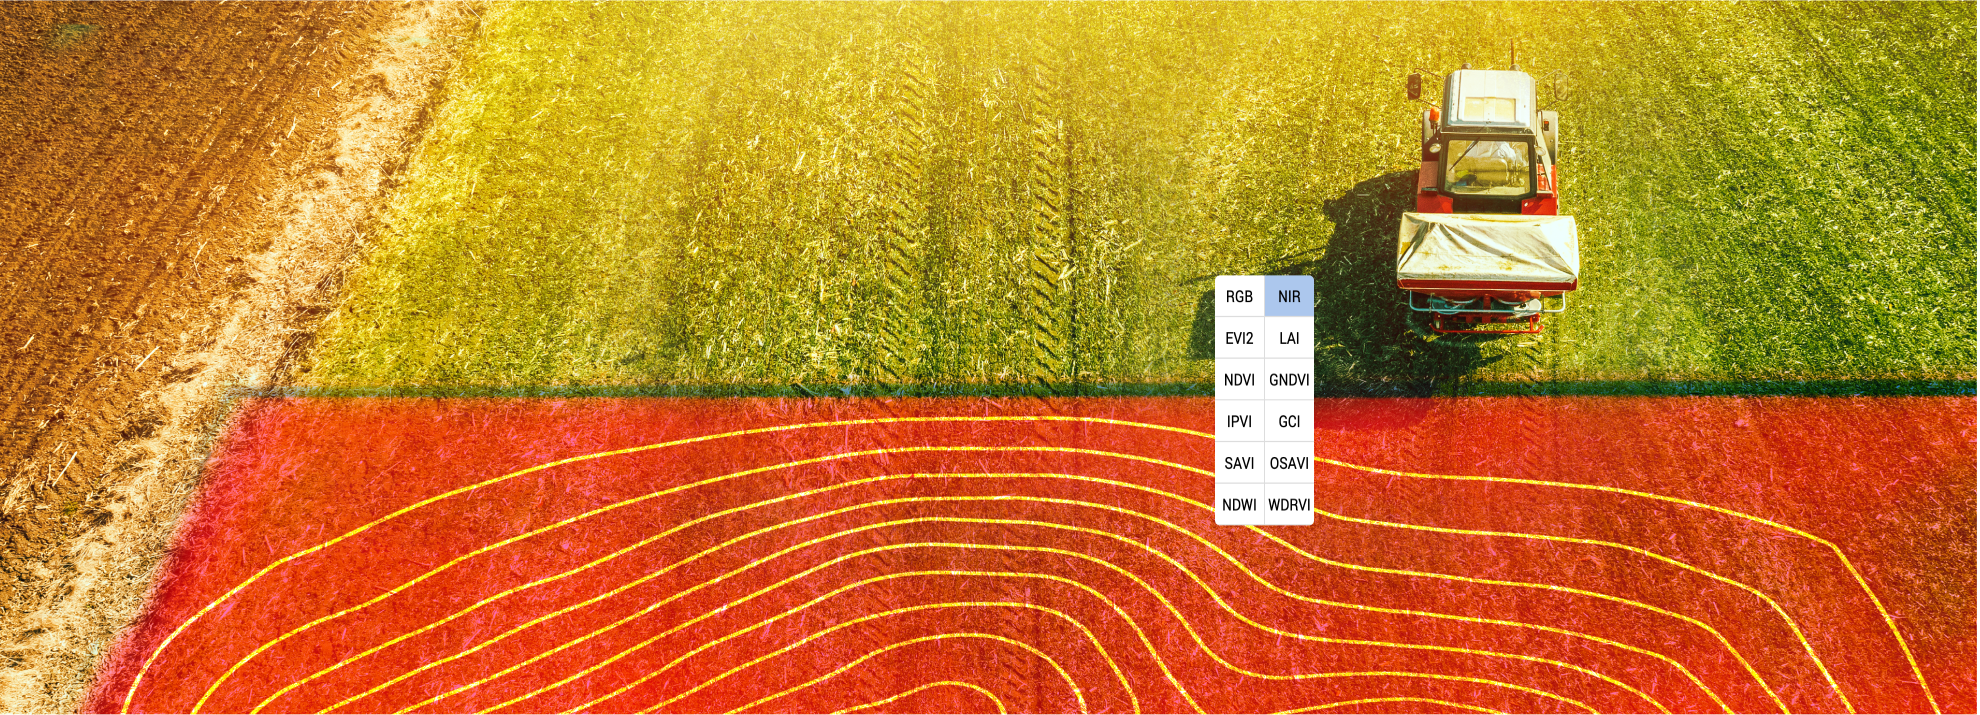
Consider using NDVI and biomass indices. These metrics provide insights into crop health and vigor, guiding your management decisions. With images updated every few days, you’ll always have the latest data at your fingertips.
Nitrogen and Seeding Rate Strategies
Optimizing nitrogen and seeding rates is vital for maximizing yields. By analyzing data, you can tailor these rates to specific field conditions, ensuring optimal growth.
For example, a farmer adjusted seeding rates based on soil fertility, resulting in a balanced crop stand and improved yields. It’s not about applying more; it’s about applying smartly.
Conducting ROI Analysis in Agriculture
Finally, conduct regular ROI analysis to ensure your practices are cost-effective. Use tools to evaluate the financial impact of your decisions, helping you allocate resources wisely.
For instance, you might discover that a small change in practice leads to significant cost savings. ROI analysis isn’t just about profit; it’s about making your operations sustainable and efficient.
With these insights and tools, you’re equipped to transform your farming practices. Use data as your guide, and watch your productivity soar. For more detailed studies, you can refer to this resource.
Reflect on the quarter’s precision ag insights and prepare to adopt smarter strategies.