Chlorophyll Index In Agriculture

The relentless pursuit of increased yield, optimized resource use, and sustainable practices defines modern agriculture. Amidst this quest, a powerful, yet often unseen, ally has emerged: the Chlorophyll Index (CI). This sophisticated vegetation index, derived from the subtle language of light reflected by plants, provides an unprecedented window into the very engine of plant growth – chlorophyll content.

As we navigate an era demanding precision and environmental responsibility, understanding and harnessing the Chlorophyll Index is no longer a niche advantage but a fundamental tool for progressive farming, agribusiness, and environmental stewardship.

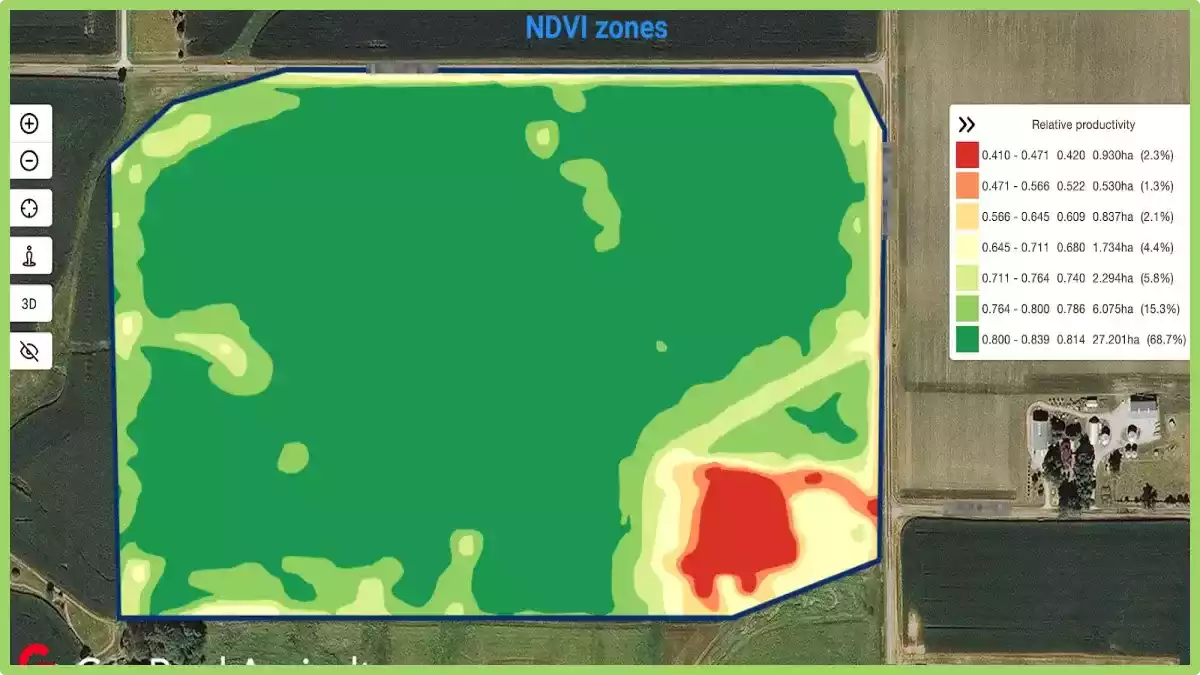
The latest statistics underscore that farms adopting CI-guided management consistently report input savings of 10-25%, water use reductions of 15-30%, and yield increases of 5-15% through optimized health and reduced losses. The Chlorophyll Index is not just a tool for observing plant health; it is a catalyst for cultivating a more sustainable agricultural future.

What is Chlorophyll Index?

The chlorophyll index (CI) is applied to calculate the total amount of chlorophyll in plants. To grasp the profound significance of the Chlorophyll Index, we must first appreciate its subject: chlorophyll itself. Chlorophyll is the vital green pigment residing within plant chloroplasts. It acts as nature’s solar panel, capturing light energy from the sun.

This captured energy fuels photosynthesis, the miraculous biochemical process where carbon dioxide and water are transformed into life-sustaining sugars and oxygen. Essentially, chlorophyll is the cornerstone of plant growth and productivity.

Its concentration within plant leaves is directly and dynamically linked to the plant’s health, nutritional status, photosynthetic efficiency, and ultimately, its yield potential. Traditionally, assessing chlorophyll meant labor-intensive, destructive lab tests on leaf samples – a process too slow and sparse for effective field-scale management. This is where remote sensing and the Chlorophyll Index revolutionize the game.

Plants interact uniquely with sunlight. While chlorophyll strongly absorbs light in the blue and red regions of the spectrum for photosynthesis, it reflects a significant portion of near-infrared (NIR) light and shows characteristic responses in the green and “red-edge” regions.

The Chlorophyll Index capitalizes on these specific reflectance patterns. By measuring the ratio of reflectance in carefully selected spectral bands using sensors mounted on satellites, drones, aircraft, or ground equipment, the CI provides a reliable, non-invasive, and scalable estimate of the actual chlorophyll concentration within the plant canopy.

What is Chlorophyll Index?

In essence, it translates the plant’s optical fingerprint into a quantifiable measure of its internal health and metabolic activity. The implications for agriculture are immense. The Chlorophyll Index acts as a real-time diagnostic tool, offering insights far beyond what the naked eye can perceive.

A declining CI can signal the onset of nutrient deficiency, particularly nitrogen – the building block of chlorophyll molecules – days or even weeks before visual symptoms like yellowing (chlorosis) appear. It can reveal water stress impacting photosynthetic machinery, detect early stages of disease altering plant metabolism, and indicate overall plant vigor.

Interpreted correctly, this continuous stream of data empowers farmers and agronomists to make proactive, targeted decisions. Rather than treating entire fields uniformly based on averages or delayed observations, interventions can be precisely tailored to the specific needs of different zones within a field.

This shift from reactive to predictive management is the essence of precision agriculture, and the Chlorophyll Index is a key enabler. The applications extend far beyond the farm gate. Input suppliers leverage CI data to demonstrate the efficacy of their fertilizers or crop protection products in real-world conditions, moving beyond controlled trial plots.

Insurance companies increasingly utilize CI-derived yield predictions for risk assessment and to structure parametric insurance products, where payouts are triggered by objective, satellite-verified indices of crop stress rather than subjective loss assessments.

Agricultural cooperatives managing thousands of hectares use CI maps to coordinate fertilizer application plans efficiently across vast geographies. Environmental agencies monitor the impact of agricultural practices on ecosystem health by tracking chlorophyll levels as a proxy for plant stress and potential nutrient runoff.

The versatility and objectivity of the Chlorophyll Index make it a cornerstone technology across the agricultural value chain and environmental monitoring.

Key Chlorophyll Index Spectrums

The term “Chlorophyll Index” encompasses several specific formulations, each fine-tuned to extract chlorophyll information under varying conditions and with different sensor capabilities. Understanding these variants is crucial for selecting the right tool for the job.

1. Green Chlorophyll Index (CIgreen or GCI)

The Green Chlorophyll Index (CIgreen or GCI) is renowned for its broad applicability across diverse plant species. Its strength lies in leveraging the green reflectance peak exhibited by healthy vegetation.

As chlorophyll concentration increases, absorption in the red and blue increases, but reflectance in the green band (around 550 nm) remains relatively stable or increases slightly, while NIR reflectance (around 730-850 nm) consistently rises due to the scattering effect of healthy leaf cell structures. The GCI formula capitalizes on this relationship:

CIgreen = (ρNIR / ρgreen) – 1.

Commonly, bands like 730 nm for NIR and 530-550 nm for green are used, resulting in CIgreen = (ρ730 / ρ530) – 1. A higher CIgreen value directly correlates with higher chlorophyll content. Its robustness across species makes it a widely adopted general-purpose chlorophyll indicator in precision agriculture platforms.

Key Chlorophyll Index Spectrums

2. Red-Edge Chlorophyll Index (CIred-edge or RCI)

The Red-Edge Chlorophyll Index (CIred-edge or RCI) exploits a critical spectral region known as the “red edge.” This is the sharp transition zone between the strong red light absorption by chlorophyll (around 670-680 nm) and the high reflectance in the NIR (beyond 700 nm) caused by leaf scattering.

The exact position and slope of this red-edge shift are highly sensitive to chlorophyll concentration. As chlorophyll increases, the red edge shifts towards longer wavelengths.

The RCI specifically uses a narrow band positioned within this dynamic red-edge region (typically around 700-750 nm, often 730 nm) and compares it to a NIR band (often 780-850 nm, commonly 850 nm):

CIred-edge = (ρNIR / ρred-edge) – 1, or specifically CIred-edge = (ρ850 / ρ730) – 1.

This index is exceptionally sensitive to moderate-to-high chlorophyll levels and is less prone to saturation effects compared to indices like NDVI when canopies are dense and lush.

This makes the RCI particularly valuable later in the season or for crops with high biomass, where other indices lose sensitivity. Its precision makes it ideal for generating highly accurate Vegetation Index maps used in Variable Rate Application (VRA) of nutrients, especially nitrogen.

3. MERIS Terrestrial Chlorophyll Index (MTCI)

The MERIS Terrestrial Chlorophyll Index (MTCI) was originally developed for data from the MERIS (Medium Resolution Imaging Spectrometer) sensor on the Envisat satellite. It utilizes three very specific bands: one in the red absorption trough (681.25 nm), one in the red-edge region (708.75 nm), and one in the NIR plateau (753.75 nm). Its formula is:

MTCI = (ρ754 – ρ709) / (ρ709 – ρ681).

The MTCI is explicitly designed to be sensitive to high chlorophyll concentrations, a range where indices like NDVI typically saturate and become unresponsive. It effectively stretches the chlorophyll sensitivity range upwards.

While sensor-specific in origin, the concept and band positions inform the use of similar three-band approaches with modern hyperspectral sensors. Its relative simplicity and effectiveness at detecting subtle variations in high-chlorophyll canopies justify its continued relevance and adaptation in precision agriculture analytics.

4. Modified Chlorophyll Absorption in Reflectance Index (MCARI)

The Modified Chlorophyll Absorption in Reflectance Index (MCARI) takes a different approach, specifically designed to minimize the confounding influence of non-photosynthetic background materials like soil, senescing vegetation, or residue, while still being sensitive to chlorophyll. Its formula is:

MCARI = [(ρ850 – ρ710) – 0.2 * (ρ850 – ρ570)] * (ρ850 / ρ710).

This complexity serves a purpose. The term (ρ850 – ρ710) captures the contrast between NIR and red-edge reflectance, sensitive to chlorophyll. The subtraction 0.2 * (ρ850 – ρ570) helps correct for variations in background brightness and some atmospheric effects (using the green band at 570 nm).

The final ratio (ρ850 / ρ710) further normalizes the signal. MCARI excels in situations with incomplete canopy cover (low Leaf Area Index – LAI) or where soil is highly visible, such as early growth stages or orchards/vineyards.

However, its sensitivity to background means it often performs best when combined with other indices like NDVI or directly measured LAI data to isolate the true chlorophyll signal from the background noise, leading to more robust plant health assessments, especially in heterogeneous fields.

Practical Applications of Chlorophyll Index

The true power of the Chlorophyll Index is realized in its practical implementation across diverse agricultural scenarios. Its ability to provide spatially explicit, timely data on plant physiological status unlocks numerous applications:

Precision Nitrogen Management

Nitrogen is intrinsically linked to chlorophyll synthesis. CI maps, particularly CIred-edge and MTCI, are highly correlated with plant nitrogen status. This allows for precise Variable Rate Application (VRA) of nitrogen fertilizer.

Instead of uniform spreading, applicators adjust rates in real-time based on CI maps, applying more where chlorophyll (and hence N) is deficient and less where it is sufficient. A 2023 study published in Precision Agriculture demonstrated that CI-guided VRA reduced nitrogen use by 15-25% while maintaining or even increasing yields compared to conventional practices across corn fields in the US Midwest.

This translates to significant cost savings for farmers (estimated $15-$40 per acre) and substantially reduces the risk of nitrogen leaching into groundwater or contributing to greenhouse gas emissions like nitrous oxide. The European Union’s Farm to Fork strategy, aiming for a 20% reduction in fertilizer use by 2030, explicitly promotes such precision nutrient management tools.

Practical Applications of Chlorophyll Index

Early Stress Detection and Diagnosis

Chlorophyll degradation is a common early response to various abiotic and biotic stresses. Water stress, salinity, micronutrient deficiencies (like magnesium, which is central to the chlorophyll molecule), pest infestation, and disease infection all impact chlorophyll concentration long before visible symptoms manifest.

Regular CI monitoring acts as an early warning system. For instance, a sudden localized drop in CI within a field could indicate a developing pest hotspot or a soil compaction issue limiting water uptake.

A 2024 report by the World Resources Institute highlighted that CI-based early detection systems used in Indian wheat belts helped reduce yield losses from unexpected heat stress by enabling preemptive irrigation adjustments, safeguarding an estimated 2 million tons of grain. This proactive approach minimizes crop damage and allows for more effective and targeted remediation strategies.

Yield Prediction and Harvest Planning

Seasonal chlorophyll dynamics, especially during critical growth stages like flowering and grain filling, are strong predictors of final yield. By building models that correlate historical CI patterns with actual harvested yields, and integrating current season CI data with weather forecasts, highly accurate yield predictions can be generated weeks or even months before harvest.

A consortium of major grain traders reported in early 2024 that incorporating high-resolution CIred-edge data from satellites and drones improved their regional soybean yield forecasts in Brazil by an average of 7% accuracy compared to traditional methods.

This level of predictability is invaluable for supply chain management, commodity trading, food security planning, and informing policy decisions. Farmers gain leverage in negotiating forward contracts and optimizing harvest logistics.

Optimizing Input Efficiency and Sustainability

Beyond nitrogen, CI maps inform the efficient use of other inputs. By identifying zones of optimal health (high, stable CI) versus stress (declining or low CI), farmers can prioritize pesticide or fungicide applications only where truly needed, reducing chemical usage and associated costs and environmental impacts.

Irrigation scheduling can also be refined; zones showing early signs of water stress via CI can receive targeted watering, improving water use efficiency – a critical factor as agricultural water demand intensifies globally.

The Food and Agriculture Organization (FAO) estimates that precision agriculture technologies, including vegetation indices like CI, can improve water use efficiency by 20-30% in irrigated systems. Furthermore, by maximizing yield per unit of input, CI-guided management inherently reduces the carbon footprint of crop production.

Breeding and Research Applications

Plant breeders leverage high-throughput phenotyping using CI derived from drones or ground sensors to rapidly screen thousands of plant lines for chlorophyll retention under stress (drought, heat, nutrient limitation), photosynthetic efficiency, and overall vigor.

This accelerates the development of more resilient and productive crop varieties. Agronomists use CI to objectively evaluate the performance of different management practices, seed treatments, or new products across trial plots and commercial fields, providing data-driven recommendations.

Overcoming Challenges To Transform Agricultural Landscape

While powerful, the effective use of Chlorophyll Indices requires careful consideration. Sensor choice is paramount. While multispectral sensors (capturing broad bands like green, red, red-edge, NIR) are common and cost-effective, hyperspectral sensors (capturing hundreds of narrow contiguous bands) offer the highest precision for chlorophyll retrieval but at greater cost and complexity.

Calibration and atmospheric correction of raw sensor data are essential to ensure accurate reflectance values before CI calculation. Cloud cover remains a limitation for satellite-based monitoring, though constellations offering frequent revisits (daily or better) and drone deployments mitigate this.

Interpreting CI maps requires agronomic knowledge. A low CI value could indicate nitrogen deficiency, water stress, disease, or simply an early growth stage. Integrating CI data with other sources – soil maps, weather data, topographic information, scouting reports, and other vegetation indices like NDVI (for structure) or NDRE (another red-edge index) – provides the context needed for accurate diagnosis.

Artificial Intelligence (AI) and machine learning are playing an increasingly vital role here, analyzing vast, multi-layered datasets to provide farmers with clear, actionable recommendations rather than just complex maps.

The future trajectory of the Chlorophyll Index is incredibly promising. Integration with real-time, on-the-go sensor systems mounted on tractors or sprayers is enabling true dynamic VRA, adjusting input rates instantly based on the CI reading directly in front of the machinery.

The fusion of satellite, drone, and ground sensor data is creating multi-scale monitoring systems offering both broad coverage and field-level detail. Advances in sensor technology, particularly miniaturized hyperspectral sensors for drones, are making high-fidelity chlorophyll mapping more accessible.

AI-driven analytics platforms are transforming raw CI data into intuitive dashboards and automated alerts, democratizing access to this powerful information for farmers of all scales.

Conclusão

The Chlorophyll Index represents far more than a technical metric; it embodies a fundamental shift in how we understand and manage agricultural ecosystems. By tapping into the “green pulse” of plants – their chlorophyll content – we gain an objective, quantifiable, and spatially explicit measure of their health and productivity.

From enabling precision nitrogen management that boosts efficiency and protects water resources, to providing early warnings of stress that save crops and inputs, to generating accurate yield forecasts that stabilize markets, the applications are transforming the agricultural landscape.

Índices de vegetação e conteúdo de clorofila

GeoPard extends the family of supported chlorophyll-linked vegetation indices with

  • Canopy Chlorophyll Content Index (CCCI)
  • Modified Chlorophyll Absorption Ratio Index (MCARI)
  • Transformed Chlorophyll Absorption in Reflectance Index (TCARI)
  • ratio MCARI/OSAVI
  • ratio TCARI/OSAVI

They help to understand the current crop development stage including

  • identification of the areas with nutrient demand,
  • estimation of the nitrogen removal,
  • potential yield evaluation,

And the insights are used for precise Nitrogen Variable Rate Application maps creation.


Read More: Which index is the best to use in the precisionAg

Read More: GeoPard vegetation indices


Índices de vegetação e conteúdo de clorofila
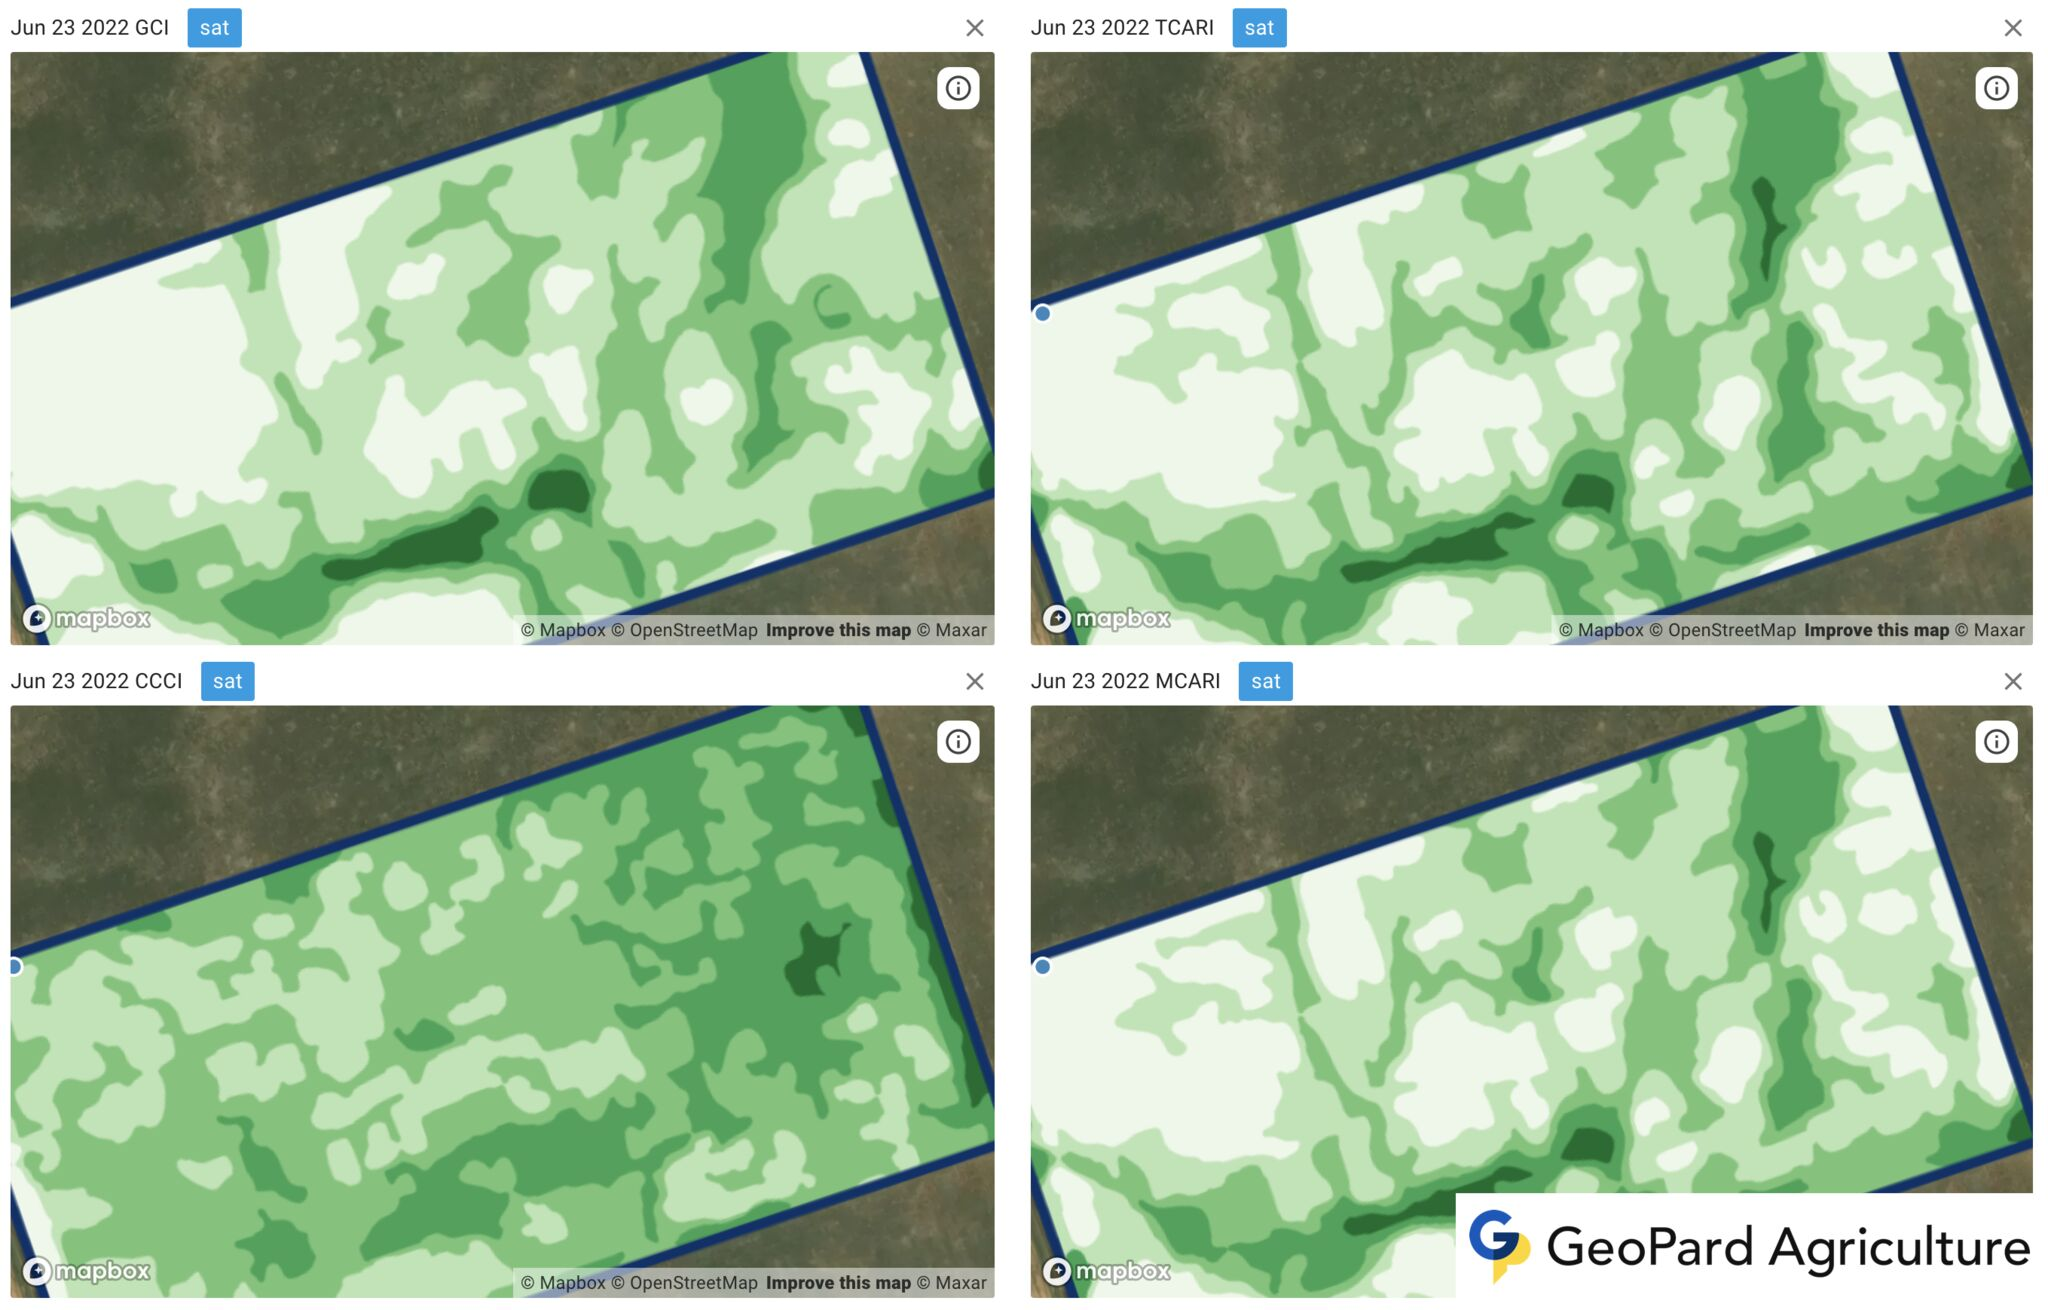
Canopy Chlorophyll Content Index (CCCI) vs Modified Chlorophyll Absorption Ratio Index (MCARI) vs Transformed Chlorophyll Absorption in Reflectance Index (TCARI) vs Ratio MCARI/OSAVI

What is Vegetation Indices?

Vegetation indices are numerical values derived from remotely sensed spectral data, such as satellite or aerial imagery, to quantify the density, health, and distribution of plant life on the Earth’s surface.

They are commonly used in remote sensing, agriculture, environmental monitoring, and land management applications to assess and monitor vegetation growth, productivity, and health.

These indices are calculated using the reflectance values of different wavelengths of light, particularly in the red, near-infrared (NIR), and sometimes other bands.

The reflectance properties of vegetation vary with different wavelengths of light, allowing for the differentiation between vegetation and other land cover types.

Vegetation typically has strong absorption in the red region and high reflectance in the NIR region due to chlorophyll and cell structure characteristics.

Some widely used vegetation indices include:

  • Normalized Difference Vegetation Index (NDVI): It is the most popular and widely used vegetation index, calculated as (NIR – Red) / (NIR + Red). NDVI values range from -1 to 1, with higher values indicating healthier and denser vegetation.
  • Enhanced Vegetation Index (EVI): This index improves upon NDVI by reducing atmospheric and soil noise, as well as correcting for canopy background signals. It uses additional bands, such as blue, and incorporates coefficients to minimize these effects.
  • Soil-Adjusted Vegetation Index (SAVI): SAVI is designed to minimize the influence of soil brightness on the vegetation index. It introduces a soil brightness correction factor, enabling more accurate vegetation assessments in areas with sparse or low vegetation cover.
  • Green-Red Vegetation Index (GRVI): GRVI is another simple ratio index that uses the green and red bands to assess vegetation health. It is calculated as (Green – Red) / (Green + Red).

These indices, among others, are used by researchers, land managers, and policymakers to make informed decisions regarding land use, agriculture, forestry, natural resource management, and environmental monitoring.

O Índice de Vegetação por Diferença Normalizada (NDVI) facilita a vida do agricultor

O Índice de Vegetação por Diferença Normalizada (NDVI) é uma métrica comumente usada para quantificar a densidade e a saúde da vegetação. Seus valores variam de -1 a 1, com valores negativos indicando água ou solo descoberto, valores próximos de zero indicando vegetação esparsa e valores mais altos indicando vegetação mais densa e saudável.

O que é o Índice de Vegetação por Diferença Normalizada (NDVI)?

É um método que calcula a variação entre a quantidade de luz vermelha recebida pela vegetação e a quantidade de luz infravermelha próxima que é fortemente refletida pela vegetação.

O objetivo desse método é fornecer uma análise quantitativa do estado da vida vegetal. Não há nenhuma situação em que seu valor esteja fora do espectro de -1 a +1. No entanto, não há uma demarcação clara entre os vários tipos de cobertura da terra que podem ser encontrados.

Se a soma dos números for menor que zero, é bem provável que a substância em questão seja água. Se você obtiver uma pontuação NDVI muito próxima de um valor positivo, há uma boa chance de que seja apenas um monte de folhas verdes bem compactadas. Isso é especialmente verdadeiro se as folhas estiverem densamente agrupadas.

As folhas verdes têm um valor maior do que as vermelhas, e é por isso que esse é o caso. Imagine por um momento que o it esteja muito próximo de ser igual a 0.

Em uma situação como essa, não há a menor chance de que ainda haja folhas de qualquer tipo, e a região pode até estar urbanizada a essa altura. O Indicador de Vegetação por Diferença Normalizada é o índice usado pelos analistas na área de sensoriamento remoto na maior parte do tempo.

Por que o Índice de Vegetação por Diferença Normalizada é útil?

Há muitos índices de vegetação diferentes, e a grande maioria é comparável entre si. No entanto, esse índice é o mais usado e difundido, e também tem um benefício essencial, que é a alta resolução das imagens derivadas de dados de satélite.

Em circunstâncias como essa, canais com uma resolução de dez metros podem ser utilizados para determinar o NDVI. Lembre-se de que um pixel é igual a dez por dez metros. Por outro lado, a resolução do índice que usa canais de luz extra, como a idade vermelha, pode ser de vinte metros, em que um pixel é igual a vinte por vinte metros.

Como o NDVI é calculado?

Ele pode ser determinado usando o seguinte procedimento matemático simples, que converte informações brutas de satélite em índices de vegetação.

Fórmula do Índice de Vegetação por Diferença Normalizada

A equação cria um único número que é representativo e integra as informações acessíveis nas bandas vermelha e NIR (infravermelho próximo).

Para fazer isso, ele pega a refletância em toda a banda espectral vermelha e a subtrai da refletância em toda a banda NIR. Depois disso, o resultado é dividido pela refletância total dos comprimentos de onda NIR e vermelho.

A avaliação do NDVI nunca será maior do que um número positivo e menor do que um número negativo. Além disso, um número entre -1 e 0 indica uma planta que morreu e itens inorgânicos como pedras, estradas e edifícios.

Ao mesmo tempo, seus valores para plantas vivas podem variar de 0 a 1, sendo que 1 representa a planta mais saudável e 0 representa a planta menos saudável. É possível atribuir um único valor a cada pixel em uma imagem, quer esse pixel represente uma única folha ou um campo de trigo que se estende por 500 acres.

Como usamos o Índice de Vegetação por Diferença Normalizada?

Justificadamente, ele agora está sendo utilizado em vários campos de pesquisa diferentes. Por exemplo, ele é aproveitado no campo da agricultura para os objetivos da agricultura de precisão e da avaliação da biomassa. Da mesma forma, é empregado por silvicultores para avaliar os recursos florestais, bem como o índice de área foliar (LAI).

Além disso, a NASA acredita que ele seja uma indicação confiável da existência de condições de seca. O NDVI proporcional e a concentração de vegetação são menores em áreas onde a água serve como barreira para o estabelecimento da vegetação.

Isso ocorre porque a água impede que as raízes das plantas cresçam mais profundamente no solo. Ela, incluindo outros tipos de sensoriamento remoto, O sistema de gerenciamento de dados, que é um sistema de gerenciamento de dados de alta qualidade, tem a capacidade de ser utilizado em uma ampla variedade de maneiras distintas na realidade.

O que o NDVI pode nos dizer sobre as plantas?

É essencial ter uma sólida compreensão de que a diferença normalizada Índice de vegetação é apenas uma indicação da saúde da planta e não fornece informações sobre as razões por trás de uma determinada condição.

O índice de vegetação é mais uma expressão do que um reflexo direto do que está ocorrendo no campo. Vamos dar uma olhada em três aplicações do NDVI para análise de campo:

Quando uma nova temporada começa

É útil para entender a resistência da planta ao inverno e como ela conseguiu sobreviver.

  • Se o valor for menor que 0,15, é provável que todas as plantas dessa seção do campo tenham morrido. Normalmente, esses números se referem ao solo arado sem nenhuma planta.
  • Outro exemplo de um número baixo é 0,15-0,2. Isso pode sugerir que as plantas começaram a se preparar para o inverno durante o período fenológico inicial, antes da fase de preparo do solo.
  • Um resultado na faixa de 0,2 a 0,3 é satisfatório. As plantas provavelmente progrediram para o estágio de perfilhamento e recuperaram seu estado vegetativo. 0,3-
  • 0,5 é um valor decente. No entanto, é importante lembrar que leituras de NDVI mais altas sugerem que as plantas passaram o inverno em um estágio fenológico posterior. Suponha que a imagem de satélite tenha sido capturada antes de a vegetação voltar ao seu estado normal. Nesse caso, é importante analisar a área depois que a vegetação continuou em sua forma normal.
  • Um número maior que 0,5 indica uma anomalia durante a fase pós-inverno. É recomendável que você verifique essa zona de campo.

Recapitulando, se você perceber que os valores obtidos são significativamente diferentes da norma, é necessário realizar uma inspeção da parte relevante do campo. É necessário um grande desvio da norma para que os valores sejam categorizados como anormais em uma determinada área.

Quando a estação está no meio

A utilização do índice pode ser útil para obter uma melhor compreensão de como as plantas se desenvolvem. Imagine que as leituras estejam entre leve e alto (0,5-0,85). É muito provável que essa parte específica da área não esteja enfrentando nenhum grande desafio no momento.

Se o índice permanecer mais baixo do que deveria, pode haver problemas como deficiência de água ou nutrientes no solo. No entanto, você precisa fazer sua própria investigação sobre essa área específica.

Geramos mapas para aplicação de taxa variável (VRA) de nitrogênio usando o Índice de Vegetação por Diferença Normalizada. Identificamos regiões com índices de vegetação que variam de baixo a alto.

Depois disso, cabe a cada agricultor determinar a quantidade de fertilizante necessária. O método a seguir é o mais eficaz para a aplicação de nitrogênio:

  • Suponha que o índice de vegetação da região seja alto. Nesse caso, a dosagem recomendada de fertilizante deve ser reduzida para 10 e 30% da taxa típica.
  • Se o índice de vegetação estiver em torno da média, a dosagem recomendada de fertilizante deve ser aumentada para 20 a 25% da quantidade típica.
  • Se o índice de vegetação for baixo, primeiro você precisa descobrir por que ele é assim.

Para reconstruir um campo rendimento agrícola, Também usamos esse índice. Com esses dados, produzimos mapas que podem ser usados para a aplicação de taxa variável de fertilizantes de potássio e fosfato.

Quando a temporada terminar

O índice NDVI é uma ferramenta útil para determinar se os campos estão prontos para serem colhidos; quanto mais baixo o índice, mais uma parte da área está se aproximando do estágio em que está pronta para ser colhida. Nesse cenário, um valor para o índice inferior a 0,25 seria o ideal.

O índice NDVI é uma ferramenta útil para determinar se os campos estão prontos para serem colhidos

Para começar, é um cálculo matemático realizado pixel a pixel em uma imagem, utilizando ferramentas de um GIS (Sistema de Informações Geográficas). Calculado pelo contraste das quantidades de luz vermelha e infravermelha próxima absorvidas e refletidas pela planta, ele mede o estado geral de saúde da planta.

O Índice de Vegetação por Diferença Normalizada pode ser usado para estudar terras em todo o mundo, o que o torna ideal para estudos de campo focados e monitoramento de vegetação nacional ou global.

Por meio da utilização do NDVI, podemos obter uma análise imediata dos campos, permitindo que os agricultores otimizem o potencial de produção das áreas, limitem sua influência no meio ambiente e modifiquem suas operações agrícolas de precisão.

Além disso, examiná-lo em conjunto com outros fluxos de dados, como aqueles sobre o clima, pode fornecer mais informações sobre os padrões recorrentes de secas, congelamentos ou inundações e como eles afetam a vegetação.


Perguntas frequentes


1. O que o NDVI é usado principalmente para determinar?

Ele é usado principalmente para determinar a saúde e a densidade da vegetação em uma determinada área. Esse índice é amplamente usado na agricultura, na silvicultura e na ecologia para monitorar o crescimento da vegetação, avaliar os níveis de estresse das plantas, identificar áreas de seca ou doença e ajudar nas decisões de gerenciamento de culturas.

2. Como ler as imagens NDVI?

Para ler as imagens NDVI, você pode interpretar a escala de cores associada aos valores do índice. Normalmente, a vegetação saudável aparece em verde, enquanto a vegetação menos saudável ou esparsa aparece em amarelo ou vermelho.

Tons mais escuros podem indicar áreas com alta biomassa, enquanto tons mais claros podem sugerir menor densidade de vegetação ou a presença de solo descoberto.

A compreensão do contexto da área que está sendo analisada, como o tipo específico de cultura ou as condições ambientais, pode ajudar ainda mais na interpretação das imagens NDVI e na tomada de decisões informadas sobre as práticas agrícolas.

Vegetation index: how are they used in precision agriculture?

Now, to have a whole conversation about precision agriculture, you need to speak about Vegetation Index, particularly when you’re discussing the role of remote sensing in this form of agriculture.

Vegetation is intimately involved with almost every facet of human existence, including the act of breathing, the provision of clothes and shelter, the production of food, etc. Any shift in the composition of the vegetation can influence the environment and the economy significantly.

Recent technological advances (geographic information systems (GIS), global positioning systems (GPS), remote sensing, and precision agriculture) have been the principal drivers of improved crop management. For instance, precision agriculture provides improved analysis and the discovery and control of both temporal and geographical variations in crop production within a field.

AgTech pioneers revolutionize precision agriculture via vegetation indices. It is of utmost significance in the achievement of the objective of this kind of agriculture, which is to maximize production while minimizing the number of resources used.

This modern use of vegetation indice in precision farming provides several advantages: physicochemical monitoring, real-time data, and farm activity planning. It is also possible to make efficient use of vegetation indexes mapping for future references to indicate the cyclical changes.

What are vegetation indices and their types?

Since 1974, the use of vegetation indexes, which assists in conducting periodic distant surveys of vegetation, has been widespread. Utilizing two or more spectral bands, this statistical model is a spectral transformation that may be used to detect vegetation in its more general meaning.

What are vegetation indices and their types?


Using this method, scientists and other curious individuals may efficiently watch photo-centric behaviors and spot differences in the canopy. If necessary, they can also draw reliable comparisons using this information. It involves evaluating a variety of variables, such as the development of the crop, its vigor, its biomass, and its chlorophyll content. Here is the list of vegetation indices:

  • NDVI (Normalized Difference Vegetation Index)
  • VARI (Visible Atmospherically Resistant Index)
  • ReCl (Red-Edge Chlorophyll Vegetation indexes)
  • EVI2 (Two-Band Enhanced vegetation index)
  • LAI (Leaf Area Vegetation Index)
  • WDRVI (Wide Dynamic Range Vegetation Index)
  • GNDVI (Green Normalized Difference Vegetation indexes)
  • GCI (Green Chlorophyll Vegetation Index)
  • RCI (Red Chlorophyll Vegetation indice)
  • NDWI (Normalized Difference Water Index)

What can vegetation index be used for?

When examining patterns in plant health, agricultural professionals such as farmers, agronomists, crop insurers, researchers, and others might benefit from using a vegetation index such as NDVI or VARI.

Users of the agricultural mapping and analysis tool can implement the index with the click of a button, producing a green or red patch on their aerial images, depending on the results of the index. The regions indicated by the color green have plants that are in good health. Colors such as orange, yellow, and red indicate a loss of energy and vitality.

For instance, a corn farmer may use the program to submit multispectral photographs of their cornfields at any point between the appearance of plants and the harvesting of the crop. The application would then apply the preferred vegetation index.

The colorful output may bring to their attention that a portion of the field has taken on an orange and red hue in certain places. It is an indication that the plants are becoming brown or yellow or that they are getting pockmarked. The plants in this region may be suffering from the effects of an extended period of drought, flooding, insufficient or excessive fertilization, or are infected with a disease.

As was the case before, ground-truthing was the most effective method for diagnosing a specific problem. Nevertheless, the vegetation indice provide the farmer with a hint that they should concentrate their efforts on a particular section of their land. They are free to investigate what caused the problem and consider possible solutions at this point.

Why are hyperspectral vegetation indices so important?

Integrating a reflectance spectrum into a single numerical value, known as the Vegetation Index, is a standard method for determining the qualities of vegetation. Hyperspectral Vegetation Indices, also known as Narrow-band Vegetation indexes, contain characteristics or wavelengths that hyperspectral equipment can only catch because of their shorter bandwidths.

Structure, biochemistry, and plant physiology or stress are the three primary categories that may be used to classify the vegetation attributes that can be assessed using HVIs.

  • The proportionate cover, Leaf Area Index (LAI), green leaf biomass, senesced biomass, and proportion of photosynthetically active radiation absorbed are all examples of structural features that may be measured. Most indices for structural analysis were designed for complete band setups and had narrow-band and hyperspectral counterparts.
  • Examples of biochemical features comprise water, pigments (such as chlorophyll, anthocyanins, and carotenoids), and other nitrogen-rich products (such as proteins). Plant structural components also fall under this category (lignin and cellulose).
  • A stress-induced shift in the status of xanthophylls, variations in chlorophyll content, changes in leaf wetness, and fluorescence are some understated alterations that may be measured using physiological and stress indices.

Why are hyperspectral vegetation indices so important?

Generally speaking, biochemical and physiological or stress indicators were developed with the help of laboratory or field equipment (spectral sampling of less than 10 nm). They are aimed at very tiny spectral characteristics. As a direct consequence of this, they are exclusively hyperspectral. Developed indices for water are the only exception to this rule.

Vegetation index and remote sensing technology

Earth-observing satellites supply remote sensing scientists with new data to feed their study and improve upon the analysis that has already been conducted as sensors progress.

Businesses that already have their index-based technology and those that are preparing to introduce a new one can substantially create a market for their agriculture-related products by embracing the latest innovations in spectral vegetation indexes applications. It is valid for companies that already have their index-based software and those planning to launch a new one.

The benefits vegetation indexes offer in remote sensing enhance the overall quality of the customer experience. Comparing satellite photography to different types of aerial data enables the following:

  • Reduced expenses of operation, processing, and interpretation of data collected by drones.
  • In comparison to aerial images, satellite imagery may cover a wider area.
  • Bringing down the costs of doing field inspections: extra UAV (unmanned aerial vehicle) observations are more expensive than standard satellite revisits.
  • Obtaining analyses of the data in a suitable format within a shorter amount of time.
  • Monitoring the fields regardless of how strong the winds are.

Using satellite imagery enables agricultural software companies to considerably increase the amount of aerial data they already have access to while also saving them time and money and allowing end-users to obtain more data in a shorter time.

Therefore, vegetation indice in remote sensing and crop monitoring help conduct a high-level, distant examination of the crop status. If there is a problem, farmers may choose to examine the areas that have been noticed rather than the whole field.

Reach out to GeoPard for a solution in your niche

The vast majority of the most critical vegetation indices, which number in the hundreds, have to be included in agricultural software in the form of a long list that can be accessed and used in a single location. GeoPard offers the essential analytics that can be integrated into the already available agriculture software and the planned software.

We will guide you on the optimal choice that will fulfill the requirements set out by you or your clients. No matter how you plan to utilize our product — API, white-label, or bespoke solutions — you can rest confident that the data you receive will be accurate and trustworthy since it was gathered using remote sensing and cutting-edge satellite technology.

GeoPard can provide accurate data-driven analytics on a worldwide scale. As a result, the company has won the satisfaction of many happy clients. Please contact us to discuss the specifics and potential of using sensoriamento remoto in your niche or industry.

Crop monitoring is a crucial tool that allows crop growers to detect problem areas and mitigate the risk of yield losses.

Easily monitor your crop development by relying on the latest satellite imagery. Add your field boundary to the system and access the complete satellite imagery archive on one screen:

  • Assessment of crop development conditions.
  • Detection of vegetation anomalies in near-real time.
  • Scout spots with different levels of crop development.
  • View through the clouds.

Translate the satellite imagery crop monitoring insights into fieldwork actions and benefit from making the data-driven decisions:

  • Detect the difference in crop vegetation between the latest images and scout the focused areas for tissue sampling.
  • Create Variable Rate Application maps for crop protection and in-season fertilization based on near-real-time field assessment and collect the execution report.
  • Mark the damaged field areas after a weather disaster or a disease or a pest attack and send reports to the insurance.
Saiba mais

Qual índice de vegetação é melhor para ser usado na agricultura de precisão?

There are several vegetation indices that are commonly used, including the Normalized Difference Vegetation Index (NDVI), Wide Dynamic Range Vegetation Index (WDRVI), and Green Chlorophyll Index (GCI).

  • Which vegetation index reflects more details?
  • Which vegetation index shows variation better?
  • Is NDVI the best in the multispectral vegetation index family?

The questions are known and coming up very often. Let’s investigate.

What is vegetation index?

Vegetation index is a numerical measure that quantifies the amount and condition of vegetation in a specific area based on remote sensing data.

Vegetation indices are calculated by combining different spectral bands from satellite imagery or aerial photography, which reflect the amount of energy absorbed and reflected by plants in the visible and near-infrared regions of the electromagnetic spectrum.

These indices can provide information about the health, density, and productivity of vegetation, which is useful for a wide range of applications, including agriculture, forestry, land management, and climate monitoring.

What is Normalized Difference Vegetation Index (NDVI)?

NDVI (Normalized Difference Vegetation Index) is the most famous and widely used in industries related to biomass and remote sensing.

NDVI saturation affects the accurate distinguishing of vegetation at biomass peaks. Another issue with NDVI is the soil noise effect on the early stages of crop development.

It is calculated using satellite or aerial remote sensing data, based on the difference in the reflectance of two spectral bands: the near-infrared (NIR) and the red band.

The NDVI formula is NDVI = (NIR-Red) / (NIR+Red).

Where NIR is the reflectance in the near-infrared band and Red is the reflectance in the red band.

The resulting NDVI value ranges from -1 to +1, with higher values indicating a higher density of vegetation. A value of zero indicates no vegetation, while negative values indicate water bodies or other non-vegetated surfaces.

NDVI values close to +1 indicate dense and healthy vegetation, while values closer to zero indicate sparse vegetation or areas with significant stress or damage.

It is widely used in agricultural and ecological applications to monitor vegetation growth, estimate crop yields, and assess the health and productivity of forests and other ecosystems.

It can also be used to detect and monitor drought, soil erosion, and other environmental factors that affect vegetation cover.

It, for example, is calculated by subtracting the reflectance in the near-infrared (NIR) band from the reflectance in the red band and dividing the result by the sum of the two. The resulting value ranges from -1 to +1, with higher values indicating higher levels of vegetation.

Furthermore, the idea of WDRVI (Wide Dynamic Range Vegetation Index) was created to resolve NDVI saturation issues. It was reached by expanding the range of possible WDRVI values via the introduction of the mathematical coefficient (α).

NDVI (Normalized Difference Vegetation Index) use

The NDVI (normalized difference vegetation index) formula was transformed into WDRVI = (α∗NIR-Red) / (α∗NIR+Red).

WDRVI (Wide Dynamic Range Vegetation Index) and NDVI

Zones built based on WDRVI are better compared to NDVI zones. Nevertheless, they are still not ideal because of too high biomass. 

GCI (Green Chlorophyll Index) is used to estimate leaf chlorophyll content in the plants based on near-infrared and green bands. In general, the chlorophyll value directly reflects the vegetation.

The GCI formula looks like GCI = NIR / Green – 1.

GCI (Green Chlorophyll Index) 

Zones built based on GCI better distinguish high biomass spots compared to NDVI and WDRVI. The details help to manage the field more accurately and efficiently.

RCI (Red Chlorophyll Index) incorporates the same chlorophyll content knowledge base as GCI and reflects it via the red multispectral band.

The RCI formula looks like RCI = NIR / Red – 1.

RCI (Red Chlorophyll Index) 

Zones based on RCI are accurate as GCI zones.

Keep tracking your fields and utilize the right vegetation index at the right moment during the season. A large family of vegetation indices is available in GeoPard right now.

wpChatIcon
wpChatIcon

    Solicitar Demonstração / Consulta Gratuita GeoPard


    Ao clicar no botão, você concorda com nossos Política de privacidade. Precisamos disso para responder à sua solicitação.

      Assine


      Ao clicar no botão, você concorda com nossos Política de privacidade

        Envie-nos informações


        Ao clicar no botão, você concorda com nossos Política de privacidade