Crop Imaging: Key to Data-Driven Decisions in Modern Agriculture

Crop imaging is like giving farmers a super-powered set of eyes. It means using cameras – often on drones, satellites, tractors, or even handheld devices – to capture pictures and data from fields. But it’s not just regular photos; these tools can see things our eyes can’t, like plant health hidden in infrared light or water stress invisible to us.

Introduction To Vision of Crop Imaging

What is Crop Imaging? It is the science and technology of capturing detailed visual and non-visual data from agricultural fields using specialized sensors. This includes specific wavelengths of light (like near-infrared and thermal) that reveal hidden details about plant physiology.

The core purpose of crop imaging is simple yet powerful: to measure how crops are really doing without harming them. It tells farmers exactly where plants are healthy, growing well, or struggling from things like disease, lack of water, or poor nutrition.

Most importantly, it gives an early estimate of how much crop might be harvested (yield potential). All of this is done non-destructively, meaning plants aren’t cut or damaged during the process.

Why does this matter? Traditional farming often relies on estimates, manual field scouting (which is time-consuming and subjective), and uniform treatment of entire fields. Digital crop images replaces this guesswork with objective, spatially explicit data.

It is the foundational tool enabling precision agriculture. By creating detailed maps of field variability, crop imaging allows farmers to make data-driven decisions, such as applying water, fertilizer, or pesticides only where and when they are needed.

This targeted approach is crucial for sustainable intensification: recent studies (e.g., FAO 2023, PrecisionAg Institute 2024) indicate that farms adopting imaging-guided precision practices can achieve yield increases of 10-20% while simultaneously reducing water and chemical inputs by 15-30%.

What is Crop Imaging

In an era demanding more efficient and environmentally responsible food production, Digital crop images are no longer optional – it’s essential for the future of farming. Some of the key benefits of digital crop imaging are:

  • Increased Efficiency: Replaces manual scouting: Drones/satellites cover 500+ acres per hour vs. 10–20 acres/day by foot. Reduces labor/fuel costs by up to 85% (ASABE, 2023).
  • Improved Yields & Quality: Detects crop stress early (nutrient/water gaps, disease): Boosts yields by 5–25% (USDA, 2024). Optimizes harvest timing for higher-grade produce.
  • Reduced Input Costs: Enables precision application (VRA): Cuts fertilizer use by 10–30%, water by 20–25%, and pesticides by 30–70% (Penn State Extension, 2023).
  • Enhanced Sustainability: Lowers carbon footprint by reducing tractor passes. Minimizes chemical runoff into soil/water: Supports regenerative farming goals.
  • Objective, Quantifiable Data: Generates metrics like NDVI (plant health scores) for data-driven decisions. Tracks field changes via cloud analytics.
  • Early Problem Detection: Identifies pests/disease 2–3 weeks before visible symptoms (multispectral imaging). Prevents ~15% crop loss (FAO, 2023).

Spectrum of Crop Imaging Technologies

Imagine if farmers could see exactly how their crops were feeling – not just if they look green, but if they’re thirsty, hungry, or getting sick before any visible signs appear. Thanks to Digital crop images, this superpower is now a reality!

By using special sensors mounted on drones, tractors, or even satellites, farmers can capture detailed pictures far beyond what our eyes can see. Here are some of different “eyes” in the crop imaging toolbox and what they reveal:

1. The Familiar Eye: RGB (Visible Light) Imaging

Think of this as taking a standard color photograph from the sky. RGB cameras capture red, green, and blue light, just like your phone camera. While it seems basic, it’s incredibly useful.

Farmers use RGB images to count how many plants have emerged after planting, see how much ground is covered by leaves (canopy cover), spot troublesome weed patches, and do general field scouting.

  • It’s a fast and affordable way to get a crop overview.

2. The Plant Health Detective: Multispectral Imaging

This technology goes deeper. Multispectral sensors capture light reflected by plants in specific, key color bands, including ones invisible to us like Near-Infrared (NIR) and Red Edge. Healthy plants reflect a lot of NIR light.

By comparing the amount of red light (absorbed by healthy chlorophyll) to NIR light, these sensors calculate powerful Vegetation Indices like the NDVI (Normalized Difference Vegetation Index).

The Plant Health Detective Multispectral Imaging

These indices act like a “health score,” revealing chlorophyll content, plant vigor (strength), and total biomass. This allows farmers to spot areas lacking nutrients, suffering from drought stress, or showing the very earliest signs of disease or pest damage – often before the human eye can see anything wrong.

  • It’s the most widely used crop imaging tech, making up over 35% of the precision agriculture sensors market as of 2023.

3. The Super-Detailed Scientist: Hyperspectral Imaging

Hyperspectral takes multispectral to the extreme. Instead of just a few bands, it captures reflectance across hundreds of very narrow, contiguous bands. This creates a detailed spectral “fingerprint” for every pixel in the image.

Why is this powerful? Different plant stresses (like specific nutrient deficiencies – nitrogen vs. potassium) or diseases cause unique changes in this fingerprint. Hyperspectral imaging allows for incredibly precise identification of the exact problem and can even analyze biochemical traits within the plant.

  • While more complex and expensive, its use in advanced diagnostics is growing rapidly, with the global market projected to expand at over 12.8% annually (CAGR) from 2024 to 2030.

4. The Thirst Meter: Thermal Imaging

Thermal cameras don’t see light; they see heat. They measure the temperature of the plant canopy. When plants are water-stressed, they close their pores (stomata) to conserve water. This reduces evaporative cooling, causing their leaves to heat up significantly compared to well-watered plants.

  • By spotting these “hot spots” in a field, thermal imaging is a direct way to monitor drought stress.

Farmers use this vital information to target their irrigation precisely, saving water and energy, and ensuring crops get the right amount at the right time.

5. The Photosynthesis Gauge: Fluorescence Imaging

This advanced technique measures the faint glow (fluorescence) emitted by chlorophyll molecules after they absorb sunlight. The amount and type of this glow change depending on how efficiently the plant is photosynthesizing.

Fluorescence Imaging and 3D Imaging LiDAR

When a plant is under stress (even very early stress), its photosynthetic machinery is often the first thing affected, altering its fluorescence signature. This makes it an incredibly sensitive tool for detecting stress before other symptoms show and for deep research into plant physiology.

  • It’s crucial for high-throughput phenotyping (measuring plant traits automatically).

6. The Shape Measurer: 3D Imaging / LiDAR

These sensors (like LiDAR – Light Detection and Ranging) use lasers or sophisticated cameras to measure the distance to the plant canopy thousands of times per second.

  • This builds a detailed 3D map showing plant height, the density and structure of leaves and stems, and the overall shape (architecture) of the canopy.

By taking these measurements over time, farmers can accurately track growth rates and estimate the volume of biomass (total plant material) in a field, which is a key indicator of yield potential.

What Technologies Used To Get Digital Crop Images?

Crop imaging – using cameras and sensors to take pictures of fields from above or within – is transforming farming. But how do we actually get those images? Different platforms are used, each with its own strengths and weaknesses.

1. Ground-Based Systems

Imagine walking through a field with a special camera or attaching sensors directly to a tractor. That’s ground-based imaging. This includes handheld devices like cameras and smartphones for spot checks, sensors mounted on tractors as they drive through fields, and even larger phenotyping platforms (like sensor carts or booms) designed for research plots.

Pros: These systems get you the sharpest detail (high resolution). You can focus on specific plants or small areas very precisely. They’re great for targeted measurements on individual leaves or stems.

Cons: Covering a large field this way takes a lot of time and labor. Their view is limited, making them impractical for big farms. Tractor-mounted systems can also potentially compact soil.

2. UAVs (Drones)

Drones (UAVs) have become the most popular tool for capturing crop images over entire fields. Equipped with regular or specialized cameras (like those seeing plant health via near-infrared light), they fly automated missions over crops.

Pros: Drones offer fantastic flexibility – you can fly them whenever needed. They capture highly detailed images, cover fields quickly, and are generally more affordable than planes or high-res satellites. They are ideal for weekly checks on medium-sized farms.

Cons: A typical drone flight lasts only 20-45 minutes per battery, limiting how much ground you can cover in one go. Rules and regulations (like needing a license in many places) must be followed.

Flying also depends heavily on good weather – no rain or strong winds. Drone use is booming, with the agricultural drone market expected to reach $8.9 billion globally by 2028.

3. Manned Aircraft

For truly huge fields or entire ranches, planes or helicopters equipped with imaging sensors are sometimes used.

Pros: They can cover much larger areas in a single flight than drones can. This makes them efficient for massive farms or regional surveys.

Cons: Hiring a plane is significantly more expensive than using drones. The images taken from higher altitudes usually have less fine detail (lower resolution) than drone photos. Scheduling flights is also less flexible and depends on aircraft and pilot availability.

4. Satellites

Earth observation satellites orbiting high above us constantly take pictures of the entire planet, including farm fields.

Pros: Satellites offer global coverage, meaning they can image any farm, anywhere. They fly on strict schedules, providing consistent images at regular intervals (e.g., every few days or weeks).

Crucially, they often have archives of images going back years or decades, allowing farmers to compare current fields with past seasons.

Cons: While constantly improving, most satellite images still have lower resolution than drones or planes – you might see whole fields clearly, but not individual plants. Clouds are a major problem, blocking the satellite’s view.

Farmers also have no control over exactly when a satellite passes overhead. Newer satellite constellations (like Planet Labs) now offer daily imaging and resolutions down to 3 meters per pixel, but ultra-high detail (needed to see individual plants) still typically requires drones or aircraft.

The best platform for crop imaging depends on the job. Often, farmers use a combination of these tools – like using satellites for broad monitoring and sending drones to investigate specific problem spots they spot. This multi-level view gives farmers unprecedented insight into their crops, helping them grow more food more efficiently.

Crop Imaging Data Processing & Analysis

So, you’ve captured amazing pictures of your fields using drones or satellites. That’s step one! But those millions of colorful pixels (the tiny dots making up the image) don’t automatically tell you how your crops are doing.

Step two is data processing and analysis – turning those raw pictures into useful farming knowledge. Here’s how it works:

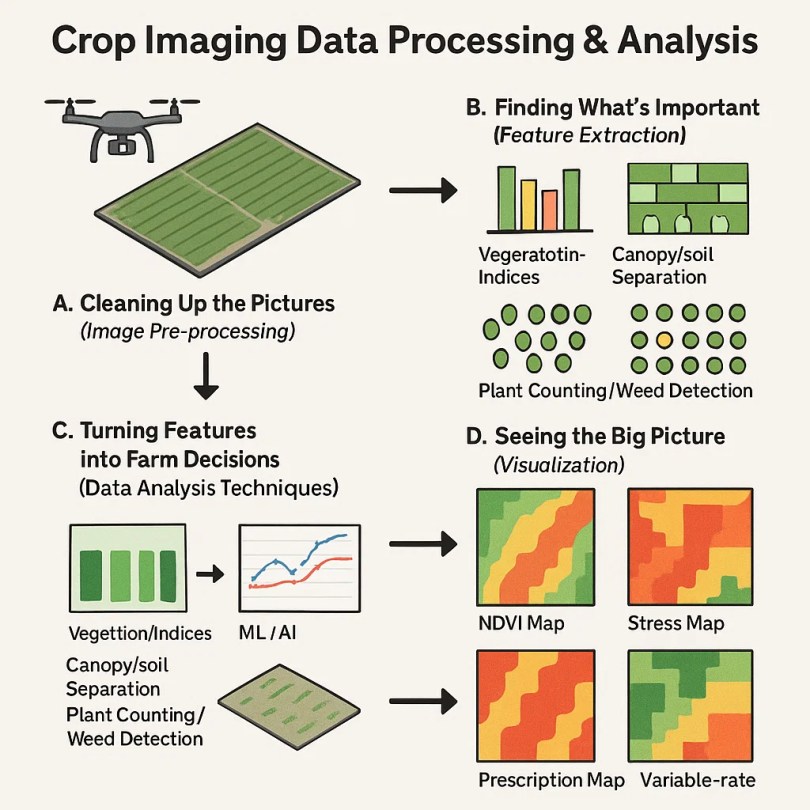
A. Cleaning Up the Pictures (Image Pre-processing)

Think of this like getting your photos ready for serious study. Raw images often have small errors. Special software fixes these:

  • Georeferencing pins each pixel to a GPS location.
  • Orthomosaicking stitches images into one seamless map.
  • Radiometric calibration adjusts for lighting changes (e.g., morning vs. noon sun).
    Without this step, maps could mislead.

B. Finding What’s Important (Feature Extraction)

Now, we start looking for specific things in the cleaned-up images:

  • Vegetation indices (like NDVI) use plant light reflection to measure health. Low NDVI often signals stress.
  • Canopy/soil separation distinguishes crops from bare ground.
  • Plant counting/weed detection automates scouting.

Crop Imaging Data Processing & Analysis

Latest Context: Farmers increasingly rely on these indices. For example, studies show using NDVI can improve nitrogen application efficiency by 10-25%, reducing waste and cost.

C. Turning Features into Farm Decisions (Data Analysis Techniques)

This is where the magic happens – finding meaning in the numbers and shapes:

Comparing the vegetation index values from the images with actual measurements taken on the ground (like leaf samples or yield at harvest). This confirms, “Yes, low NDVI here really did mean less nitrogen.”

Machine Learning (ML) & AI: This is exploding in agriculture! Computers learn from massive amounts of past data (images + ground truth) to spot complex patterns humans might miss:

  • Disease classification (spotting sick plants early).
  • Yield prediction (over 90% accuracy in trials).
  • Weed/insect detection.

Latest Stats & Facts: The global market for AI in agriculture is booming, projected to reach over $4 billion by 2028 (source: Statista, 2023).

A 2023 FAO report highlighted ML’s growing role in early pest/disease detection, potentially reducing crop losses significantly. Yield prediction models using crop imaging data are now achieving over 90% accuracy in some trials.

D. Seeing the Big Picture (Visualization)

All this analysis is most powerful when it’s easy to see. The final output is often a colorful map overlaid on your field:

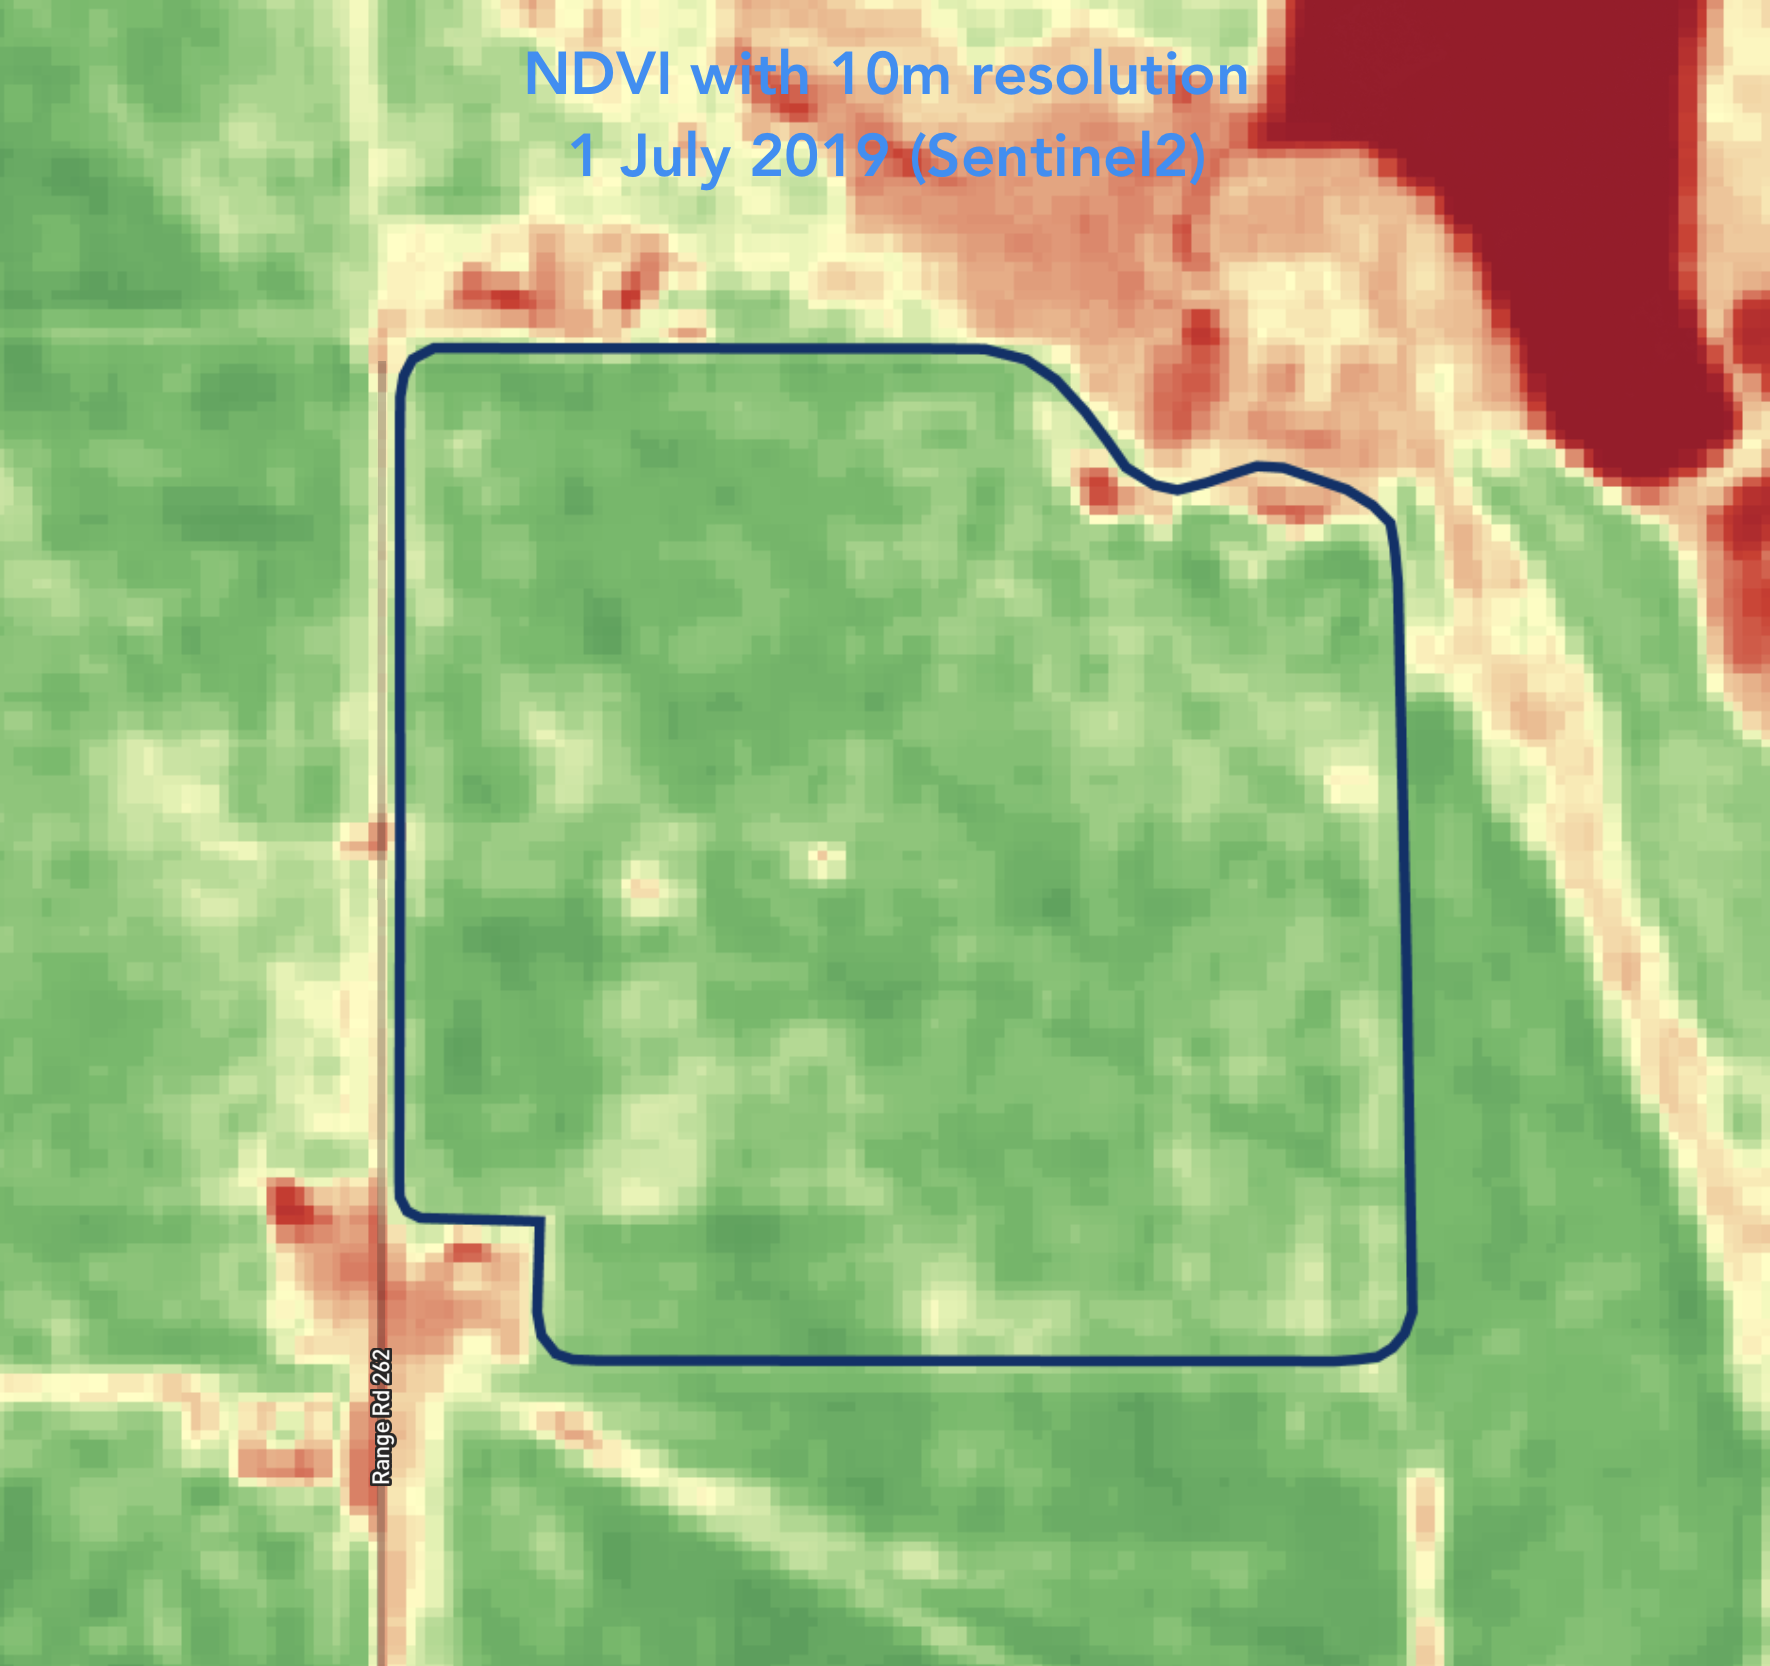
  • NDVI Maps: Show health zones (green = healthy, red/yellow = stressed).
  • Stress Maps: Highlight areas likely suffering from drought, nutrient deficiency, or disease.
  • Prescription Maps: The ultimate goal! These maps tell variable-rate applicators exactly where to put more seed, fertilizer, or water, and where to use less, based on the image analysis. This is precision farming in action.

Why it matters: A clear map lets a farmer instantly grasp problems, track changes over time, and make confident, targeted management decisions.

Core Applications of Digital Crop Images

Using cameras mounted on drones, satellites, tractors, and even handheld devices, this technology takes detailed pictures of fields. But it’s more than just photos – special sensors capture light invisible to the human eye, revealing the hidden health of plants. Here’s why crop imaging is quickly becoming essential on modern farms:

A. Precision Nutrient Management

Digital crop images shows tiny differences in plant color and growth that signal where nutrients (like nitrogen) are lacking. Instead of blanketing the whole field with fertilizer, farmers can create maps and apply it only where needed.

  • Studies show this variable-rate application can cut fertilizer use by 15-30%, saving farmers money and reducing environmental impact.

B. Precision Irrigation Management

Specialized cameras detect subtle changes in leaf temperature and color that indicate water stress long before plants visibly wilt. By pinpointing exactly which zones in a field are thirsty, farmers can direct water precisely.

  • Farms using imaging for irrigation report water savings of 20-50%, crucial as droughts become more common.

C. Pest & Disease Management

Crop imaging spots the early warning signs of pests or disease – unusual color patterns, leaf damage, or stunted growth – often missed by the human eye during routine checks. This allows for targeted scouting and precise spraying only on affected areas.

Core Applications of Digital Crop Images

  • Early detection can prevent yield losses of 10-30%, and targeted spraying reduces pesticide use significantly.

D. Weed Management

High-resolution imaging, especially from drones, creates detailed “weed maps” showing exactly where invasive plants are taking hold. Farmers can then use this map to guide spot-spraying robots or precise herbicide applicators.

  • Targeted weed control based on imaging can reduce herbicide volumes by up to 90% in some cases, lowering costs and chemical exposure.

E. Yield Prediction & Forecasting

By analyzing crop health and biomass throughout the season using imaging data, sophisticated models can predict yield potential field-by-field, or even zone-by-zone.

  • Major grain companies increasingly use satellite imaging for regional forecasts, with accuracy rates reaching 85-95% weeks before harvest, aiding logistics and marketing.

F. Crop Scouting & Monitoring

Instead of walking fields for hours, farmers can deploy drones with imaging cameras to get a bird’s-eye view of the entire farm quickly. They can spot problems like flooding, poor emergence, or equipment damage efficiently

  • Drones can scout 100 acres in less than 30 minutes, a task taking humans days, freeing up valuable time.

G. Plant Phenotyping

For scientists developing new seed varieties, imaging is revolutionary. It automates the measurement of key traits (height, leaf area, flowering time, stress response) on thousands of plants in field trials.

  • This allows breeders to analyze vastly more plants and select the best performers much faster, accelerating the development of more resilient, higher-yielding crops.

Challenges And Future of Crop Imaging

Getting started with crop imaging isn’t always simple or cheap. The initial cost can be significant. Some of the key challenges are:

  • Cost: Getting started is expensive. A basic drone imaging setup costs $2,000-$10,000, while advanced systems with hyperspectral sensors can reach $30,000+. Software subscriptions add ongoing costs.
  • Data Overload: Farms generate massive image data daily – easily gigabytes or terabytes per flight or scan. Storing, managing, and processing this requires significant computing power and cloud storage, which can be costly and complex.
  • Expertise Needed: Turning colorful image maps into useful farming actions requires skills in remote sensing, agronomy, and data science. Many farmers lack this specialized knowledge.
  • Complex Interpretation: Translating a plant’s unique “light signature” (spectral data) into clear actions (e.g., “add fertilizer here”) remains challenging and prone to error without experience.
  • Environmental Hurdles: Clouds block satellite views. Wind disrupts drone flights and image clarity. Changing sun angles and soil color affect sensor readings.
  • Regulations: Drone flights face strict airspace rules, requiring licenses and operational limits, adding complexity.

Despite the challenges, the future of crop imaging is incredibly promising, driven by rapid technological advancements. We’ll see much deeper integration with other data sources.

Imagine combining crop images seamlessly with real-time soil moisture readings from ground sensors, weather forecasts, and historical yield maps. This creates a complete picture of field health.

Artificial Intelligence (AI) and Machine Learning (ML) are game-changers, automating the analysis of huge image datasets. This means faster, even real-time or near-real-time processing, giving farmers actionable insights within hours or minutes, not days.

  • Better, Cheaper Sensors: Sensors, especially powerful hyperspectral ones (capturing hundreds of light bands for ultra-detailed analysis), are getting smaller, lighter, and more affordable, making advanced imaging more accessible.
  • Easier-to-Use Tools: Tech companies are building simpler analytics platforms and apps. Farmers will get clear, actionable recommendations directly on tablets or phones, no PhD needed.
  • Prediction & Prescription: The focus shifts from seeing problems to preventing them. AI will forecast issues (e.g., pest outbreaks, yield potential) weeks in advance using imaging trends and other data.

Conclusion

Crop imaging has become a powerful tool, fundamentally changing how we grow our food. By giving farmers “eyes in the sky” and “eyes in the field” using technologies like drones, satellites, and special ground sensors, it provides incredibly detailed pictures of crop health, soil conditions, and potential problems. This ability to see what’s happening across vast fields in near real-time is at the heart of modernizing agriculture.

Satellite Farming Revolutionizes Global Food Security With Space Data

Demographers confirm Earth’s population will reach 10 billion this century, creating immense pressure on global food systems, especially in developing nations. Alarmingly, only 3.5% of the planet’s land is suitable for unrestricted crop cultivation according to UN FAO data.

Compounding this challenge, agriculture itself contributes significantly to climate change; deforestation accounts for 18% of global emissions while soil erosion and intensive farming further increase atmospheric carbon levels.

What is Satellite Farming?

Satellite farming has emerged as a critical solution for sustainable agriculture. This space-powered technology operates on a powerful principle: observe, compute, and respond. By harnessing GPS, GNSS, and remote sensing capabilities, satellites detect field variations down to square-meter precision.

This capability enables advanced drought prediction months in advance, millimeter-accurate soil moisture mapping, hyper-localized irrigation planning, and early pest detection systems.

For instance, in Mali’s challenging agricultural environment where failed rains in 2017-2018 caused cereal prices to spike and widespread hunger, NASA Harvest provides smallholders with satellite-derived crop stress alerts through Lutheran World Relief, enabling life-saving early interventions.

What is Satellite Farming

Essentially, these orbiting tools transform agricultural guesswork into precise action for farmers worldwide facing climate uncertainty.

Major Organizations Advancing Agricultural Space Technology

Leading this agricultural technology revolution are prominent international organizations bridging space innovation and farming needs. The Food and Agriculture Organization (FAO) strategically combines its Collect Earth Online platform with SEPAL tools for real-time land and forest monitoring, which proves crucial for global climate action initiatives.

Meanwhile, NASA’s SMAP soil moisture missions provide water resource managers with vital hydrological data, while its specialized Harvest program delivers targeted support to small-scale farmers in vulnerable regions like Mali.

Across the Atlantic, the European Space Agency deploys its advanced Copernicus Sentinel satellites and the SMOS mission to monitor continental-scale crop health across Europe, with the upcoming FLEX satellite poised to significantly advance these capabilities.

India’s space agency ISRO contributes substantially through satellites like Cartosat and Resourcesat, which generate high-precision crop acreage estimates and enable accurate assessment of drought or flood damage across the subcontinent.

Simultaneously, Japan’s JAXA operates the sophisticated GOSAT series for greenhouse gas tracking and ALOS-2 with its unique PALSAR-2 radar technology that penetrates cloud cover for reliable day/night crop monitoring.

Furthermore, the World Meteorological Organization delivers critical forecasting services for agriculture, water management, and disaster response through its comprehensive global climate application network. Together, these institutions form an indispensable technological safety net supporting global food production systems.

Global Satellite Farming Adoption Patterns

Different nations adopt distinct approaches to satellite-enabled agriculture, with varying levels of implementation success. Israel stands as a global pioneer in full-scale precision agriculture, leveraging satellite data to manage water and nutrients down to individual plants in its arid environment, effectively transforming challenging landscapes into productive farms—a model desperately needed in water-scarce regions worldwide.

Global Satellite Farming Adoption Patterns

Germany excels in smart farming integration, combining artificial intelligence with satellite imagery for early plant disease diagnosis while connecting farmers directly to markets through innovative digital platforms.

Meanwhile, Brazil implements an ambitious low-carbon incentive system, integrating crops, livestock, and forests while using satellite monitoring to slash agricultural emissions by 160 million tonnes annually. The United States employs satellite optimization within its industrial-scale monoculture systems, particularly in states like California where almond growers achieved 20% water reduction during droughts using NASA data.

However, comprehensive research reveals only Israel and Germany currently practice fully integrated satellite farming systems. Major food producers like China, India, and Brazil utilize elements of the technology but lack complete adoption across their agricultural sectors.

Crucially, developing nations in Africa, Asia, and Latin America urgently need these advanced systems but face significant implementation barriers including technology costs and technical training gaps.

This adoption disparity remains particularly alarming since studies indicate satellite farming could boost yields by up to 70% in food-insecure regions through optimized resource management.

Satellite Monitoring of Agricultural Environmental Impact

Advanced satellites play an increasingly vital role in combating agriculture’s substantial environmental footprint, which includes significant soil, water, and air pollution.

Industrial runoff and unsustainable farming practices deposit dangerous contaminants like chromium, cadmium, and pesticides into agricultural soils worldwide, while fertilizer combustion releases harmful nitrogen oxides and particulate matter into the atmosphere. Agricultural runoff further contaminates water systems with nitrates, mercury, and coliform bacteria, creating public health hazards.

Moreover, agriculture generates staggering greenhouse gas emissions: land clearing and deforestation produce 76% of agricultural CO₂ emissions, livestock and rice cultivation contribute 16% of global methane (which traps 84 times more heat than CO₂ in the short-term), and fertilizer overuse accounts for 6% of nitrous oxide emissions.

Fortunately, specialized pollution-monitoring satellites now track these invisible threats with unprecedented precision. Japan’s GOSAT-2 satellite maps CO₂ and methane concentrations across 56,000 global locations with greater than 0.3% accuracy, providing invaluable climate data.

Europe’s Copernicus Sentinel-5P, currently the world’s most advanced pollution satellite, revealed that 75% of global air pollution originates from human activities, driving immediate environmental policy changes.

Satellite Monitoring of Agricultural Environmental Impact

India’s HySIS satellite monitors industrial pollution sources through sophisticated hyperspectral imaging, while the upcoming French-German MERLIN mission will deploy cutting-edge lidar technology to pinpoint methane “super-emitters” like intensive feedlots and rice fields.

These orbital sentinels increasingly hold industries and agricultural operations accountable, transforming global environmental enforcement capabilities.

Overcoming Satellite Farming Implementation Challenges

Despite its proven benefits for sustainable agriculture, significant barriers hinder global satellite farming adoption, particularly in developing regions. Smallholder farmers, who grow approximately 70% of the world’s food, often lack reliable internet access or technical training to interpret complex geospatial data.

The substantial cost of technology remains prohibitive; a single advanced soil sensor can cost $500—far beyond financial reach for most farmers in developing economies. In countries like Pakistan and Kenya, valuable agrometeorological data rarely reaches field workers due to persistent infrastructure gaps and technical limitations.

Cultural resistance also presents adoption challenges; many farmers traditionally trust generational wisdom over algorithmic recommendations, while others reasonably fear data misuse by insurers or government agencies. To address these multifaceted challenges, agricultural researchers propose concrete implementation solutions.

National governments must fund mobile training workshops that teach farmers to interpret satellite alerts, directly modeled on Mali’s successful Lutheran World Relief program. Financial support mechanisms should subsidize affordable monitoring tools like AgriBORA’s $10 soil sensors specifically designed for African smallholders.

Additionally, a WMO-coordinated global knowledge-sharing network could democratize access to critical crop forecasts and pollution data across borders.

Emission reduction incentives, similar to Brazil’s innovative ABC Program offering low-interest loans for climate-smart farming, would significantly accelerate sustainable technology adoption.

Ultimately, enhanced worldwide cooperation remains essential; when Indian and European satellites shared real-time data during the 2020 locust swarm crisis, East African farmers successfully saved 40% of threatened crops through timely interventions. Scaling such collaborative models could prevent future agricultural disasters across vulnerable food systems.

Conclusion

Looking toward the future, satellite farming represents humanity’s most promising approach for balancing urgent food security needs with responsible environmental stewardship. Developing nations must prioritize implementing proven Israeli and German precision agriculture models to boost yields sustainably amid climate challenges.

Expanding methane-monitoring satellite capabilities like MERLIN’s technology proves particularly critical, given methane’s disproportionate climate impact potential. The compelling statistics underscore the opportunity: research indicates optimized satellite use could increase developing-world agricultural yields by 70% while simultaneously reducing water consumption and fertilizer use by 50%.

As climate volatility intensifies and global populations expand, these orbiting guardians offer our clearest pathway to nourish 10 billion people without sacrificing planetary health. The ultimate harvest? A food-secure future where agriculture actively heals rather than harms our precious Earth.

High-Accuracy AI Models Classifies Topographic Mapping Faster Than Traditional

Indonesia, a nation of over 17,000 islands spanning 1.9 million square kilometers, faces a critical challenge in creating detailed maps to support its development goals.

With only 3% of the country covered by large-scale topographic maps (1:5000 scale), traditional methods like manual stereo-plotting and field surveys are too slow to meet urgent needs for urban planning, disaster management, and environmental conservation.

A groundbreaking study published in Remote Sensing in 2025 offers a solution: a deep learning framework that automates land cover classification using very-high-resolution satellite imagery.

The Challenge of Mapping Indonesia’s Topography

Indonesia’s size and complexity make mapping a monumental task. The Geospatial Information Agency (BIG), responsible for national mapping, currently produces 13,000 square kilometers of topographic maps annually.

At this rate, mapping the entire country would take over a century. Even if forested areas—which cover nearly half of Indonesia—are excluded, completing the remaining terrain would still require 60 years.

This slow progress clashes with national priorities like the One Map Policy, introduced in 2016 to standardize maps across sectors and avoid conflicts in land use. Scaling this policy to 1:5000 maps is essential but far behind schedule.

Topographic maps are detailed representations of natural and human-made features on Earth’s surface, including elevation (hills, valleys), water bodies, roads, buildings, and vegetation.

They serve as foundational tools for infrastructure planning, disaster response, and environmental monitoring. For Indonesia, creating these maps at a 1:5000 scale (where 1 cm on the map equals 50 meters on the ground) is critical for precision in projects like road construction or flood modeling.

The Challenge of Mapping Indonesia’s Topography

Land cover data, a subset of topographic maps, refers to the physical material on Earth’s surface, such as forests, urban areas, or water. Unlike land use (which describes how humans utilize the land, e.g., residential or industrial zones), land focus on observable features.

Accurate land cover maps help governments track deforestation, monitor urban sprawl, or assess agricultural productivity. Traditionally, analysts manually label these features pixel by pixel using aerial photos or satellite images, a process that is both time-consuming and prone to human error.

For example, identifying roads or small buildings in dense urban areas can take days of meticulous work. The 2025 study addresses this bottleneck by replacing manual efforts with artificial intelligence, specifically deep learning, to automate land cover classification.

AI-Driven Satellite Imagery Analysis 

The research focused on Mataram City, a small but diverse urban area on Lombok Island, as a test case. The team used Pleiades satellite imagery from 2015, which included high-resolution panchromatic (0.5 meters) and multispectral (2 meters) data.

Panchromatic images capture fine spatial details in grayscale, while multispectral images provide color and infrared information across specific wavelength ranges (e.g., red, green, blue, near-infrared).

To combine these strengths, the researchers applied a technique called pan-sharpening, which merges the high-resolution grayscale data with lower-resolution color imagery. This process produced crisp, detailed images with a resolution of 0.5 meters, ideal for detecting small features like roads or individual buildings.

Pan-sharpening is vital because it retains the rich spectral information of multispectral data while enhancing spatial clarity, ensuring that colors align accurately with physical features.

Next, the team extracted additional information from the images to improve classification accuracy. They calculated the Normalized Difference Vegetation Index (NDVI), a measure of plant health derived from near-infrared (NIR) and red light reflection.

Healthy vegetation reflects more near-infrared light and absorbs more red light due to chlorophyll activity. The formula NDVI=(NIR−Red)/(NIR+Red) produces values between -1 and 1, where higher values indicate denser, healthier vegetation.

NDVI is invaluable for distinguishing forests, farmland, and urban green spaces. For instance, in this study, NDVI helped differentiate between lush plantations and bare soil.

Texture analysis was another key step. Using a statistical method called the Gray-Level Co-occurrence Matrix (GLCM), the researchers quantified patterns in the imagery, such as the roughness of agricultural fields versus the smoothness of paved roads.

GLCM works by analyzing how often pairs of pixels with specific values and spatial relationships (e.g., horizontally adjacent) occur in an image. From this matrix, metrics like homogeneity (uniformity of pixel values), contrast (local intensity variations), and entropy (randomness of pixel distribution) are calculated.

These texture metrics helped the AI model differentiate between similar-looking land cover types—for example, distinguishing between asphalt roads and dark soil patches.

To simplify the data, the team applied Principal Component Analysis (PCA), a technique that identifies the most significant patterns in a dataset. PCA reduces redundancy by transforming correlated variables (e.g., multiple texture bands) into a smaller set of uncorrelated components.

In this study, PCA condensed five texture bands into two principal components while retaining 95% of the original information. This streamlined the input for the deep learning model, improving both accuracy and computational efficiency.

U-Net Deep Learning for Land Cover Topography

The heart of the study was a deep learning model based on the U-Net architecture, a type of convolutional neural network (CNN) widely used in image segmentation tasks.

Named for its U-shaped design, U-Net consists of two main parts: an encoder that analyzes the image to extract hierarchical features (e.g., edges, textures) and a decoder that reconstructs the image with pixel-wise labels.

The encoder uses convolutional layers and pooling to downsample the image, capturing broad patterns, while the decoder upsamples the data to restore spatial resolution. Skip connections between encoder and decoder layers preserve fine details, enabling precise boundary detection—a critical feature for mapping narrow roads or irregularly shaped buildings.

Distribution of Land Cover Classes in Dataset

The model used a ResNet34 backbone—a pre-trained network renowned for its depth and efficiency. ResNet34 belongs to the residual network family, which introduces “shortcut connections” to bypass layers, mitigating the vanishing gradient problem (where deep networks struggle to learn due to diminishing updates during training).

By leveraging ResNet34’s ability to recognize complex patterns from ImageNet (a massive image database), the model required less training data and time to adapt to satellite imagery.

Training the model required 1,440 image tiles, each 512×512 pixels, covering six land cover classes: buildings, roads, agricultural land, bare land, plantations, and water bodies.

The dataset had inherent imbalances; roads and water bodies made up just 3.7% and 4.2% of the samples, respectively, while buildings and agricultural land accounted for over 25% each. Despite this challenge, the model was trained over 200 epochs—a balance between accuracy and computational cost—with a batch size of 2 due to memory constraints.

An epoch refers to one complete pass of the training data through the model, while batch size determines how many samples are processed before updating the model’s parameters. Smaller batch sizes reduce memory usage but may slow training.

Enhancing Maps with Morphological Processing

Even the best AI models produce errors, such as misclassifying isolated pixels or creating jagged edges around features. To address this, the researchers applied morphological processing, a technique that smooths out imperfections using operations like erosion and dilation.

Erosion removes thin layers of pixels from object boundaries, eliminating tiny misclassified patches, while dilation adds pixels to expand object boundaries, filling gaps in linear features like roads.

These operations rely on a structuring element (a small matrix) that slides over the image to modify pixel values. The optimal kernel size for these operations (5×5 pixels) was determined through semi-variance analysis, a geostatistical method that quantified spatial patterns in the imagery.

Semi-variance measures how much pixel values differ at varying distances, helping identify the scale at which texture features (e.g., building clusters) are most distinct.

AI Boosts Mapping Speed and Accuracy

The model achieved an initial accuracy of 84% (kappa score = 0.79), which rose to 86% (kappa = 0.81) after post-processing. The kappa score (Cohen’s kappa) measures agreement between predicted and actual classifications, adjusting for random chance.

A score of 0.81 indicates “almost perfect” agreement, surpassing the 0.61–0.80 range considered “substantial.” Water bodies and plantations were classified with near-perfect accuracy (97% and 96%, respectively), while roads—challenged by their thin, linear shape and shadows—reached 85%.

AI Boosts Mapping Speed and Accuracy

Buildings and agricultural land also performed well, with F1-scores of 88% and 83%. The F1-score, a harmonic mean of precision and recall, balances false positives and false negatives, making it ideal for evaluating imbalanced datasets.

The efficiency gains were even more striking. Traditional stereo-plotting, which involves manually labeling features in 3D aerial imagery, takes nine days per map sheet (5.29 km²) for buildings and vegetation.

The AI-driven approach reduced this to 43 minutes per sheet—a 250-fold improvement. Training the model required 17 hours initially, but once trained, it could classify vast areas with minimal human intervention. Scaling this system could allow Indonesia to map 9,000 km² annually, cutting the projected completion time from over a century to just 15 years.

AI Mapping Advances Global Sustainability

The implications extend far beyond Indonesia. Automated land cover classification supports global efforts like the UN Sustainable Development Goals (SDGs). For instance, tracking deforestation (SDG 15) or urban expansion (SDG 11) becomes faster and more precise.

In disaster-prone regions, such as flood-prone areas, up-to-date maps can identify vulnerable communities and plan evacuation routes.

Farmers also benefit; accurate land cover data enables precision agriculture, optimizing water use and crop yields by monitoring soil health and vegetation stress via NDVI.

However, challenges remain. The model’s performance on underrepresented classes like roads highlights the need for balanced training data. Future work could incorporate transfer learning, a technique where a model pre-trained on one task (e.g., general image recognition) is fine-tuned for a specific application (e.g., road detection in satellite imagery).

This reduces the need for massive labeled datasets, which are costly to create. Testing advanced architectures like U-Net3+, which enhances feature aggregation across scales, or transformer-based models (which excel at capturing long-range dependencies in images) could further improve accuracy.

However, integrating Lidar (Light Detection and Ranging) or radar data could also enhance results, especially in cloudy regions where optical satellites struggle.

Conclusion: A New Era for Geospatial Science

This study marks a turning point in topographic mapping. By automating land cover classification, countries can produce accurate maps faster and cheaper than ever before. For Indonesia, this technology is not just a convenience—it’s a necessity to manage its rapid urbanization, protect its forests, and prepare for climate-related disasters.

As AI and satellite technology advance, the vision of real-time, high-resolution mapping is within reach, empowering governments and communities to build a more sustainable future.

Reference: Hakim, Y.F.; Tsai, F. Deep Learning-Based Land Cover Extraction from Very-High-Resolution Satellite Imagery for Assisting Large-Scale Topographic Map Production. Remote Sens. 2025, 17, 473. https://doi.org/10.3390/rs17030473

Optimizing Nitrogen Use in Durum Wheat with NNI and NDVI Map-Based Strategies

Durum wheat, a cornerstone of Mediterranean agriculture and a globally critical crop for pasta production, faces an urgent challenge: the unsustainable use of nitrogen (N) fertilizers.

While nitrogen is indispensable for maximizing yields, its excessive application has dire environmental consequences, including groundwater contamination, greenhouse gas emissions, and soil degradation.

A groundbreaking four-year study (2018–2022) conducted in Asciano, Italy, and published in the European Journal of Agronomy, sought to address this crisis by rigorously comparing conventional nitrogen management with advanced precision farming techniques.

The research focused on three satellite-guided strategies—Nitrogen Nutrition Index (NNI), proportional NDVI (NDVIH), and compensative NDVI (NDVIL)—against traditional uniform N application. The findings not only reveal a path to sustainable durum wheat cultivation but also quantify the economic and ecological trade-offs of each method with remarkable precision.

Methodology: Precision Farming Meets Satellite Technology

The experiment unfolded across four consecutive growing seasons in the rolling hills of Tuscany, a region emblematic of Mediterranean wheat farming. Researchers divided test fields into plots subjected to four distinct N management strategies.

The conventional “flat rate” approach followed regional agronomic guidelines, applying 150 kg of nitrogen per hectare annually. In contrast, the precision methods leveraged Sentinel-2 satellite imagery—a European Space Agency mission providing high-resolution (10-meter) multispectral data—to tailor N application spatially and temporally.

The NNI strategy stood apart by calculating real-time crop nitrogen status using a validated algorithm that integrates leaf area index and biomass estimates. NDVIH allocated N proportionally based on vegetation density (Normalized Difference Vegetation Index), while NDVIL adopted a compensative approach, funneling extra N to low-vegetation zones.

NNI Outperforms Conventional and NDVI-Based Strategies

Over the study period, the NNI method demonstrated unparalleled efficiency. It reduced nitrogen use by 20%, applying just 120 kg per hectare compared to the conventional 150 kg, while maintaining statistically equivalent grain yields of 4.8 tons per hectare versus 4.7 tons under flat-rate farming.

Protein content—a critical quality metric for durum wheat’s end-use in pasta—reached 13.2% with NNI, slightly outperforming the conventional method’s 12.5%.

This marginal gain in protein translated to significant industrial advantages: dough produced from NNI-optimized wheat exhibited a W-index (a measure of gluten strength) of 280, far surpassing the 240 observed in conventional wheat.

Such improvements stemmed from NNI’s ability to synchronize nitrogen availability with crop developmental stages, ensuring optimal nutrient partitioning during grain filling.

The Hidden Costs of NDVI-Based Approaches

The NDVI-based strategies, while innovative, revealed critical limitations. The proportional NDVIH approach, which allocated N based on canopy greenness, increased protein content to 13.8% but reduced yields to 4.5 tons per hectare—a 6% drop compared to NNI.

This paradox arose from over-fertilization in already nitrogen-rich zones, where excessive vegetative growth diverted energy from grain production.

The compensative NDVIL method, designed to boost struggling crop areas, achieved the highest yield (5.1 tons/ha) but at a steep environmental cost: it required 160 kg N per hectare, leading to a 33% surge in nitrous oxide emissions (1.4 kg CO2-equivalent per kg of grain) compared to NNI’s 0.8 kg.

These emissions matter profoundly—nitrous oxide has 265 times the global warming potential of carbon dioxide over a century.

Economically, NNI emerged as the clear winner. Farmers adopting this strategy achieved a net return of €220 per hectare, 12% higher than the conventional method’s €196. This advantage stemmed from two factors: reduced fertilizer costs (€98/ha vs. €123/ha) and premium pricing for high-protein grain.

The study introduced a novel “social cost” metric—a comprehensive measure of environmental damage, public health impacts from water pollution, and long-term soil degradation. NNI’s social cost totaled €42 per hectare, dwarfed by conventional farming’s €60. NDVIH and NDVIL posted intermediate costs of €58 and €55, respectively, reflecting their imbalanced nitrogen distribution.

Delving deeper into environmental metrics, nitrogen fertilizer use efficiency (NfUE)—the percentage of applied N converted into harvestable grain—reached 65% under NNI, a stark improvement over the 52% efficiency of conventional methods. This leap translated to an 18% reduction in nitrate leaching, protecting local aquifers from contamination.

Over the four-year study, fields under NNI lost just 12 kg of nitrogen per hectare annually to leaching, compared to 22 kg in conventional plots. For context, the EU’s Nitrates Directive mandates groundwater nitrate concentrations below 50 mg/L—a threshold exceeded in 30% of conventional plots but only 8% of NNI-managed areas.

Scaling NNI: Challenges and Policy Interventions

The research also illuminated hidden climate benefits. Using life cycle assessment (LCA) methodology, the team calculated that NNI’s carbon footprint totaled 0.8 kg CO2-equivalent per kg of grain, 33% lower than conventional farming’s 1.2 kg.

This reduction primarily stemmed from decreased fertilizer production emissions (1.2 kg CO2-eq/kg N avoided) and lower nitrous oxide releases from soils. If scaled across the EU’s 2.4 million hectares of durum wheat farmland, widespread NNI adoption could slash annual emissions by 960,000 metric tons of CO2-equivalent—equivalent to removing 208,000 cars from roads.

However, the study cautions against viewing precision agriculture as a panacea. The NNI method’s success hinges on continuous access to high-quality satellite data and advanced machinery capable of variable-rate application—infrastructure gaps in developing regions.

For instance, the Sentinel-2 satellites revisit each location every five days, but cloud cover during critical growth stages can disrupt data collection. Moreover, the algorithms require calibration to local conditions; in this study, NNI thresholds were fine-tuned to Mediterranean climates, achieving 92% accuracy in nitrogen status prediction.

Applying the model to arid regions or heavy clay soils without recalibration could reduce accuracy to 70–75%.

The human factor proves equally critical. Farmers transitioning to NNI need training to interpret spectral indices—for example, understanding that NDVI values above 0.7 often signal over-vegetation and warrant reduced N.

The research team estimates that a 10% increase in farmer literacy on precision tools could boost NfUE by 4–6 percentage points. Policy interventions will likely prove essential: subsidizing soil sensors, funding agronomist-led workshops, and incentivizing cooperatives to share machinery could democratize access.

Looking ahead, the study’s implications extend far beyond durum wheat. The NNI framework, when adapted to crops like maize or rice, could address the 60 million tons of excess nitrogen applied globally each year—a key target of the UN Sustainable Development Goals.

Preliminary trials in Spain’s barley fields show similar yield stability with 18% less N, suggesting cross-crop applicability. For researchers, integrating machine learning with satellite data presents a promising frontier: early models can now predict nitrogen demands with 95% accuracy 30 days pre-application, enabling proactive rather than reactive management.

Conclusion

In conclusion, this research transcends academic circles, offering a blueprint for reconciling agricultural productivity with planetary health.

By reducing nitrogen use by 20%, boosting farmer profits by 12%, and slashing greenhouse gas emissions by a third, the NNI method demonstrates that sustainability and profitability are not mutually exclusive. As climate change intensifies droughts and destabilizes growing seasons, such precision strategies will prove indispensable.

The challenge now lies in transforming this scientific validation into on-ground action—through policy reform, technological democratization, and a paradigm shift in how we view fertilizers: not as blunt tools, but as precision instruments in the quest for food security.

Reference: Fabbri, C., Delgado, A., Guerrini, L., & Napoli, M. (2025). Precision nitrogen fertilization strategies for durum wheat: a sustainability evaluation of NNI and NDVI map-based approaches. European Journal of Agronomy, 164, 127502.

Visualizing Economic Impacts of Sustainable Farming Using GeoPard in Precision Agriculture

Researchers from Bayerische Landesanstalt für Landwirtschaft (LfL) and GeoPard Agriculture teamed up to look into the economics of strip-intercropping systems for sustainable farming. They shared their findings at the University of Hohenheim’s event on “Promote Biodiversity through Digital Agriculture,” focusing on eco-friendly farming practices and their financial impacts.

Their project, “Future Crop Farming,” aimed to explore new ways of farming, with a special focus on strip-intercropping. This technique involves growing different crops side by side in strips within the same field, which could reduce the need for chemicals and increase biodiversity. The researchers wanted to find ways to make farming more eco-friendly while still being profitable for farmers.

Led by Olivia Spykman and Markus Gandorfer from LfL, along with Victoria Sorokina from GeoPard, this collaboration started during the EIT Food Accelerator program. Using their knowledge in farming, digital tools, and data analysis, they set out to study the economic side of sustainable farming practices.

While addressing the reduction of synthetic inputs and the increase of biodiversity they found that the ecological potential of strip-intercropping is well-researched. However, its mechanization and labor economics, especially with autonomous equipment, require further evaluation.

They found that farmers were unsure about its practicality, especially with new technology. To address this, they talked with farmers at a strip-intercropping field lab to understand their concerns and communicate better.

Furthermore, changes to the landscape can make farmers hesitant, so providing clear information upfront is important. Therefore, digital tools, like visualizations, can facilitate communication between farmers and their communities, generating acceptance and appreciation for ecologically beneficial landscape transformations.

For example, in New Zealand, farmers used virtual reality (VR) goggles to visualize suitable areas for afforestation, aiding farm-scale planning by illustrating impacts on farm profitability, landscape aesthetics, and rural communities. Such visualizations can enhance farmers’ understanding and interest in landscape changes, though successful implementation also depends on farmers’ self-confidence.

Similarly, in this research, the cloud-based program GeoPard was used to analyze a strip intercropping production system from multiple perspectives. GeoPard’s equations were parametrized with empirical data from the Future Crop Farming project. Initial results include visualizations of herbicide and nitrogen input and yield output, with more complex calculations planned.

Herbicide application map displaying

Furthermore, the system integrated various data sources, including:

  • Yield and applied-input datasets
  • Price information for crops and plant protection (provided by the user)
  • Satellite imagery (Sentinel-2, Landsat, Planet)
  • Topography data
  • Zone maps of historical data available in GeoPard

Meanwhile, the main techniques utilized involved spatial analysis and efficient handling of spatial data using the NumPy framework. Data was sourced from .xlsx and .shp files. However, the shape file lacked specific details about individual strips, necessitating the integration of various data formats.

GeoPard facilitated organizing data spatially to link strip-specific details with their respective locations in the field. Hence, the integrated dataset, displaying the strips, formed the basis for the descriptive trial analysis in GeoPard.

Although the research didn’t examine variable-rate application of inputs, GeoPard’s high-resolution mapping (pixel size: 3×3 meters) enabled detailed visualization at the pixel level, adding complexity. This detailed mapping is valuable for future applications, like combining multiple layers or integrating more spatially variable information such as ‘yield profiles’ based on small-scale yield data collected by plot combines in the research project.

Yield-per-crop map in full view and zoomed-in to show pixel-level details

Researchers have also discovered that although GeoPard has primarily served descriptive functions, it possesses the potential for more complex visualizations. For example, incorporating sub strip-level yield data and price information could help create profit maps, showing edge effects between neighboring crop strips.

Furthermore, integrating labor economic data could reveal the impacts of reducing economies of scale to promote biodiversity. Such data can aid scenario modeling, allowing exploration of various crop rotations, strip widths, and mechanization types, focusing on field-specific outcomes to improve agricultural management and decision-making.

Hence, the setup could function as a digital twin, with real-time data transfer from field machines and sensors to GeoPard, a capability already achievable with some commercial technologies and satellite data. However, farmers’ concerns about technology compatibility emphasize the need to integrate additional data sources for broader applicability.

Satellite Imagery Reveals 60% Decline in Opium Poppy Cultivation

In the northeastern state of Manipur, a significant decline in opium poppy cultivation has been recorded, marking a notable victory in the ongoing battle against the illicit trade. According to data from the Manipur Remote Sensing Applications Centre (MARSAC), the total area under opium poppy cultivation has plummeted by 60% since 2021.

This remarkable decrease, revealed through satellite imagery technology and ground verification, sheds light on the effectiveness of concerted efforts by both the state government and law enforcement agencies in curbing this menace.

MARSAC, an autonomous government institution operating under the planning department, has been instrumental in visualizing geographic data pertaining to opium poppy cultivation in Manipur.

Utilizing advanced satellite imagery technology provided by reputable entities such as the Indian Space Research Organisation (ISRO) and NASA, MARSAC meticulously mapped opium poppy cultivation across Manipur between September 2021 and January 2024, spanning multiple crop cycles.

The latest report submitted by MARSAC to the Manipur government in early March not only quantifies the decline in opium poppy cultivation but also provides empirical evidence of the impact of the state’s “war on illicit trade” campaign spearheaded by Chief Minister N Biren Singh.

The campaign, initiated in June 2018, has seen a sustained drive to eradicate opium poppy cultivation, resulting in tangible progress over the years.

One of the key findings of the report is the substantial reduction in opium poppy cultivation clusters across the state. During the survey period, MARSAC identified these clusters in various districts of Manipur, with notable decreases observed in areas such as Kangpokpi, Churachandpur, and Tamenglong.

Opium Poppy Cultivation Districts wise farm data

The concerted efforts of law enforcement agencies, particularly in remote border regions susceptible to trafficking, have played a pivotal role in disrupting the supply chain of illicit drugs.

While the exact factors contributing to the decline in opium poppy cultivation are not explicitly outlined in the report, senior officials in the forest department and the NAB attribute it to the sustained enforcement actions undertaken in recent years.

The heightened vigilance in border areas, coupled with the systematic destruction of poppy fields, has undoubtedly deterred illicit activities and disrupted the profitability of opium cultivation.

The significance of satellite imagery technology in monitoring and combating opium poppy cultivation cannot be overstated. By leveraging resources such as the LISS-IV satellite imagery from ISRO and multispectral instruments like Sentinel-2A, MARSAC has been able to accurately identify and track poppy plantations across Manipur.

This technology, complemented by ground verification efforts, ensures the reliability and accuracy of the data presented in the report.

Furthermore, the MARSAC report highlights the adverse environmental impacts associated with opium poppy cultivation, including deforestation, soil erosion, and loss of biodiversity. While these consequences underscore the urgent need for sustainable alternatives, it is imperative to address the root causes driving farmers to engage in illicit cultivation practices.

The socio-economic dynamics of opium poppy cultivation reveal a complex interplay of factors, with poverty and lack of viable alternatives often driving marginalized farmers into this illicit trade.

Efforts to combat opium cultivation must therefore be accompanied by comprehensive initiatives aimed at providing farmers with alternative livelihood options, as highlighted by experts and researchers familiar with the situation in Manipur.

In conclusion, the significant decline in opium poppy cultivation in Manipur reflects a promising step towards addressing the challenges posed by the illicit trade. The collaborative efforts of government institutions, law enforcement agencies, and civil society stakeholders have yielded tangible results, underscoring the importance of sustained intervention strategies and holistic approaches to tackle this multifaceted issue.

Automated Yield Data Cleaning and Calibration

Automated Yield Data Cleaning and Calibration (AYDCC) is a process that uses algorithms and models to detect and correct errors in yield data, such as outliers, gaps, or biases. AYDCC can improve the quality and reliability of yield data, which can lead to better insights and recommendations for farmers.

Introduction to Yield Data

Yield data is one of the most important sources of information for farmers in the 21st century. It refers to the data collected from various farm machinery, such as combines, planters, and harvesters, that measure the quantity and quality of crops produced in a given field or area.

It holds immense importance for several reasons. Firstly, it aids farmers in making informed decisions. Armed with detailed yield data, farmers can fine-tune their practices to maximize productivity.

For instance, if a specific field consistently produces lower yields, farmers can investigate the underlying causes, such as soil health or irrigation issues, and take corrective measures.

Furthermore, it enables precision agriculture. By mapping variations in crop performance across their fields, farmers can tailor their input applications, such as fertilizers and pesticides, to specific areas. This targeted approach not only optimizes resource use but also reduces environmental impacts.

According to the Food and Agriculture Organization (FAO), global agricultural production needs to increase by 60% by 2050 to meet the growing demand for food. Yield data, through its role in enhancing crop productivity, is instrumental in achieving this target.

Furthermore, in Brazil, a soybean farmer used yield data along with soil sampling data to create variable-rate fertilizer maps for his fields. He applied different rates of fertilizer according to the soil fertility and yield potential of each zone.

He also used yield data to compare different soybean varieties and select the best ones for his conditions. As a result, he increased his average yield by 12% and reduced his fertilizer costs by 15%.

Similarly, in India, a rice farmer also used yield datasets along with weather data to adjust his irrigation schedule for his fields. He monitored the soil moisture levels and rainfall patterns using sensors and satellite imagery.

understanding and utilization of yield data

He also used it to compare different rice varieties and select the best ones for his conditions. As a result, he increased his average yield by 10% and reduced his water use by 20%.

Despite its benefits, yield data still faces some challenges in terms of its development and adoption. Some of these challenges are:

  • Data quality: Its accuracy and reliability depends on the quality of the sensors, the calibration of the machinery, the data collection methods, and the data processing and analysis techniques. Poor data quality can lead to errors, biases, or inconsistencies that can affect the validity and usefulness of the data.
  • Data access: The availability and affordability of yield data depend on the access to and ownership of the farm machinery, the sensors, the data storage devices, and the data platforms. Lack of access or ownership can limit the ability of farmers to collect, store, share, or use their own data.
  • Data privacy: Its security and confidentiality depends on the protection and regulation of the data by the farmers, the machinery manufacturers, the data providers, and the data users. Lack of protection or regulation can expose the data to unauthorized or unethical use, such as theft, manipulation, or exploitation.
  • Data literacy: The understanding and utilization of yield data depend on the skills and knowledge of the farmers, the extension agents, the advisors, and the researchers. Lack of skills or knowledge can hinder the ability of these actors to interpret, communicate, or apply the data effectively.
gathering datasets using farm machines like harvesters

Therefore, to overcome these challenges and realize the full potential of yield data, it is important to cleaning and calibrate the yield data.

Introduction to yield data cleaning and calibration

Yield data are valuable sources of information for farmers and researchers who want to analyze crop performance, identify management zones, and optimize decision-making. However, it often require cleaning and calibration to ensure their reliability and accuracy.

Calibrating the “YieldDataset” is a functionality that corrects the distribution of values in alignment with mathematical principles, enhancing the overall integrity of the data. It bolsters the quality of decision-making and renders the dataset valuable for further in-depth analysis.

GeoPard Yield Clean-Calibration Module

GeoPard made it possible to clean and correct yield datasets using its Yield Clean-Calibration module.

We’ve made it easier than ever to enhance the quality of your yield datasets, empowering farmers to make data-driven decisions that you can rely on.

GeoPard - Yield Cleaning & Calibration, similar to Field Potential zones

After calibration and cleaning, the resulting yield dataset becomes homogeneous, without outliers or abrupt changes between neighboring geometries.

With our new module, you can:

Select an option to proceed
  • Remove corrupted, overlapped, and subnormal data points
  • Calibrate yield values across multiple machines
  • Start calibration with just a few clicks (simplifying your user experience) or execute the associated GeoPad API endpoint

Some of the most common use cases of automated yield data cleaning and calibration include:

  • Synchronizing data when multiple harvesters have worked either simultaneously or over several days, ensuring consistency.
  • Making the dataset more homogeneous and accurate by smoothing out variations.
  • Removing data noise and extraneous information that can cloud insights.
  • Eliminating turnarounds or abnormal geometries, which may distort the actual patterns and trends in the field.

In the picture below, you can see a field where 15 harvesters worked at the same time. It shows how the original yield dataset and the improved dataset after calibration with GeoPard yield clean-calibration module look quite different and easy to understand.

difference between the original and improved yield datasets with GeoPard's Calibration Module

Why is it important to clean and calibrate?

Yield data are collected by yield monitors and sensors that are attached to harvesters. These devices measure the mass flow rate and moisture content of the harvested crop, and use GPS coordinates to georeference the data.

However, these measurements are not always accurate or consistent, due to various factors that can affect the performance of the equipment or the crop conditions. Some of these factors are:

1. Equipment variations: Farm machinery, such as combines and harvesters, often have inherent variations that can lead to discrepancies in data collection. These variations might include differences in sensor sensitivity or machinery calibration.

For example, some yield monitors may use a linear relationship between voltage and mass flow rate, while others may use a nonlinear one. Some sensors may be more sensitive to dust or dirt than others. These variations can cause discrepancies in yield data across different machines or fields.

Example 1 U-turns, Stops, Half Equipment Width Used
Example 2 U-turns, Stops, Half Equipment Width Used

2. Environmental factors: Weather conditions, soil types, and topography play significant roles in crop yields. If not accounted for, these environmental factors can introduce noise and inaccuracies into yield data.

For instance, sandy soils or steep slopes may cause lower yields than loamy soils or flat terrains. Likewise, areas with higher crop density may have higher yields than areas with lower density.

3. Sensor inaccuracies: Sensors, despite their precision, are not infallible. They may drift over time, providing inaccurate readings if not regularly calibrated.

For example, a faulty load cell or a loose wiring may cause inaccurate mass flow rate readings. A dirty or damaged moisture sensor may give erroneous moisture content values. A wrong field name or ID entered by the operator may assign yield data to the wrong field file.

These factors can result in yield datasets that are noisy, erroneous, or inconsistent. If these data are not cleaned and calibrated properly, they can lead to misleading conclusions or decisions.

For example, using uncleaned yield data to create yield maps may result in false identification of high- or low-yielding areas within a field.

Why is it important to clean and calibrate yield dataset

Using uncalibrated yield datasets to compare yields across fields or years may result in unfair or inaccurate comparisons. Using uncleaned or uncalibrated yield data to calculate nutrient balances or crop inputs may result in over- or under-application of fertilizers or pesticides.

Therefore, it is essential to perform yield data cleaning and calibration before using them for any analysis or decision-making purpose. Yield datasets cleaning is the process of removing or correcting any errors or noise in the raw yield data collected by the yield monitors and sensors.

Automated methods for cleaning and calibrating yield data

This is where automated data cleaning techniques come in handy. Automated data cleaning techniques are methods that can perform data cleaning tasks without or with minimal human intervention.

Configure the Calibrate step
Automated methods for cleaning and calibrating

Automated data cleaning techniques can save time and resources, reduce human errors, and enhance the scalability and efficiency of data cleaning. Some of the common automated data cleaning techniques for yield data are:

1. Outlier Detection: Outliers are data points that deviate significantly from the norm. Automated algorithms can identify these anomalies by comparing data points to statistical measures such as mean, median, and standard deviation.

For example, if a yield dataset shows an exceptionally high harvest yield for a particular field, an outlier detection algorithm can flag it for further investigation.

2. Noise Reduction: Noise in yield data can arise from various sources, including environmental factors and sensor inaccuracies.

Automated noise reduction techniques, such as smoothing algorithms, filter out erratic fluctuations, making the data more stable and reliable. This helps in identifying true trends and patterns in the data.

3. Data Imputation: Missing data is a common issue in yield data sets. Data imputation techniques automatically estimate and fill in missing values based on patterns and relationships within the data.

For instance, if a sensor fails to record data for a specific time period, imputation methods can estimate the missing values based on adjacent data points.

Hence, automated data cleaning techniques serve as the gatekeepers of data quality, ensuring that yield datasets remain a reliable and valuable asset for farmers worldwide.

Furthermore, there are lots of handy tools and computer programs that can automatically clean and adjust yield data, and GeoPard is one of them. The GeoPard Yield Clean-Calibration Module, along with similar solutions, is super important for making sure the data is accurate and reliable.

GeoPard - Yield Cleaning & Calibration - 3 harvesters

Conclusion

Automated Yield Data Cleaning and Calibration (AYDCC) is essential in precision agriculture. It ensures the accuracy of crop data by removing errors and enhancing quality, enabling farmers to make informed decisions. AYDCC addresses data challenges and utilizes automated techniques for trustworthy results. Tools like GeoPard’s Yield Clean-Calibration Module simplify this process for farmers, contributing to efficient and productive farming practices.

Applications of (GIS) Geoinformatics in Agriculture

Geoinformatics (GIS) bridges the gap between spatial data and agriculture decision-making, allowing farmers to optimize resource utilization while minimizing environmental impact. This technology-driven approach helps tailor precision agriculture practices to specific field conditions, thus increasing productivity and efficiency.

Geoinformatics in Agriculture

By analyzing precise spatial information, such as soil variability, moisture content, and pest distribution, farmers can make well-informed choices, ensuring that each area of their land receives the exact treatment it requires.

Recent data shows that this technology is widely used, with over 70% of farms using it in some capacity. Geospatial data integration is becoming a standard practice in decision-making processes across a range of industries, from small-scale subsistence farming to major commercial operations.

Farmers are able to keep an eye on their crops in real time using satellite photography and ground sensors. With less waste and a smaller negative influence on the environment, they may use this to apply water, fertilizer, and pesticides precisely where and when they are needed.

The CottonMap project in Australia uses geoinformatics to monitor water use, resulting in a 40% decrease in water consumption. Enhanced resource management minimizes environmental impact by reducing chemical runoff and over-irrigation.

geoinformatics in agriculture

Increased productivity aids global food security. By optimizing planting patterns using spatial data, farmers can achieve higher crop yields without expanding agricultural land.

What is Geoinformatics?

Geoinformatics, also known as geographic information science (GIScience), is a multidisciplinary field that combines elements of geography, cartography, remote sensing, computer science, and information technology to gather, analyze, interpret, and visualize geographical and spatial data.

It focuses on capturing, storing, managing, analyzing, and presenting spatial information in digital forms, contributing to a better understanding of the Earth’s surface and the relationships between various geographic features. It is a powerful tool that can be used for a variety of purposes, including:

1. Precision agriculture: It can be used to collect data on a variety of factors, such as soil type, crop yield, and pest infestation. This data can then be analyzed to identify areas of variability within a field. Once these areas have been identified, farmers can use GIS to develop customized management plans for each area.

2. Environmental monitoring: It can be used to monitor changes in the environment, such as deforestation, land use change, and water quality. This data can then be used to track the progress of environmental policies and to identify areas that need further protection.

3. Urban planning: Geoinformatics can be used to plan and manage urban areas. This data can be used to identify areas that are in need of development, to plan transportation networks, and to manage infrastructure.

4. Disaster management: It can be used to manage disasters, such as floods, earthquakes, and wildfires. This data can be used to track the progress of a disaster, to identify areas that have been affected, and to coordinate relief efforts.

what is Geoinformatics? Components of Geoinformatics

Components of Geoinformatics

These components work together to provide insights into various aspects of the Earth’s surface and its relationships. Here are the main components of geoinformatics:

  • Geographic Information Systems (GIS): GIS involves the use of software and hardware to collect, store, manipulate, analyze, and visualize geographic data. This data is organized into layers, allowing users to create maps, conduct spatial analysis, and make informed decisions based on spatial relationships.
  • Remote Sensing: Remote sensing involves the collection of information about the Earth’s surface from a distance, typically using satellites, aircraft, or drones. Remote sensing data, often in the form of imagery, can provide insights into land cover, vegetation health, climate patterns, and more.
  • Global Positioning Systems (GPS): GPS technology enables accurate positioning and navigation through a network of satellites. In GIS, GPS is used to collect precise location data, which is crucial for mapping, navigation, and spatial analysis.
  • Spatial Analysis: It enables the application of various spatial analysis techniques to understand patterns, relationships, and trends within geographic data. These techniques include proximity analysis, interpolation, overlay analysis, and network analysis.
  • Cartography: Cartography involves the creation of maps and visual representations of geographic data. It provides tools and methods to design informative and visually appealing maps that effectively communicate spatial information.
  • Geodatabases: Geodatabases are structured databases designed to store and manage geographic data. They provide a framework for organizing spatial data, allowing for efficient storage, retrieval, and analysis.
  • Web Mapping and Geospatial Applications: Geoinformatics has expanded into web-based mapping and applications, allowing users to access and interact with geographic data through online platforms. This has led to the development of various location-based services and tools.
  • Geospatial Modeling: Geospatial modeling involves the creation of computational models to simulate real-world geographic processes. These models help predict outcomes, simulate scenarios, and aid decision-making in various fields.

8 Applications and Uses of Geoinformatics in Agriculture

Here are some of the key applications and uses of GIS in agriculture:

1. Precision Farming

Precision Agriculture harnesses the power of Geographic Information Systems (GIS) to provide farmers with intricate insights into their fields. These insights range from detailed vegetation and productivity maps to crop-specific information.

The heart of this approach lies in data-driven decision-making, empowering farmers to optimize their practices for maximum yield and efficiency.

Uses of Geoinformatics in Agriculture

Through the generation of productivity maps, GeoPard Crop Monitoring provides a crucial solution for Precision Agriculture. These maps make use of historical information from prior years, enabling farmers to identify productivity patterns throughout their farms. Farmers can identify fruitful and unproductive locations by using these information.

2. Crop Health Monitoring

The significance of monitoring crop health cannot be overstated. The well-being of crops directly impacts yields, resource management, and the overall health of the agricultural ecosystem.

Traditionally, manual inspection of crops across expansive fields was arduous and time-consuming. However, with the advent of advanced technologies like GIS and remote sensing, a transformative shift has occurred, enabling precision monitoring on an unprecedented scale.

Geoinformatics aids in the early detection of potential issues affecting crop health. By analyzing remote sensing data and satellite imagery, farmers can identify stressors like nutrient deficiencies or disease outbreaks, allowing for targeted interventions.

3. Crop Yield Prediction

By integrating historical data, soil composition, weather patterns, and other variables, It enables farmers to predict crop yields with remarkable accuracy. This information empowers them to make informed decisions regarding planting, resource allocation, and marketing strategies.

zones 2019 yield data map

In the field of predicting crop yields, GeoPard has become a leading innovator. GeoPard has developed a trustworthy method that claims an excellent accuracy rate of over 90% by combining historical and current crop data obtained from satellites. This innovative approach is proof of how technology may revolutionize contemporary agriculture.

4. Livestock Monitoring With Geoinformatics

Spatial data from GPS trackers on livestock offers insights into animal movements and behavior. These tools empower farmers to pinpoint the exact location of livestock within the farm, ensuring efficient management and care.

Beyond location tracking, GIS agriculture tools provide a comprehensive view of livestock health, growth patterns, fertility cycles, and nutritional requirements.

The global market for precision agriculture, which includes livestock monitoring, is projected to reach a substantial valuation by the coming years. This trend underscores the transformative potential of GIS in optimizing livestock management.

5. Insect and Pest Control

Traditional methods, such as manual scouting of large fields, have proven both time-consuming and inefficient. However, the convergence of technology, specifically deep learning algorithms and satellite data, has brought about a revolution in pest detection and management.

Geoinformatics helps in creating pest distribution maps, enabling precise application of pesticides. By targeting specific areas, farmers can minimize chemical usage, reduce environmental impact, and protect beneficial insects.

GeoPard Crop Monitoring is an effective method for spotting a variety of threats, such as weed infestations and crop diseases. Potential issue regions are detected by the study of field-collected vegetation indices.

For example, a low vegetation index value in a particular location may be a sign of potential pests or diseases. This realization simplifies the procedure and eliminates the need for time-consuming manual reconnaissance of large fields.

6. Irrigation Control

GIS-driven data provides valuable insights into soil moisture levels, helping farmers make informed decisions regarding irrigation scheduling. This ensures water efficiency and prevents overwatering or drought stress.

The Importance of Variable Rate Irrigation

GIS technology for agriculture provides a potent toolbox for spotting crops that are under water stress. Farmers can learn more about the water state of their crops by using indices like the Normalized Difference Water Index (NDWI) or the Normalized Difference Moisture Index (NDMI).

The default component of GeoPard Crop Monitoring, the NDMI index, offers a scale from -1 to 1. Water shortages are indicated by negative values around -1, but waterlogging may be indicated by positive values close to 1.

7. Flooding, Erosion, and Drought Control

Flooding, erosion, and drought represent formidable adversaries that can inflict substantial damage on agricultural landscapes. Beyond physical destruction, these challenges disrupt water availability, soil health, and overall crop productivity. Effectively managing these threats is pivotal to ensuring food security, preserving natural resources, and fostering sustainable farming practices.

Geoinformatics aids in assessing landscape vulnerabilities to flooding, erosion, and drought. By analyzing topographical data, rainfall patterns, and soil characteristics, farmers can implement strategies to mitigate these risks.

8. GIS in Farming Automation

Geographic Information Systems (GIS) have transcended their traditional role as mapping tools to emerge as critical enablers in guiding automated machinery. This technology empowers various agricultural equipment, such as tractors and drones, with spatial data and precision navigation systems.

As a result, tasks that range from planting to spraying and harvesting can be executed with unprecedented accuracy and minimal human intervention.

GIS in Farming Automation

Imagine a scenario where a tractor is tasked with planting crops across a vast field. Equipped with a GPS system and GIS technology, the tractor utilizes spatial data to navigate along predetermined routes, ensuring consistent seed placement and optimal spacing. This precision not only enhances crop yield but also minimizes resource wastage.

Role of Geoinformatics in Precision Agriculture

It plays a critical role in precision agriculture by providing farmers with the data and tools they need to make informed decisions about crop management. It can be used to collect data on a variety of factors, such as soil type, crop yield, and pest infestation.

This data can then be analyzed to identify areas of variability within a field. Once these areas have been identified, farmers can use GIS to develop customized management plans for each area.

The use of geoinformatics in precision agriculture is growing rapidly around the world. In the United States, for example, the use of precision agriculture has increased by more than 50% in the past five years. And in China, the use of precision agriculture is expected to grow by more than 20% per year in the coming years.

Studies have revealed that precision application of inputs through Geoinformatics techniques can lead to yield increases of up to 15% while reducing input costs by 10-30%.

Furthermore, a study published in the journal Nature in 2020 found that using GIS to manage water irrigation in a wheat field resulted in a 20% increase in crop yield. Another study, published in the journal Science in 2021, found that using GIS to apply fertilizer more precisely in a corn field resulted in a 15% increase in crop yield.

It can also be used to create maps of crop yield. These maps can be used to identify areas of low yield, which can then be investigated to determine the cause of the problem. Once the cause of the problem has been identified, farmers can take corrective action to improve yields in those areas.

Role of Geoinformatics in Precision Agriculture

For example, farmers can use it to create maps of soil type and fertility. These maps can then be used to target fertilizer applications more precisely, which can help to improve crop yields and reduce the amount of fertilizer that is applied unnecessarily.

In addition to collecting and analyzing data, it can also be used to visualize spatial data. This can be helpful for farmers to see how different factors, such as soil type and crop yield, are distributed across a field. Visualization tools can also be used to help farmers communicate their findings to others, such as crop consultants or government officials.

The real-world applications of geoinformatics in precision agriculture are abundant. For instance, Variable Rate Technology (VRT) employs spatial data to deliver varying amounts of inputs like water, fertilizers, and pesticides across a field.

This approach ensures that crops receive the exact nutrients they need, optimizing growth and yield. In another instance, satellite imagery and drones provide valuable insights into crop health and disease detection, enabling prompt intervention.

GeoPard Crop Monitoring As An Example Of Agriculture GIS Software

It’s crucial to keep in mind that the GIS software used in agriculture can differ depending on its intended use. While some tools indicate soil moisture levels to aid with planting selections, others display crop varieties, yields, and distributions.

Even comparing the economics of logging against forestry can be done with the use of various applications. Each farmer or agriculture manager must therefore discover the ideal GIS solution that provides them with the information they need to make wise decisions on their land.

When it comes to field data, GeoPard’s Crop Monitoring platform has a number of advantages. It offers summaries of vegetation and soil moisture dynamics, historical vegetation and weather data, and precise 14-day weather forecasts.

GeoPard provides automated synchronization of crop monitoring

This platform provides capabilities like scouting to organize activities and exchange real-time information, as well as a field activity log for planning and monitoring operations, so it offers more than just GIS-based data.

Data from additional sources is also included in GeoPard’s Crop Monitoring. The Data Manager tool, for instance, incorporates machine data into the platform. It supports popular file formats as SHP and ISO-XML.

You can measure crop yield using data from field machines, compare it to fertilizer maps, examine fertilizer tactics, and create plans to increase yield. The organizations that agricultural enterprises collaborate with and themselves benefit greatly from this all-in-one platform.

Challenges in Precision Agriculture and Geoinformatics

The integration of Precision Agriculture and Geoinformatics introduces a host of policy implications and regulatory considerations. Governments worldwide grapple with devising frameworks that foster innovation while safeguarding data privacy, land use, and environmental sustainability.

For instance, regulations may govern the collection and sharing of spatial data, intellectual property rights for precision farming technologies, and ethical use of AI in agriculture.

In the European Union, the Common Agricultural Policy (CAP) acknowledges the role of digital technologies, including Geoinformatics, in enhancing agricultural productivity.

Financial incentives are provided to encourage farmers to adopt precision farming practices that align with environmental and sustainability goals. This example illustrates how policy can drive technology adoption for collective benefit.

However, the adoption of geoinformatics technologies in agriculture presents significant benefits, yet it’s accompanied by challenges, particularly for farmers of varying scales. Small-scale farmers often face financial limitations, lacking the resources for technology acquisition and training.

Larger operations encounter data management complexities due to the scale of their activities. Technical knowledge gaps are common, with both small and large farmers requiring training to effectively utilize geoinformatics tools.

Limited infrastructure and connectivity hinder access, especially in remote areas. Customization struggles arise, as solutions may not fit small farms or integrate seamlessly into larger operations.

Cultural resistance to change and concerns over data privacy affect adoption universally. Government policies, ROI uncertainties, and interoperability issues further impede progress.

Addressing these challenges will demand tailored strategies to ensure that geoinformatics benefits all farmers, regardless of scale.

Conclusion

The seamless integration of Geoinformatics into modern agriculture holds transformative potential. By harnessing the power of spatial data, farmers and agricultural stakeholders can make informed decisions, optimize resource utilization, and foster sustainable practices. Whether it’s predicting crop yields, managing water resources, or enhancing precision agriculture, GIS emerges as a guiding light, shaping a more efficient, resilient, and productive future for the world of farming.

Utilizing GPS Technology to Optimize Cover Crop Cultivation

The agricultural industry is experiencing a big change, with the adoption of modern technologies like GPS systems becoming more common.

This is especially noticeable in how farmers grow cover crops. GPS technology is revolutionizing the way they manage their fields, helping them become more efficient and sustainable in their agricultural practices.

Cover crops, sometimes called green manure, are plants grown primarily to improve soil health rather than for harvest. They are usually cultivated during the off-season and provide benefits like controlling weeds, enhancing biodiversity, and boosting soil fertility.

Yet, growing cover crops can be laborious and time-consuming. That’s where GPS technology comes in handy.

Incorporating GPS technology into farming brings numerous advantages. Firstly, it allows precision farming, where farmers can use GPS coordinates to create precise maps of their fields.

This helps them closely monitor crop growth and soil conditions. By relying on data, they can apply fertilizers and pesticides more accurately, reducing waste and minimizing harm to the environment.

Moreover, GPS technology greatly boosts the efficiency of planting cover crops. Conventional methods may lead to uneven distribution of seeds, leaving some areas poorly covered.

With GPS-guided machinery, farmers can ensure even distribution across the entire field, promoting better growth and soil coverage. This not only enhances the effectiveness of the cover crops but also reduces the need for labor and resources.

Additionally, GPS technology enables farmers to implement more effective crop rotation strategies. With precise field mapping and crop growth tracking, they can optimize soil health and productivity through well-planned rotations. This can result in higher yields over time, further improving agricultural efficiency.

Moreover, GPS technology plays a vital role in monitoring and managing pests and diseases. It allows farmers to track the location and spread of these problems, enabling them to take targeted actions for control. As a result, the use of broad-spectrum pesticides can be reduced, promoting a healthier and more sustainable agricultural system.

GPS technology offers benefits beyond just individual farmers when it comes to cover crop cultivation. It has the potential to encourage sustainable and efficient agricultural practices on a global scale.

By reducing waste and making the best use of resources, GPS technology can play a significant role in meeting the rising global food demand in an environmentally friendly manner.

However, using GPS technology in agriculture poses challenges for many farmers, such as expensive upfront costs and a lack of technical know-how. To tackle these hurdles, it is crucial to offer support to farmers.

This can be achieved through financial incentives, training programs, and the development of user-friendly software and equipment, enabling them to make the most of this technology effectively.

In conclusion, using GPS technology in cover crop cultivation has the potential to significantly improve agricultural efficiency. It allows for precise farming, better seeding practices, effective crop rotation, and enhanced pest and disease management. By offering the right support and resources, farmers can take advantage of GPS technology to create a more sustainable and productive agricultural sector.

Introducing GeoPard’s Profit Maps: A Step Forward in Precision Agriculture

The profit map from the example in the screenshot takes into account the as-applied datasets of fertilization, seeding, two times of crop protection application, and harvesting. Other expenses can be added to the calculation, such as land preparation, miscellaneous activities as well.

Precision agriculture is a data-driven approach that seeks to increase efficiency and profitability. GeoPard, a leading provider of precision agriculture solutions, is enhancing its data analysis capabilities with the introduction of Profit Maps.

This feature provides a visual representation of profitability at the subfield level, enabling more informed decision-making and resource allocation. You’ll be able to see at a glance where your fields are making you money and where the costs of inputs and changes aren´t paying off.

Profit Maps are generated by integrating various data layers, including as-applied seeding, crop protection application, fertilizer usage, and harvesting data. This information is sourced directly from agricultural equipment and the John Deere Operations Center.

GeoPard then applies a custom equation, factoring in the cost of each input, to calculate zone-level profitability. These profit maps provide a comprehensive view of the profit spread across different field zones.

One of the key features of GeoPard’s Profit Maps is the ability to display the spread in profit across different zones of a field. This is calculated in dollars/euros/any currency and provides a clear indication of how much profit a farmer is making in each specific area.

By having this information at their fingertips, farmers can make more informed decisions about where and how to use their agricultural inputs.

For instance, they might choose to invest more in areas with higher profitability or reconsider their strategies in zones with lower returns. This granularity level in data analysis sets GeoPard’s Profit Maps apart.

Vladimir Klinkov, Managing Director of GeoPard, emphasizes the transformative potential of this tool, stating, “These maps allow farmers to make more informed decisions about resource distribution and costs on each hectare of the field and plan their business more effectively.”

The practical application of Profit Maps is already being demonstrated in real-world scenarios. Eurasia Group Kazakhstan, an official John Deere dealer, has been leveraging this feature to optimize its operations.

Evgeniy Chesnokov, Director of Agricultural Management at Eurasia Group Kazakhstan LLP, shares his experience: “With the help of GeoPard Agriculture’s Profit Map, we were able to gain a deeper understanding of the profitability of our partners’ fields.

This allowed our farmers to make more strategic decisions on the allocation of resources, which ultimately increased operational efficiency and improved bottom line indicators.”

GeoPard’s Profit Maps represent a significant advancement in precision agriculture, providing farmers with the insights they need to optimize their operations and maximize profitability. As the industry continues to evolve, tools like these will play an increasingly important role in shaping the future of farming.

For more insights into the development and application of profitability maps in precision agriculture, you can explore these resources: Kansas State University, ASPEXIT, Chilean Journal of Agricultural Research, USDA, and ResearchGate.

Stay tuned for more updates as GeoPard continues to innovate and push the boundaries of what’s possible in precision agriculture.

About the companies:

GeoPard is a leading provider of precision farming software. The company was founded in 2019 in Cologne, Germany, and is represented globally. The company offers a range of solutions that help farmers optimize their operations and increase yields.

With a focus on sustainability and regenerative economics, GeoPard aims to promote precision farming practices around the world.

The company’s partners include such well-known brands as John Deere, Corteva Agriscience, ICL, Pfeifer & Langen, IOWA Soybean Association, Kernel, MHP, SureGrowth, and many others.

Eurasia Group Kazakhstan is the Kazakh representative office of Swiss company Eurasia Group AG, an official dealer of John Deere in the Republic of Kazakhstan and Kyrgyzstan since 2002. The company delivers solutions for agriculture from leading world manufacturers like JCB, Väderstad, GRIMME, and Lindsay, covering all areas of crop and horticulture.

Eurasia Group Kazakhstan pays great attention during all its activity to the technologies of precise agriculture, completing the line of machinery with products of digitalization of agriculture.

Eurasia Group Kazakhstan has an extensive regional network – 14 regional offices in Kazakhstan and one in Kyrgyzstan, more than 550 employees, of which almost half – after-sales service employees, its own department of agricultural management and digitalization.

Over the years, more than 13,000 units of equipment have been supplied to Kazakhstan and 4.4 million hectares of land have been digitized. This year the company celebrates its 25th anniversary.

wpChatIcon
wpChatIcon

    Request Free GeoPard Demo / Consultation


    By clicking the button you agree our Privacy Policy. We need it to reply to your request.

      Subscribe


      By clicking the button you agree our Privacy Policy

        Send us information


        By clicking the button you agree our Privacy Policy