How to Choose Your Soil Sampler? Key Decision Factors And Options

“You can’t manage what you don’t measure” — this holds especially true in agriculture, construction and environmental science. Soil sampling is the first step toward understanding soil health and ensuring the success of any land-based project. In fact, the global soil testing market is booming: it’s projected to grow from about $4.3 billion in 2025 to $6.9 billion by 2035 (CAGR ≈ 4.9%).

Farmers, landscapers, and engineers are all seeking better data on soil nutrients, compaction, and contaminants. But with so many samplers available, how do you pick the right one?

Define Your Application & Soil Type

Soil characteristics directly affect productivity, safety, and environmental outcomes. For instance, the UN Food and Agriculture Organization reports that poor soil fertility contributes to yield losses of up to 30% in smallholder farms worldwide.

Meanwhile, geotechnical surveys show that over 50% of construction failures in developing countries are linked to poor soil assessment. Choosing the right sampler for your application and soil type is the first step toward avoiding these risks.

What will you use the samples for? Different fields require different sampler features. Consider these scenarios:

1. Agriculture & Lawn Care: Typically the goal is nutrient and pH analysis of topsoil. Farmers and gardeners often take many small cores across a field (e.g. 15–20 samples per 4–5 hectares) and mix them into one composite sample. This composite is tested for pH and key nutrients to guide fertilization. For this purpose, a simple hand probe or auger is often enough. Since the samples will be mixed, preserving soil layers isn’t important.

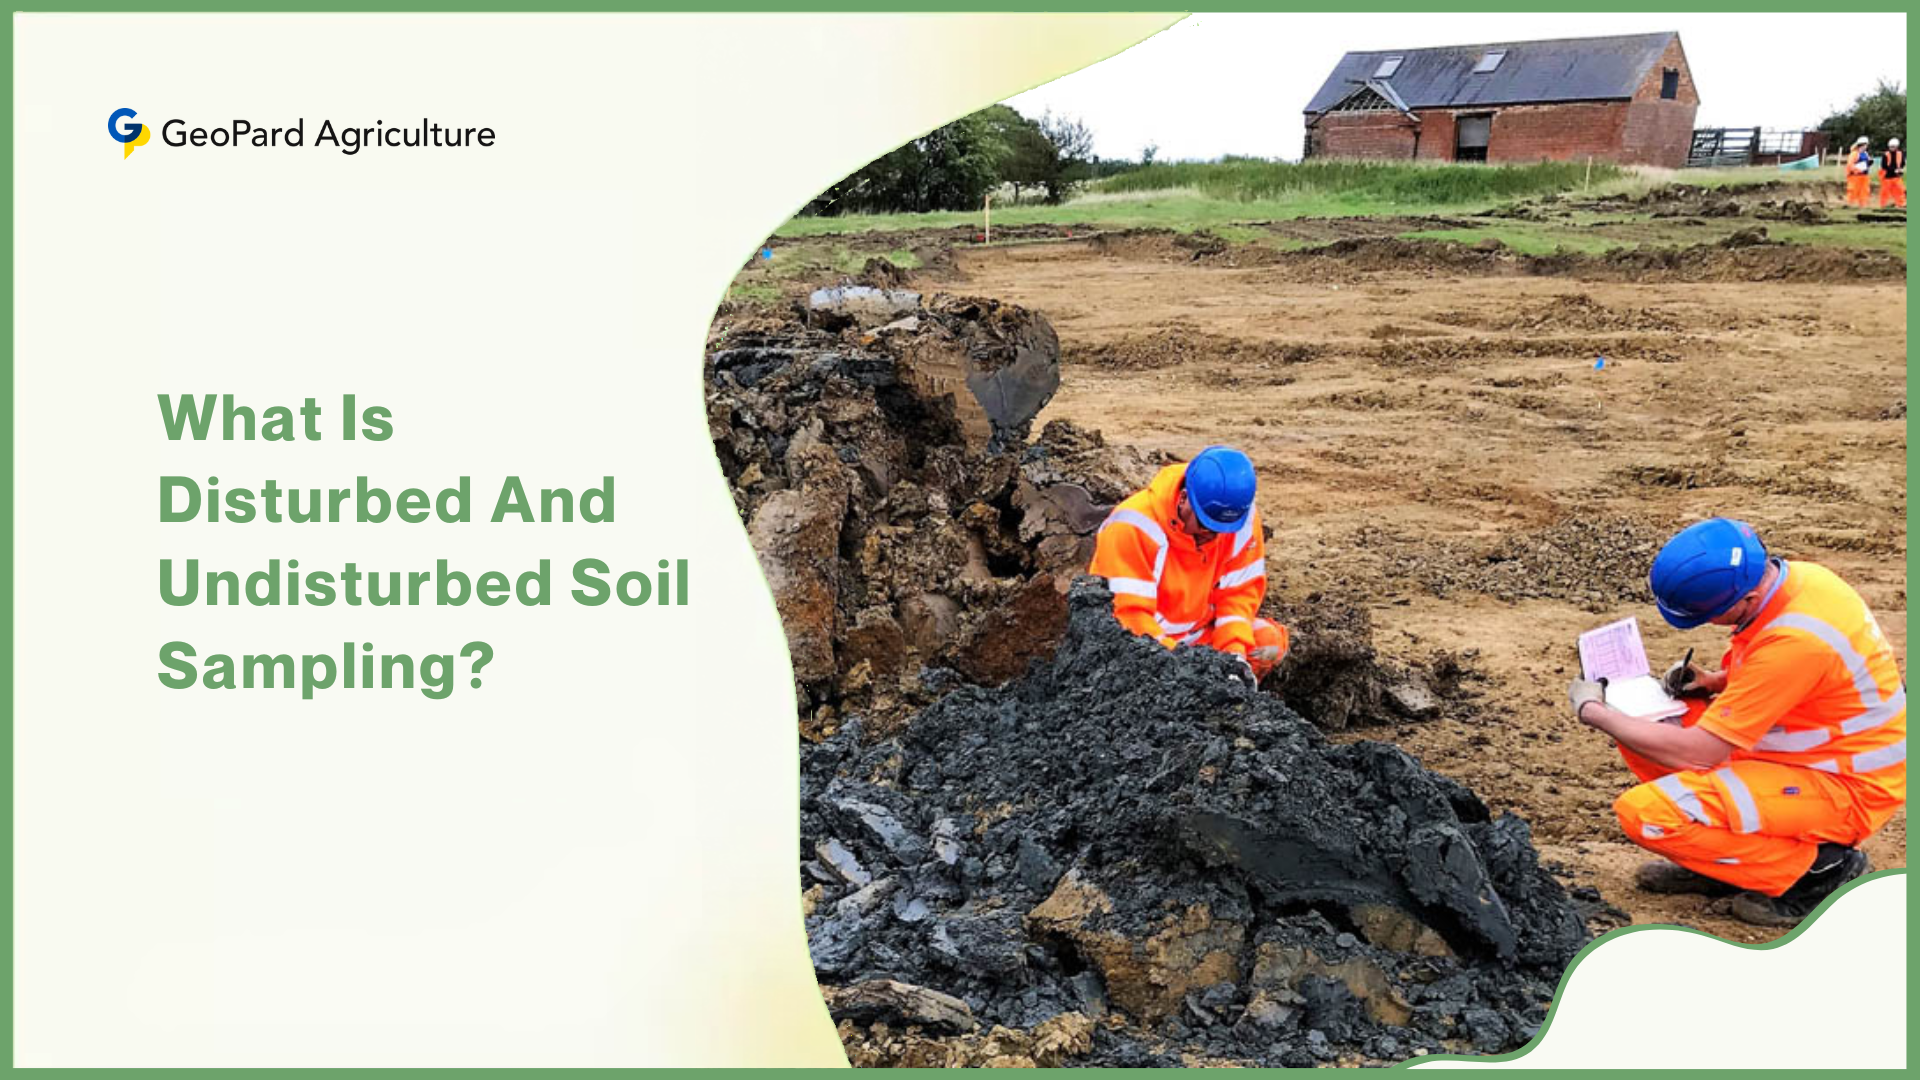
2. Environmental & Geotechnical: Here you may need to test for contamination, compaction, or structural stability. In environmental surveys, technicians often collect disturbed auger samples at many points to check pollutant levels, because this is fast and cost-effective.

But if you need to know how contaminants move through soil or need data on soil strength and compaction, you’ll need undisturbed cores. Geotechnical engineers (for buildings or roads) usually insist on Shelby tubes or piston samplers to get intact samples for strength and consolidation tests.

Define Your Application & Soil Type

3. Research & Archaeology: Some research projects require near-perfect cores. Archaeologists, for example, use small push probes or micro-coring tools to retrieve intact soil layers without mixing them. (These tools can be very specialized, often custom-made for thin cores and cores with liners.)

Also think about soil conditions in your site:

  • Soft/Sandy/Loamy Soil: Most samplers will work fine. A hand auger or push probe can penetrate easily.
  • Hard/Clay Soil: You may need extra force. A weighted slide hammer or hydraulic probe helps drive the tool into dense clay. Some probes have replaceable heavy-duty tips for extra punch.
  • Rocky/Gravelly Soil: Steel samplers can jam. In these soils, a slide hammer or powered drill (with rock bits) is usually required. Look for samplers with replaceable tips that can break through gravel, and hollow stems to clear debris.

When choosing, always match the tool to your soil type. For example, some push probes have narrow blades for wet soils or stainless steel tubes for abrasive soils. Compare models based on price, durability, ease of use, tip type (drill bit vs. pointed tip) and diameter to suit your conditions.

Determine Your Soil Sampling Depth

Soil depth is one of the biggest factors in agricultural and environmental testing. Studies show that nutrient concentrations can vary by more than 40% between the top 6 inches and the subsoil layer. In construction, more than 60% of foundation failures are linked to poor understanding of deep soil behavior.

This makes depth selection a crucial decision when choosing your sampler. How deep does your sample need to go? This depends on your goals:

Determine Your Soil Sampling Depth

1. Shallow (0–12 inches, ~0–30 cm): Typical for lawns, gardens, pastures or the topsoil layer of a farm field. Soil tests (pH, phosphorus, potassium) often use 6–8 inch cores. For example, many crop tests sample 0–6 inches because that’s where most roots and nutrients are concentrated. In no-till fields or pastures, labs may use 6–8 inch depth to account for residue.

2. Medium (1–6 ft, ~0.3–1.8 m): Used when you want subsoil information. In agriculture, deeper samples (e.g. 6–24 inches) can be taken for nitrate testing. In shallow groundwater or contamination surveys, probes might sample down a few feet. Hand probes can work in this range, but it gets tougher. In general, manual probes work easily to about 5–10 ft (1.5–3 m).

3. Deep (6+ ft, >1.8 m): Needed for geotechnical or very deep contamination work (e.g. testing clay layers or bedrock interface). These depths require heavy equipment like hollow-stem augers or hydraulic rigs. Hand augers become impractical beyond ~5–10 ft.

Even powered augers typically have limits (often 10–15 ft of continuous core). For very deep cores (up to 80+ ft), geotechnical drill rigs and specialty samplers (e.g. rock corers, hollow stem augers for casing) are used.

Always choose a sampler rated for at least the depth you need. Remember, taking multiple shallower samples or a single deep sample can yield different information. Also ensure you have depth stops or markings on your tool so every core is the exact same length – consistency is critical for reliable data.

Choose Your Soil Sample Type: Disturbed vs. Undisturbed

The way you handle soil cores can determine the accuracy of your results. Recent reports show that up to 25% of lab testing errors can be traced back to incorrect sampling methods. Disturbed and undisturbed samples each serve different purposes, and choosing the wrong type could lead to costly mistakes. This is a crucial decision:

Disturbed Sample: The soil is mixed inside the sampler. You break up and homogenize it (like mixing all collected cores together). This is fine for chemical tests (nutrients, pH, contamination levels) because the original soil structure doesn’t matter. Disturbed sampling (augers, large-diameter corers, or even shovels) is fast and cheap.

It’s the standard for farm fertility sampling: collect many cores in a zig-zag or grid pattern, mix them, then send to lab. The advantage is speed and low cost – you can quickly sample large areas. The downside is you can’t learn anything about soil layering, compaction or structure from a disturbed core.

Choose Your Soil Sample Type Disturbed vs. Undisturbed

Undisturbed Sample: The soil is extracted intact, keeping the layers and moisture in place. Tools like Shelby tubes, split-spoon samplers, or piston corers are used. These collect a solid core of soil. This is essential when you need physical or engineering properties (e.g. density, shear strength, hydraulic conductivity).

By preserving the sample’s natural structure, lab tests can simulate real ground conditions. The tradeoff is cost and effort: undisturbed sampling usually requires specialized equipment (often hydraulic rigs) and skilled operators.

A good rule: use disturbed (composite) sampling for routine agronomy and broad chemical checks. Switch to undisturbed (core) sampling when doing geotechnical or in-depth environmental investigations.

Select Power Method: Manual vs. Mechanical Soil Sampler

Labor efficiency has become a defining factor in modern soil sampling. With farms getting larger, demand for fast and consistent samples has grown. In North America alone, more than 60% of professional soil testing for agriculture now relies on mechanized or hydraulic sampling equipment.

Yet, manual tools remain the choice for most small-scale users due to their affordability and portability. Decide whether to go hand-powered or machine-powered:

1. Manual Samplers: These are hand-operated probes, augers or shovels. Examples include push probes (with foot treads or T-handles), hand augers, tile spades, and post-hole augers.

  • Pros: Portable, simple, and affordable. No engine means you can take them anywhere and they rarely break.
  • Cons: Labor-intensive and slower. It’s hard work to collect many samples manually, especially in tough soil.

Manual samplers are generally limited in depth; most work comfortably only a few feet deep. Also, human error can lead to inconsistent depth (each person pushes differently). For a small garden or a few quick cores, manual is fine.

Select Power Method Manual vs. Mechanical Soil Sampler

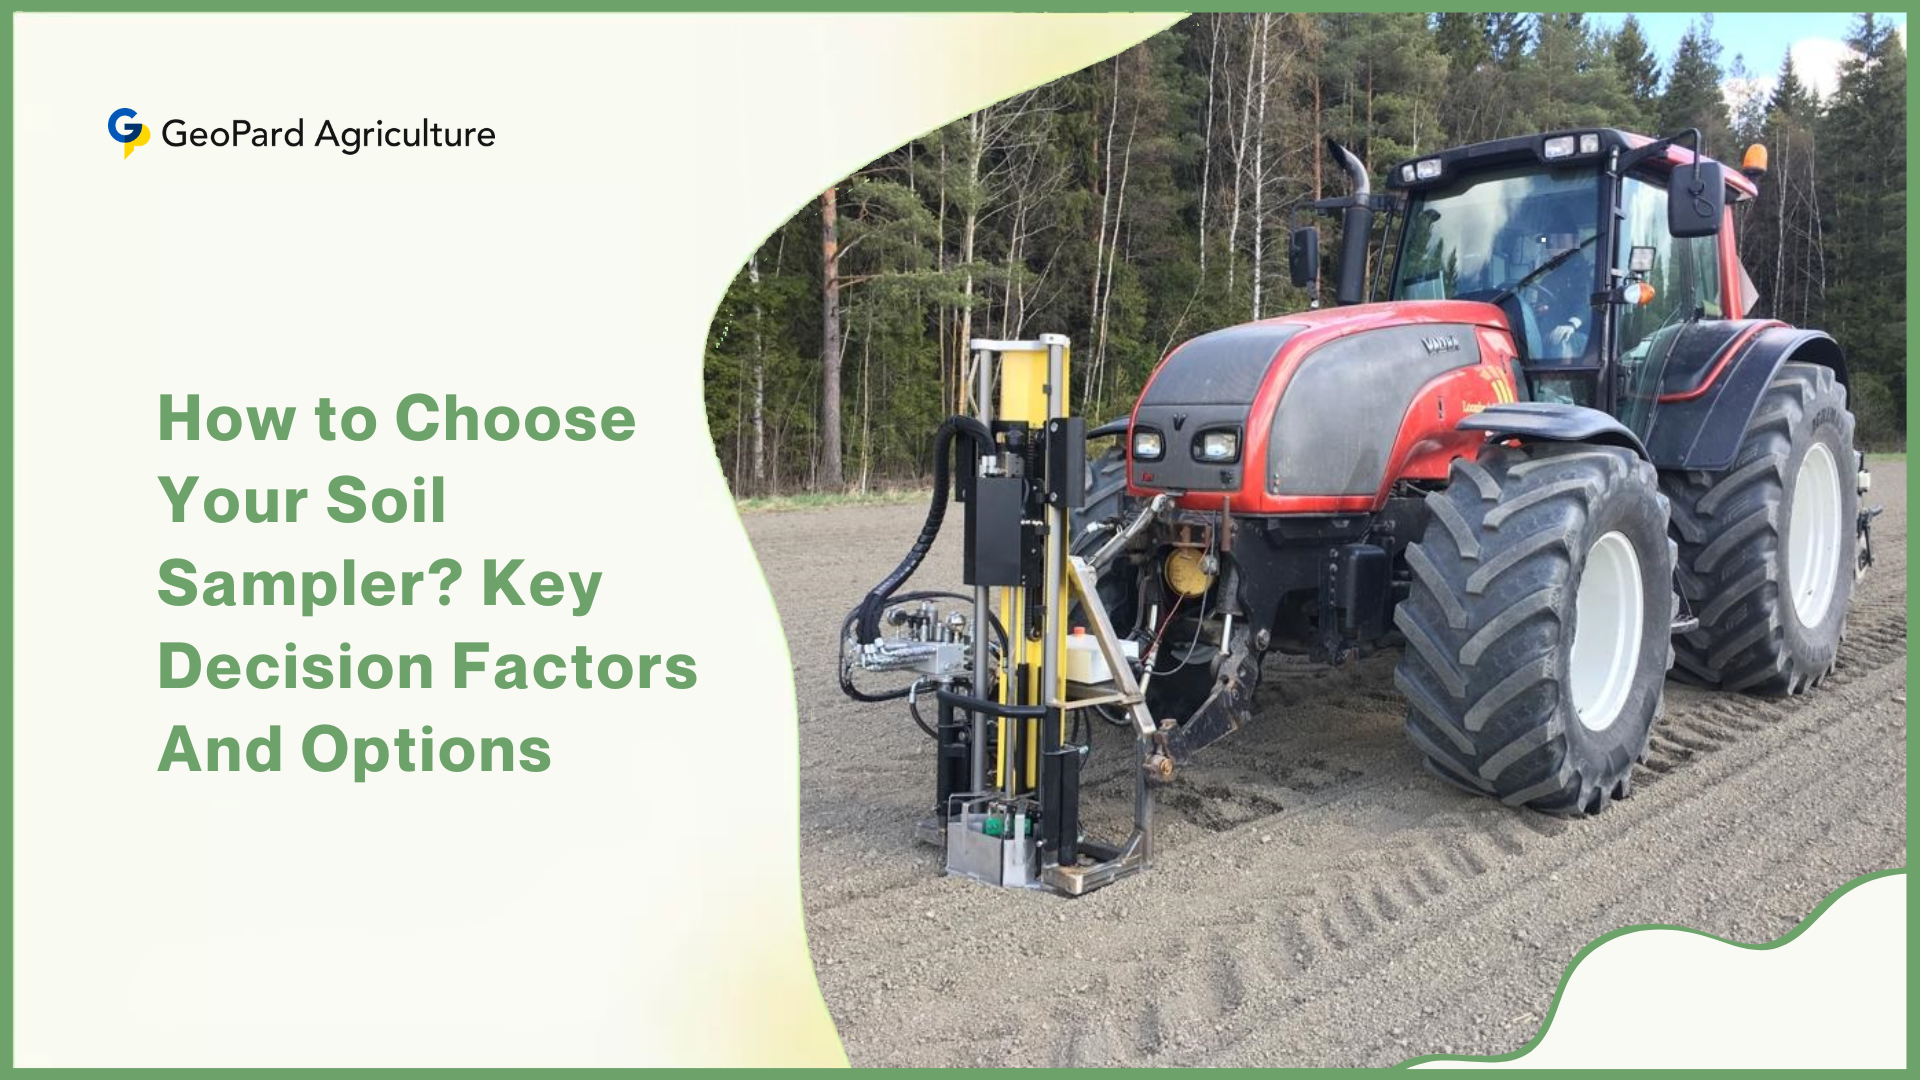
2. Hydraulic/Mechanical Samplers: These attach to tractors, ATVs or stand-alone rigs. They include hydraulic hand-held hammers, motorized soil probes, and full direct-push rigs.

  • Pros: Power and speed.

A tractor-mounted probe or robot can slam into hard clay or reach 10+ ft with ease. Depth is consistent and it’s much less tiring. High sample throughput is possible (ideal for precision ag with dozens of samples).

  • Cons: Cost and complexity.

You need engines or hydraulics, fuel/battery, and sometimes custom mounts. Initial investment is higher (often thousands of dollars), and maintenance is greater. Examples: the AMS “Coresense” hydraulic coring system or Geoprobe direct-push rigs.

Bottom line: If you’re sampling a few shallow spots, a manual push probe or auger is fine. If you need to collect many cores, go deep or through hard layers, a powered drill or hydraulic probe is worth it.

Evaluate Features & Ergonomics of Soil Sampler

Comfort and efficiency are increasingly important in soil sampling. A recent survey among agronomists showed that over 45% considered ergonomics and ease of cleaning as major factors in tool selection. With repetitive sampling becoming the norm in precision agriculture, even small design differences can significantly affect productivity and user fatigue. Once you narrow it down, look at the details. Even small differences in design can affect ease of use and sample quality:

Core Diameter: Smaller tubes (1–1¼ inch) need less effort but give a tiny sample; larger tubes (2–3 inch) take bigger cores. Bigger cores can be more “representative” and reduce sample error, but they require more force and make heavier samples. For composite nutrient tests, ½–¾ inch cores are often enough. For precise work or structure tests, 2 inch+ may be better.

Material: Steel probes are common. Stainless steel is rust-resistant (good for wet soils) but heavier. Carbon steel is lighter but can corrode. Some samplers use chromoly steel for strength. Check if the sampler has a protective coating or plating.

Handle & Design: Ergonomics matter. T-handles, foot treads, and slide-hammer grips all exist. A T-handle probe gives good leverage, while some probes have pads for your foot. Slide-hammer samplers need a solid frame that won’t bend. For repetitive sampling, look for padded grips or spring-tension mechanisms.

Portability: How heavy and bulky is it? For portable use, choose lighter probes (with aluminum parts or hollow shafts). For field equipment, ensure it mounts securely. Also consider handle length (taller handles reduce back strain) and storage (do extensions break down?).

Ease of Cleaning: Soil samplers can get clogged. Tools like augers with removable flights, split tubes that open, or slide hammers (which eject the core) are easier to clean. Some push-probe kits include collapsible liners or core catchers that make retrieving the sample simpler.

Durability: Look for hardy construction if you’ll be in rocky or abrasive soils. Check reviews or specs for wear-resistant bits and hard-case options.

Types of Soil Sampler – A Detailed Breakdown

Soil sampling techniques are rapidly evolving—recent surveys show that over 65 % of large-scale agricultural operations and 80 % of geotechnical firms now use core or mechanical sampling tools rather than simple hand augers. The demand for precise, undisturbed cores has increased by 12 % per year in environmental consulting markets. With that in mind, understanding the strengths and limitations of each sampler type is more important than ever.

1. Augers (for Disturbed Soil Samples)

Augers are the classic disturbed samplers. They look like giant drill bits or bucket scoops. As they rotate, their cutting edges dig into soil and the cylinder (bucket) collects the sample. There are several styles:

i. Bucket Augers: (also called spiral or Wright’s augers) have a large, spiraling flight with a cutting edge. They can bore several feet down. They capture and retain soil in the cylinder, minimizing loss as you pull up. These are workhorses for farms, landscaping and geotech.

A bucket auger is “excellent for reaching depths of several feet and effective in loose, sandy or cohesive soils”. They are used whenever you need a good bulk soil sample (e.g. mixing nutrients) – including agriculture fields, contamination surveys, or geological exploration. The sample from a bucket auger is usually quite disturbed (mixed).

Types of Soil Sampler Augers (for Disturbed Samples)

ii. Dutch/Hand Augers: These have a simpler construction (usually a single spiral or straight blades). They work well for 1–3 ft cores in softer soils. They’re lighter and easier for one person to operate. Great for garden or lawn testing. However, they tend to spit soil out as they drill (waste), so they need careful handling.

iii. Sand Augers: These have open flights and bigger gaps to gather very loose, wet, or sandy soil. They let sand fall into the flight. They are used mainly in geotechnical and environmental boring for shallow sand layers.

In general, augers are fast and general-purpose. If you need a soil sample quickly for basic analysis, an auger is usually the way to go. Just remember that the sample is disturbed. Many pros say augers provide “a high level of accuracy” and “consistent sampling” for fertility, contamination or geotech work, because they let you collect a good volume of soil even deep down.

2. Core Soil Samplers & Push Probes (for Undisturbed Samples)

Core or tube samplers are built to collect undisturbed cores. Think of a sharp thin-walled tube that gets pounded or pushed into the soil, pulling up a cylinder of intact soil inside. Examples include push probes, open-tube corers (Shelby tubes), and split-tube samplers. These preserve the soil’s layers and moisture.

i. Open-tube probes (sometimes with detachable liners) are common in turf and ag. You simply press or drive the tube to the desired depth, then pull it out and dump the contents. Split-tube samplers have two halves that clamp around the core and can be driven by a hammer.

After pulling up, you unscrew the ends to remove the soil column. The advantage is clear: you get an intact column. These are used in any case where “moisture content and structural integrity are critical” – such as contamination analysis (to preserve volatile chemicals) or soil stability tests.

In turf management or lawn care, a small diameter open probe (e.g. 3/4″ or 1″) is often enough. In geotech, Shelby tubes (~2–3″) are standard for clay soils. The image above shows various soil core sampler designs.

Core samplers are usually heavier and require more careful handling (you often seal both ends after extraction). But if you need to test for compaction, shear strength or hydraulic conductivity, an undisturbed core sampler is the right choice.

Types of Soil Sampler Core Samplers Push Probes (for Undisturbed Samples)

3. Slide Hammer Samplers (for Compacted Soils)

In recent field studies, slide hammer samplers reduced operator fatigue by up to 40 % and increased penetration success in compacted clay soils by 15–25 % compared to manual push probes. When soil is very hard or compacted, even driving a steel tube can be tough.

That’s where slide hammer samplers come in. A slide hammer is essentially a heavy weight (a “hammer”) that slides up and down on the sampling rod. You attach it to an auger or corer.

How it works: you place the sampler at the surface, then let the weight fall and slam down on the rod. The momentum drives the tip into the ground. You repeat this until reaching depth. The same hammer can also push up on the rod to help pull out the tool. In effect, it’s like adding a jackhammer function to your probe.

This method is very useful for medium-depth sampling (several feet) in dense clay or fill. For example, for compacted soil sampling you might attach a 1″ probe to a slide hammer to get 3–5 foot cores.

According to AMS, slide hammers are “a versatile tool for driving soil probes” and give a straightforward driving force by dropping weight. They allow you to reach greater depths in challenging soils. In practice, if a hand probe just won’t penetrate, try a slide-hammer probe: the extra impact makes it much easier.

4. Specialized Soil Samplers

Use of specialized samplers has grown by 20 % in environmental and geotechnical work over the last five years, especially in contaminated site remediation and deep core projects. Beyond the common types above, there are niche samplers for particular needs:

i. Shelby Tubes (Thin-Walled Samplers): These are thin steel tubes (2–6 inch diameter) used mainly in geotechnical work. A Shelby tube has a sharpened beveled edge and is pushed into undisturbed clay/silt to cut an intact core. They are usually driven hydraulically in a drilled hole to avoid disturbance. Shelby tubes are not hand-held tools; they need a drill rig or specialized equipment.

Use them when you need a high-quality undisturbed sample for compressibility or shear tests. (They’re often called push tubes or Acker tubes too.) Shelby tubes are ideal for fine-grained soils – just know that driving them can be hard work in anything stiffer than soft clay.

Specialized Soil Samplers

ii. Split-Spoon Samplers: A split-spoon is the classic sampler for Standard Penetration Tests (SPT). It’s a thick steel tube, split into halves, driven by a drop hammer. The soil entering a split-spoon is technically disturbed but can still be relatively cohesive.

You’ll see this used in geotech for rapid sampling of various strata. It’s not for perfectly intact cores (since the hammering disturbs the sample), but often gives a good enough core for classification and some strength estimates.

iii. Stationary Piston Samplers: These have a piston that sits at the bottom of the sampler during insertion, preventing suction. When the tube is pushed down hydraulically (instead of hammered), the piston holds the sample in place until withdrawal. The result is a very undisturbed core. Piston samplers are used in very sensitive soils where even a Shelby tube might smear.

iv. Pit-Hammer Kits: Some kits (e.g. AMS bulk density kit) include a pit hammer with a circular cutting head. By hammering and then pulling up, you extract a volumetric core (knock out a plug). This is useful if you need a precise volume (for bulk density or porosity tests).

v. Mud Augers: These augers have slots or wide flights to handle wet, sticky soils. If you’re coring in saturated clays or swampy ground, a mud auger (with cut-outs in the tube wall) helps remove the heavy clay. They often have plug valves or extra openings so you can empty the clay out easily. In plain terms: for saturated or clay-rich sites, use a mud auger to avoid clogging.

Each of these specialized samplers is chosen for particular field conditions. For most soil sampling tasks, you’ll pick among the more general categories above, but keep these in mind if you hit sticky or silty soils, or need exact-volume cores.

Leading Soil Sampler Companies & Options

The soil sampling equipment market has been growing steadily in recent years, driven by demand for precision agriculture, environmental monitoring, and infrastructure projects. According to a 2024 market report, the global soil testing equipment sector is projected to reach $6.9 billion by 2035, expanding at nearly 5% CAGR from 2025 onward.

Much of this growth is fueled by rising adoption of smart farming, government regulations for land use, and the need for accurate soil data before construction. As this demand increases, a handful of companies dominate the market with specialized tools that cater to farmers, agronomists, and engineers worldwide. If you’re ready to buy, here are some top brands and what they’re known for:

1. AMS (Art’s Manufacturing & Supply)

A fourth-generation family business (est. 1942) specializing in soil sampling tools (ams-samplers.com). They offer everything from basic push probes and augers to hydraulic systems. AMS is often cited as an innovation leader.

Options: They produce simple hand probes, augers, slide hammers, and advanced systems like the AMS PowerProbe.

Precision Features: AMS hydraulic samplers such as Coresense are designed for high-volume sampling and can be mounted on tractors or utility vehicles. These machines are GPS-compatible, making them highly useful for zone sampling in precision agriculture. Consistent depth control ensures reliable data across entire fields.

Why It Matters: If you are managing hundreds of acres, AMS gives you both portability and power. Their samplers reduce human error and ensure your samples line up with precision maps.

2. Clements Associates Inc.

Clements focuses strongly on agriculture and environmental sampling, building tools that are both durable and accurate. Clements probes are often air-lifted or pneumatic, allowing 30+ foot depths.

Options: Their most famous products are the JMC Environmentalist Subsoil Probe and Enviro-Safe Samplers.

Precision Features: These tools are widely used in grid and zone sampling, which are essential for precision farming. Many agronomists pair Clements probes with handheld GPS units, ensuring they take samples from the exact same locations year after year. This repeatability is critical for tracking soil fertility over time.

Why It Matters: Clements is an excellent choice for professional agronomists or consultants who need reliable probes for long-term soil monitoring.

Leading Soil Sampler Companies & Options

3. Wintex

A Canadian company making rugged manual samplers. Wintex gear (and related brands like Radius) are known for all-steel durability. If you need simple, sturdy tools for any soil type, Wintex is a popular choice. Their slide hammers and T-handle probes are built for rough use.

Options: They manufacture push probes, manual augers, and hammer-driven samplers.

Precision Features: While Wintex tools are mostly manual, they are often paired with GPS devices or farm management software to record exact sample locations. This makes them useful for smaller farms adopting precision techniques without heavy investment in machines.

Why It Matters: Wintex provides durability and affordability. Their samplers are simple but can fit into precision workflows when combined with GPS tracking.

4. Falcon

Falcon is more focused on geotechnical and environmental investigations rather than agriculture. They also sell pit-hammers and block samplers. Geotechnical engineers often order Falcon equipment when they need regulatory-quality soil cores.

Options: They are known for Shelby tubes, piston samplers, and U100 dynamic sampling kits.

Precision Features: Falcon’s tools don’t come with built-in GPS, but they are often integrated into environmental workflows where GPS mapping and remote sensing are used to guide drilling locations. Their specialty lies in providing undisturbed soil cores for construction and contamination studies.

Why It Matters: Falcon is the go-to choice for engineers who need deep, undisturbed samples to assess building sites or environmental risks.

5. Oakfield Apparatus

A Nebraska-based company making quality manual samplers at a friendly price. Oakfield’s focus is on straightforward, easy-to-use probes and accessories (like sample bags and liners) – a great choice for gardeners or entry-level users.

Options: They make stainless steel push probes, soil tubes, and accessories like sample bags.

Precision Features: Oakfield tools are fully manual, but they can easily be used with GPS logging apps to record where each sample is taken. While they don’t have built-in precision features, they are often used on small farms, turf management projects, or gardens where cost is a factor.

Why It Matters: Oakfield is ideal for hobbyists, gardeners, and smaller farms. Their probes are lightweight, durable, and easy to clean.

6. Geoprobe Systems

Geoprobe Systems leads in mechanical direct-push rigs (they actually make full drilling trucks). Their machines can drill and sample in one go. Geoprobe is a leader in heavy-duty sampling rigs, often mounted on trucks or trailers.

Options: They produce direct-push rigs and hydraulic coring systems capable of deep and high-volume sampling.

Precision Features: Geoprobe rigs can be combined with GPS guidance and remote sensing maps, making them highly effective for environmental studies and advanced site investigations. Their equipment ensures accuracy and speed on large projects where dozens of deep cores are needed.

Why It Matters: Geoprobe is best suited for engineers, large farms, and government projects where both depth and volume of samples are critical.

7. Spectrum Technologies

Spectrum bridges traditional soil sampling with digital technology and sensors.

Options: They provide soil probes, moisture meters, and nutrient testing kits.

Precision Features: Spectrum specializes in combining soil samplers with real-time sensors. Their tools are often paired with remote sensing data, allowing farmers to match lab results with drone or satellite imagery. This creates a stronger picture of soil health and crop performance.

Why It Matters: Spectrum is perfect for farmers and researchers who want to integrate soil sampling directly into data-driven precision agriculture systems.

Each of these brands has its niche. For example, AMS and Clements gear can be seen on big farms and research projects. Wintex and Oakfield gear is everywhere on smaller farms and environmental sites. Falcon is a go-to for engineers. When choosing a brand, consider not just price but support, parts availability, and local distributor networks.

The Modern Context of Precision Ag, Remote Sensing & Soil Sampler

The global precision agriculture market is expected to grow from $9.7 billion in 2024 to $16.4 billion by 2030, at a CAGR of about 9.2%, driven by the need for accurate, data-based farm management. Soil sampling is a critical piece of this growth, as more than 80% of large-scale farms in North America and Europe now use GPS-guided soil sampling methods.

Studies show that precision soil sampling can reduce fertilizer costs by up to 20% while increasing yields by 5–15%, making it one of the most cost-effective practices in modern farming. In recent years, technology has transformed soil sampling. Farmers and scientists now combine satellites, drones, GPS and robotics with old-school tools. Here’s what’s changed:

1. From Blanket to Zone Sampling

In the past, many fields were sampled as a single unit (“blanket sampling”). Today, precision agriculture breaks fields into management zones. Using satellite imagery, drone maps or yield monitors, agronomists identify areas of similar productivity or soil type. Then each zone is sampled separately. For example, instead of taking one composite sample per 40 acres, a farmer might sample one composite per 10-acre zone.

The Modern Context of Precision Ag, Remote Sensing & Soil Sampler


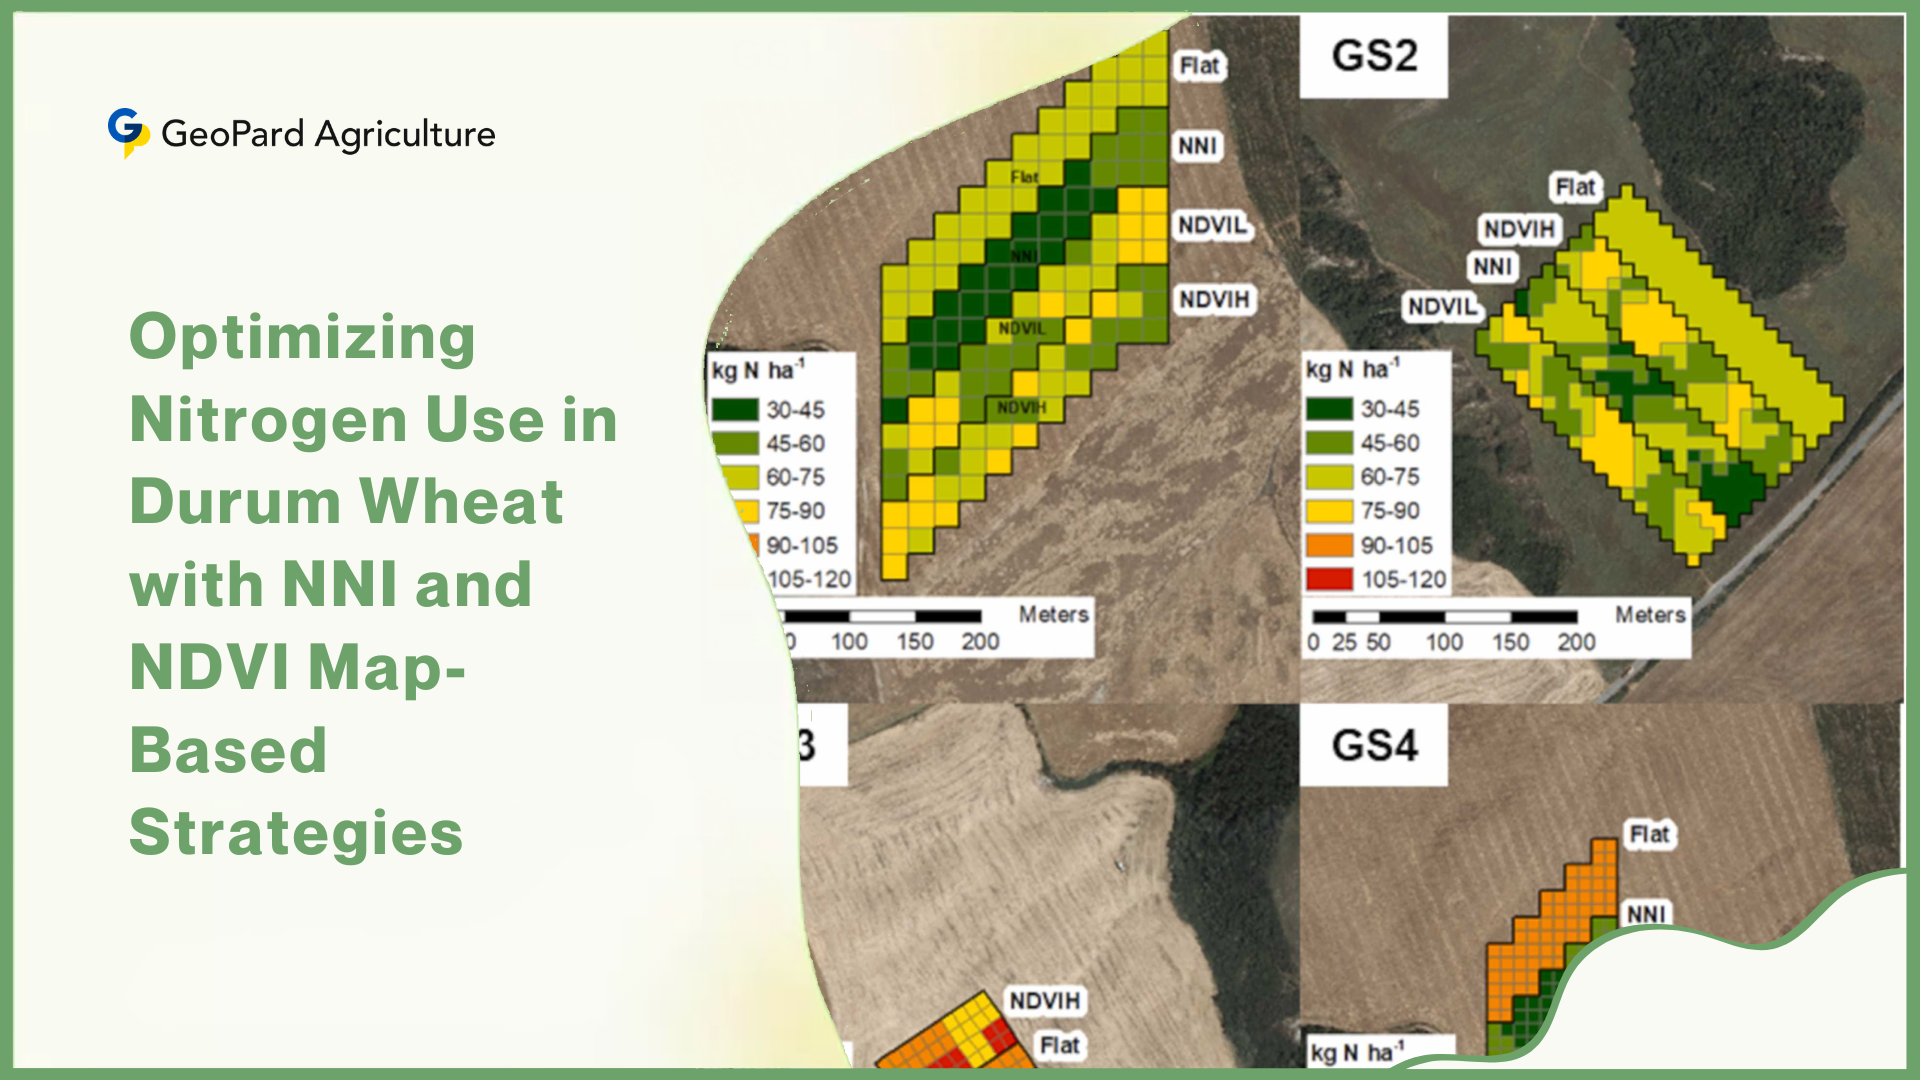
Grid vs. Zone Designs: There are two main designs. A grid pattern (e.g. every 2–5 acres) treats each grid cell equally. This can map fine-scale variation but can be costly if done at high density. A zone-based approach divides the field by soil color, yield history or slope, and samples each zone. Zone sampling can give “almost the same accuracy as grid sampling” with fewer samples.

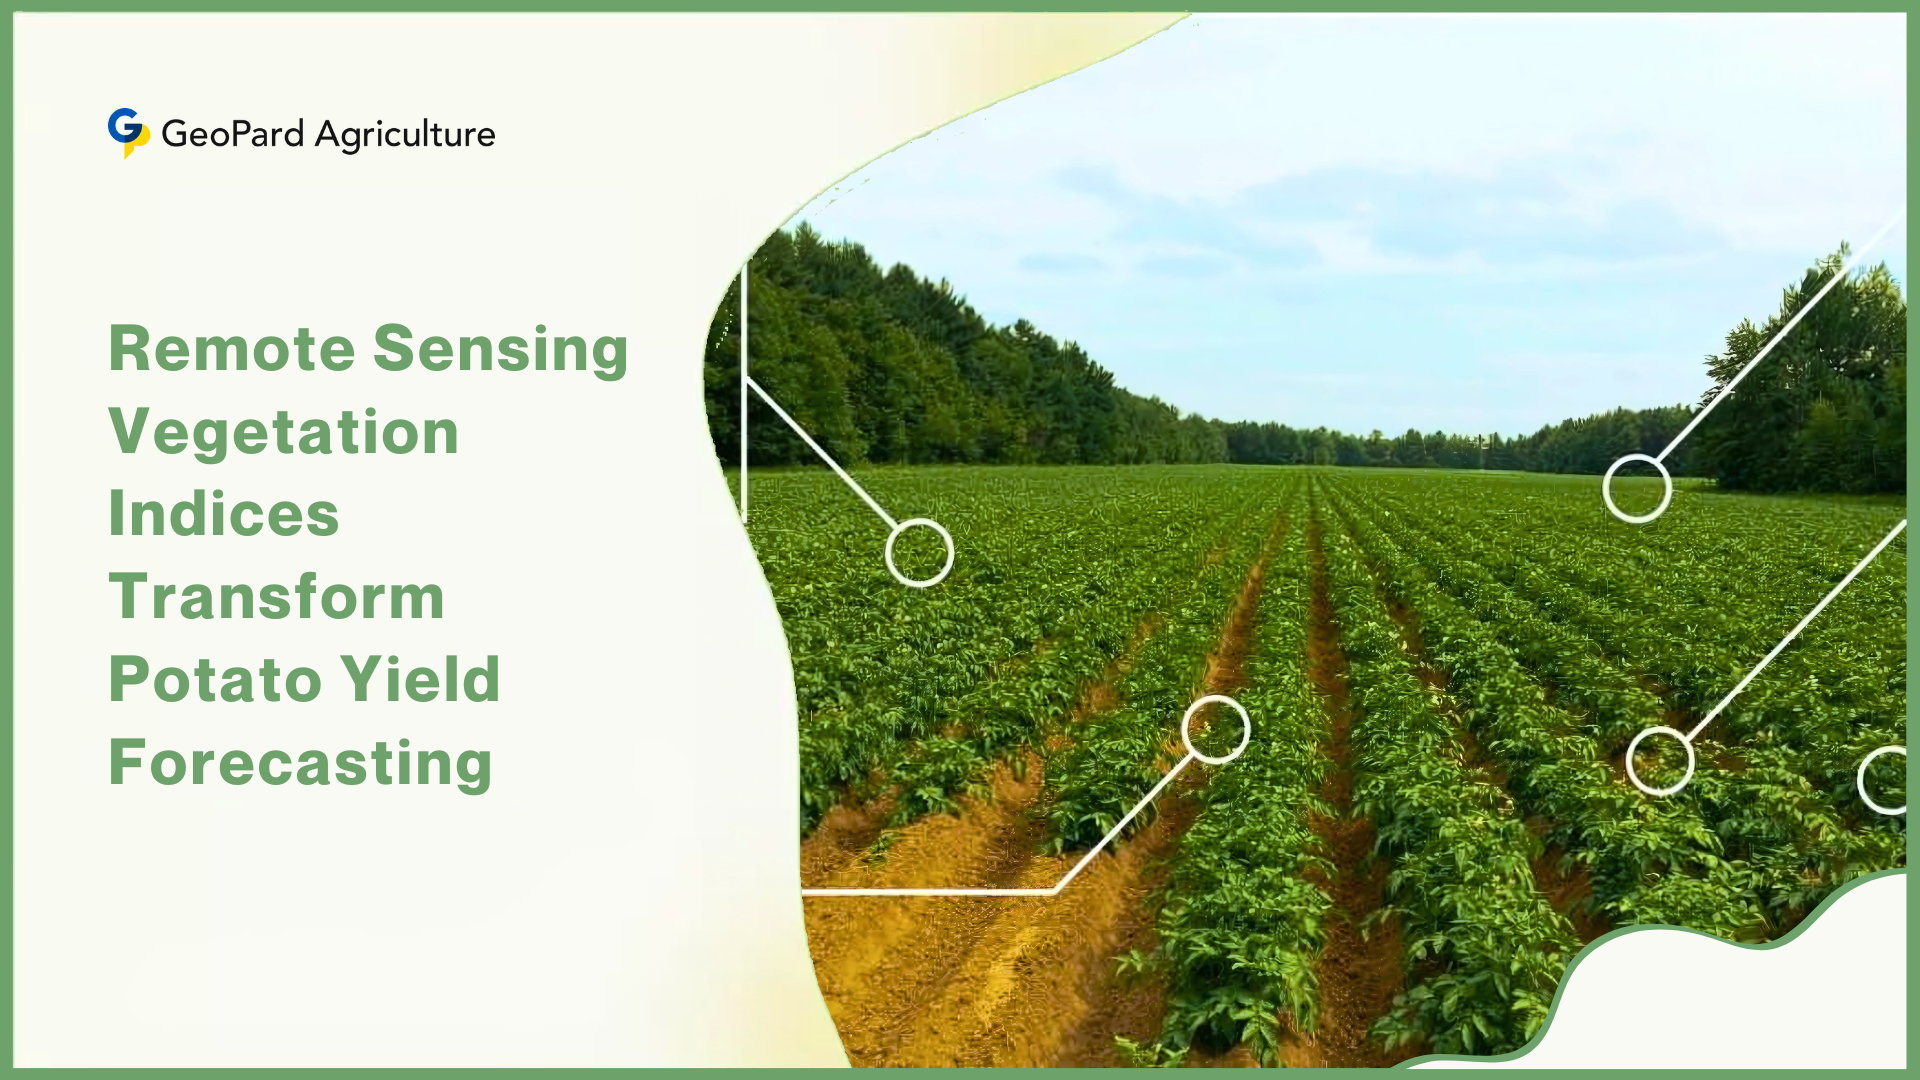
Remote Sensing: Tools like NDVI (crop vigor), EM soil conductivity, and yield data create maps of variability. Now, soil labs often receive georeferenced samples. As one study puts it, a yield map or NDVI map can identify “high/medium/low productivity areas” which become separate sampling zones. This targeted approach improves efficiency. It was found that nutrient levels can vary up to 40% within the same 10-acre zone! By sampling according to this variability, a farmer avoids “hidden” problem spots.

In practice, a precision workflow is: remote sensors flag areas of concern (the “Where”), and then a team or robot physically samples those zones to find out “What” is really in the soil. This method yields far more actionable data than one-sample-per-field.

2. How Technology Changes Sampler Requirements

Higher sampling intensity and accuracy demand better tools:

Speed & Volume: If you’re taking 20+ cores per field, manual methods may be impractical. Many precision ag professionals use hydraulic or automated samplers. For instance, AMS’s tractor-mounted Auto-Field Sampler (AFS) or a soil-sampling robot can grab dozens of cores in the time a person could do a few. Modern equipment often features vacuum lines or spring-loaded ejection to dump the core quickly.

Depth Consistency: When sampling many points, you need identical depths. Advanced probes use depth collars or sensors. Robotic samplers like ROGO’s system even achieve ±1/8″ depth accuracy. They “learn” from each core and adjust force so each core is exactly the same length. Look for tools with clear depth markings, stops or feedback controls.

GPS-Guidance: Today’s samplers usually integrate GPS. Some handheld probes have mounts for a GPS receiver, while automated systems use RTK-GPS guidance. For example, ROGO notes that with RTK GPS they can “repeat sample locations precisely from year to year.” On simpler budgets, a phone or tablet with mapping apps can also guide your route across a zone. Always record each core’s coordinates.

Data Logging: New samplers may even log data digitally. After each sample, a button press can tag it with an ID and location. Some systems interface directly with farm management software. The key is that each soil core becomes ground truth tied to a specific field zone.

Durability for Field Use: As sampling becomes higher-stakes, companies are building tougher samplers. Look for robust frames, sealed bearings on slide hammers, and metal connections that resist wear. In short, modern precision ag demands consistent, repeatable tools — not just occasional probes.

3. The Data-Driven Workflow

Putting it all together, here’s how many precision farms operate:

  • Identify Zones: Use satellite/drone imagery or yield maps to create management zones. Each zone should be relatively uniform or address a known issue (e.g. a low-spot, or a drainage area). This is your map of “where” to sample.
  • Plan Sampling Points: Decide how many cores per zone (commonly 15–20) and at what depths (e.g. 0–6″ and 6–24″). Use GPS or marked flags to space out the points evenly. Many growers walk in a zig-zag or “W” pattern across each zone.
  • Collect Samples: Using your chosen sampler and method, collect each core. Keep the depth constant, and avoid any bias (e.g. don’t always sample near roads). If collecting composites, put all cores from a zone in one bucket and thoroughly mix them. (Studies show using 15–20 cores per composite can reduce sampling error by ~90% compared to only 5 cores.)
  • Document Everything: Label each sample with field, zone, depth and GPS coordinates. Even FAO reports note up to 30% of lab errors come from poor labeling or handling.
  • Lab Analysis: The lab sends back detailed data (pH, nutrients, contaminants). Because each sample has location info, you now have a map of soil properties.
  • Precision Application: Finally, this information feeds into variable-rate equipment. You might apply lime or fertilizer differently in each zone, or dig down deeper only where contamination is flagged.

Conclusion

Choosing the right soil sampler comes down to a few core questions: Why am I sampling, what kind of soil am I dealing with, how deep do I need to go, what type of data do I need, and how will I collect it? By answering these, you can quickly match a sampler to your project. For hobbyists and gardeners, a simple push probe or hand auger—like Oakfield’s stainless steel model—offers an affordable and durable way to check shallow soil conditions. It’s easy to use and perfect for quick tests in gardens and lawns.

Professional agronomists benefit most from mechanical probes or hydraulic systems. Tools like the Clements JMC or AMS hydraulic corers save time, improve consistency, and work seamlessly with GPS guidance for precise fertility mapping across large fields. Geotechnical engineers, on the other hand, need undisturbed samples. Shelby tubes and split-spoon samplers from Falcon or AMS are industry standards, often paired with hydraulic rigs for deep, accurate cores essential to construction and environmental studies.

No matter who you are, the right sampler will unlock accurate soil insights. With this guide, you now have the confidence to choose the right tool and begin uncovering the story beneath your land.

Grid Soil Sampling & Remote Sensing: Data-Driven Shift in Precision Ag

Traditional farming often treats an entire field uniformly – applying the same seed, fertilizer or lime rate everywhere. In reality, fields usually contain very different soil types and fertility levels in different spots. However, in recent years, more farmers are using grid soil sampling and precision soil testing as part of digital agriculture.

In one survey of U.S. cropland, soil core testing is now used on around 27% of corn acres and 14% of wheat acres, up from much lower numbers a few years ago. The adoption of these tests is rising as the cost of lab work falls and as farmers see clearer return from nutrient-targeted applications. Meanwhile, global spending on precision farming hardware (which supports grid soil sampling among other tools) is fueling market growth estimated at USD 10.5 billion in 2024, with projections to double over the next several years.

Studies show that applying fertilizer based on average field values “treat[s] all soil as equal” – a practice that tends to “make farmers lose yield and money.” For example, one review found that basing fertilization on field averages often wastes inputs in some areas and underfeeds others, cutting potential yield.

Yet soils are naturally variable: past erosion, topography and crop history create “extreme field-scale variability” in soil pH, nutrients, moisture, and organic matter even within a single field. High spots may have depleted topsoil, while low spots may hold more moisture and nutrients. Treating all these areas the same ignores these differences.

What is Grid Soil Sampling?

Grid soil sampling is a systematic way to sample soil across a whole field. Instead of taking one or two random samples, the field is overlaid with an imaginary grid of small, equal-sized cells (for example, 1–2.5 acre per cell). A GPS device guides the sampler to the center of each cell. At each grid point, the sampler takes multiple cores (typically 10–15 cores) from around that point and mixes them into one composite sample.

Each cell thus yields one soil sample that represents that tiny area of the field. The size of the grid (cell area) is chosen to balance detail versus cost – smaller cells (more points) give finer resolution but cost more to sample. Research suggests that 1-acre grids capture more than 80% of field variability, while 2.5-acre grids capture somewhat less. Some key points are:

  • Divides the field into equal cells (e.g. 1–2.5 acres each)
  • Uses GPS to sample points at fixed locations (black dots in figure).
  • Collects 10–15 soil cores per point and sends composite to lab

What is Grid Soil Sampling?

1. Planning the Grid: Before sampling, farmers choose a grid size based on field size, variability and budget. A common choice is around 2.5 acres per sample; very high-resolution work might use 1-acre cells. GPS coordinates for each grid point are generated in a map or sampling plan.

2. Collecting Samples: At each marked point, the sampler collects soil cores from within a few feet of that location. All cores for the point are combined into one sample bag. Using a clean stainless-steel probe or auger and a GPS ensures accuracy. Sampling depth and number of cores per point follow best practices (for example, 10–15 cores per point to average out microscale variability).

3. Lab Analysis: The composite samples are sent to a soil lab. The lab measures key soil properties: pH, available nutrients (phosphorus, potassium, nitrogen, etc.), organic matter, and sometimes micronutrients or micronutrient supply capacity. This nutrient data is then linked back to the GPS coordinates of each grid point.

4. The Output – Soil Nutrient Maps: Once all lab results are in, the data points are interpolated to create continuous soil maps for the field. Software can draw contours or shaded zone maps for each parameter – for example showing “high”, “medium”, and “low” regions of soil phosphorus or pH.

These soil variability maps let the farmer see exactly which parts of the field are rich or poor in each nutrient. For instance, one study notes that grid sampling maps “reveal differences in fertility that traditional field testing… can overlook,” allowing nutrients like P and K fertilizer, or lime, to be applied only where they will pay off.

Grid sampling produces a very fine-grained view of soil fertility. In the precision-ag map above, each dot corresponds to a sampled location. The resulting maps (not shown) can highlight patterns, such as a band of low pH or a pocket of low nitrogen. For example, one U.S. survey found that when farmers adopted soil-sampling-based nutrient management, 67% reported higher yields and saved about $24 per acre in corn costs.

These gains come from applying the right nutrients in the right places – a decision only possible with detailed grid maps of soil chemistry. Over time, repeating grid sampling every few years also helps track whether fertility is improving under new management.

Role of Remote Sensing in Grid Soil Sampling

Remote sensing means gathering information about the field from a distance, without physically touching the soil or crops. In agriculture, this typically involves satellites, manned aircraft or drones equipped with cameras or sensors. These sensors detect reflected sunlight (often in visible and infrared bands) or other signals from the surface. The most common output is an image layer that reflects plant health or soil moisture.

For example, satellites such as Sentinel-2 or Landsat regularly capture multi-spectral images of every field in the world. Aerial flights (fixed-wing planes) can take higher-resolution photos over large areas. Unmanned drones (UAVs) can even fly under clouds to get very high-resolution images on demand over a few fields.

The most famous remote-sensing output for crops is the Normalized Difference Vegetation Index (NDVI). NDVI compares how much light plants reflect in the red versus near-infrared wavelengths. Since healthy green plants absorb red light (for photosynthesis) and reflect near-infrared (NIR). Bare soil and water give NDVI near 0 or negative. In simple terms, higher NDVI means greener, healthier plants; lower NDVI means sparser or stressed vegetation.

Role of Remote Sensing in Grid Soil Sampling

How Remote Sensing Helps: Remote sensing does not replace soil sampling, but it provides a crucial complement. Imagery can reveal spatial patterns of crop health that often mirror soil variability. For instance, drought-stressed or nutrient-deficient areas may show up as low-NDVI patches.

As one precision-ag platform notes, satellites “show patterns of plant growth that typically mirror soil variability,” helping to plan sampling and management. Over time, satellite NDVI maps allow farmers to track trends: for example, if a certain corner of the field consistently has lower NDVI year after year, that signals a chronic issue (poor drainage, low pH, etc.).

Remote sensing is also temporal. Unlike a one-time soil sample, we can get an image of the field every week or even daily. This lets farmers see how plant health is changing through the season. If an area suddenly turns red (low NDVI) between two images, that indicates a new stress (pest outbreak, drought spot, etc.). This temporal view guides when and where to scout fields or to adjust management mid-season.

Finally, historical imagery can guide sampling strategy. If remote sensing shows that only part of a field ever exhibits problems, a farmer might choose a finer sampling grid in that zone and a coarser grid elsewhere. In other words, satellite/drone maps can help target soil sampling to where it matters most, making the process more efficient.

Integrating Grid Sampling and Remote Sensing

The integration of grid sampling and remote sensing is now being adopted more widely: in the U.S., more than half of farm acres now use tools like sprayer section controllers, planter row controllers, and precision soil samples. Also, yield monitoring is used on about 70% of corn acres, and market forecasts show the combined precision farming market (hardware + software + services) will grow from around USD 10.5 billion in 2024 to more than USD 21 billion by 2032.

These numbers show the fusion of ground-truth soil data with aerial and satellite sensing is becoming the foundation of many farms’ practices. The real power comes when we fuse grid samples with remote imagery in a continuous feedback loop. Each method covers the other’s weaknesses.

1. Ground Truthing (Calibrating Imagery): Grid soil samples provide the “ground truth” that helps interpret remote-sensed data. For example, if an NDVI map shows a low-vigor area, a soil sample from that spot may reveal it’s low in potassium. Over multiple fields, researchers have found strong correlations between soil measures and spectral indices (e.g. linking soil pH or nutrients to satellite data). By building a model that relates NDVI (or other spectral bands) to lab-measured values, we can use remote sensing to predict soil fertility in unsampled locations.

2. Extrapolation and Interpolation: Because satellites cover the entire field at once, they fill in the gaps between sample points. For instance, suppose we sampled every 2.5 acres but want a finer map. If NDVI correlates with nutrient levels, we can interpolate between grid points using NDVI gradients. This dramatically increases effective resolution. In one case study, researchers used satellite data correlated with soil pH to design optimal sampling and then create accurate high-resolution pH maps with far fewer samples.

Integrating Grid Sampling and Remote Sensing

3. Creating VRT Prescription Maps: The combination of detailed soil maps and imagery is the basis for Variable Rate Technology (VRT). For example, to apply fertilizer, software can overlay an NDVI map with a soil nutrient map and generate a prescription map that varies input rates across the field. One scenario is: the NDVI map shows a southern corner of the field lagging in growth, and grid samples there confirm it’s low in phosphorus.

The farmer can then create a high-phosphorus prescription exactly for that zone, while saving fertilizer in healthy zones. In practice, NDVI-driven fertilizer management has led to dramatic improvements. For instance, a Thai corn grower found mid-season NDVI imagery that isolated stress zones.

Soil testing confirmed these zones were nitrogen-deficient, so he applied fertilizer only there. The crops then recovered within weeks. This targeted approach boosted yield and uniformity, demonstrating how imagery and samples together drive effective VRT.

4. Management Zone Delineation: Rather than blindly using a fixed grid forever, farmers can evolve to management zones – larger areas within which conditions are roughly uniform. Zones are often defined by combining many layers: grid soil results, yield maps, elevation, and historical imagery.

For example, fields can be split into “zones” of similar soil type or NDVI pattern. Future soil sampling can then be done per zone instead of per grid point. This can reduce cost: one study notes that fields pre-planned into zones can achieve up to 25% higher fertilizer use efficiency. In essence, satellite images and yield data help refine those zones over time.

5. Environmental and Economic Benefits: By applying inputs variably, farmers use only what is needed where it’s needed, improving nutrient use efficiency. Grid-sample-based maps have been shown to reduce nutrient runoff risk, because high-fertilizer areas are constrained. More uniform crop growth also stabilizes yields.

In the long term, these tools help maintain soil fertility and cut costs. For instance, precision lime application guided by this data avoids overliming some spots and ignoring others, saving money on lime while preventing soil acidification.

6. Feedback Over Time: Another key advantage is that this is an ongoing process, not one-off. Each season, farmers collect yield data, drone images, and new soil tests. A platform can layer these data to learn why certain areas behave differently. In other words, grid sampling tells you what’s in the soil now; remote sensing shows how the crops responded.

Combining them year after year creates a learning cycle. An EOSDA study explains that after the first soil test cycle you know “where you stand,” and as you repeat sampling and overlay satellite/yield data, you see how the field is changing under your inputs, refining management continuously.

Key Applications of Grid Soil Sampling in Precision Agriculture

With the global precision agriculture market projected to reach $16.35 billion by 2030 (growing at a CAGR of nearly 13%), digital farming tools are becoming central to modern agriculture. Farmers today face rising input costs, climate uncertainty, and sustainability pressures, making data-driven input application more crucial than ever.

Key Applications of Grid Soil Sampling in Precision Agriculture

By integrating grid soil analysis maps, satellite imagery, and machine data, farmers can increase yields while cutting waste. With this integrated data, farmers create precise input prescriptions. For example:

Variable Rate Technology (VRT) Maps: Using soil nutrient maps and NDVI patterns, software draws maps for GPS-controlled spreaders. Lime trucks use a lime-map to neutralize acidity only where pH is low. Fertilizer spreaders use a P or K map from the lab results. Modern systems can even download NDVI maps directly to the spreader, so high-NDVI (vigorous) zones might get more fertilizer while low-NDVI zones get less.

In soybeans, a Brazilian farmer did exactly this: his machine applied almost no fertilizer in poor-response zones and richer doses in high-response areas, increasing yield in the good parts and eliminating waste in the poor parts.

Management Zones: Globally, around 70% of farmers adopting precision agriculture are now using management zones to optimize inputs. This approach allows them to focus resources where they matter most, rather than treating fields uniformly. Research shows that farmers can cut fertilizer use by up to 20% while maintaining or even improving yields.

As described, combining all data can identify 3–10 zones per field with similar needs. Future grids or targeted sampling occur within each zone rather than the whole field. This saves time and money while still capturing the main variability. Zones also simplify management – instead of dozens of grid rectangles, a farmer might manage 4 zones with one fertility rate each.

Sustainability: Agriculture accounts for over 30% of global greenhouse gas emissions, with fertilizer overuse being a major contributor. Precision nutrient management is increasingly recognized as a solution, helping farmers reduce emissions while protecting water quality. In fact, targeted fertilizer applications can reduce nitrogen runoff by 15–25%, while improving nutrient-use efficiency.

Targeted application means less excess fertilizer in the environment. Farmers apply nutrients only to areas with low soil levels or crop response, reducing leaching and runoff. This not only cuts costs but also protects waterways. Moreover, monitoring trends (through repeated sampling and imagery) helps avoid buildup of salts or nutrients in “hot spots”. The bottom line is higher nutrient use efficiency and often higher profits.

Using GeoPard to Enhance Efficiency And Practicality of Grid Soil Sampling

GeoPard enhances the efficiency and practicality of grid-based sampling by introducing advanced digital tools that automate and optimize the entire process. Through its Smart Sampling Platform, GeoPard allows users to generate sampling grids with customizable cell sizes tailored to the size of the field, crop type, or grower preference. The system then assigns precise GPS coordinates to each sampling point, eliminating guesswork and ensuring repeatability over multiple seasons.

  • Smart Grid Creation: Automatically generates customizable grids with precise GPS coordinates for each point.
  • Optimal Path Planning: Calculates the most efficient walking/driving route across all points, saving time and fuel.
  • Real-Time Navigation: Mobile integration guides operators directly to each sampling point in the field.
  • Smart Labeling & Data Management: Each sample is uniquely tagged to its GPS location, reducing errors and simplifying lab workflows.
  • Easy Data Integration: Lab results can be imported directly into GeoPard to create nutrient maps for each grid cell.
  • Actionable Prescriptions: Enables creation of variable-rate fertilizer or lime applications tailored to grid data.

By combining the traditional strengths of grid soil sampling with modern digital technology, GeoPard transforms what was once a labor-intensive process into a highly efficient, data-driven workflow. This ensures that farmers not only gain an accurate baseline understanding of their soils but also build a strong foundation for ongoing precision agriculture practices.

Challenges and Considerations

While powerful, both grid sampling and remote sensing have limits, and neither is a “silver bullet” on its own.

1. Grid Sampling Limitations: Collecting many soil samples is expensive and time-consuming. Driving over the field to take 10–15 cores at every grid point (often hundreds of points on a large farm) can take hours. Each sample costs for lab analysis. This is why grid spacing is often a compromise.

Also, grid sampling is only a snapshot in time – it tells you the soil situation at sampling, but not how it will change during the season. Finally, turning raw sample data into actionable recommendations requires specialized software or agronomic advice. (In some cases, simple averaging or zoning from the data may be needed to make it usable.)

2. Remote Sensing Limitations: Satellite or drone imagery can show where something is wrong, but not why. A low-NDVI patch might be due to drought, disease, pests, or soil nutrient deficiency – the imagery itself doesn’t diagnose the cause. Cloud cover can delay getting a clear image.

Higher-resolution imagery (e.g. <10 m pixels) may cost money or require special access. Thermal and radar sensors exist to address some gaps (e.g. moisture imaging or day/night views), but these add complexity. In summary, NDVI is a powerful indicator of plant health, but by itself it doesn’t tell the farmer which fertilizer or treatment is needed.

3. Integration is Essential: Because of these limits, the real strength is in using both tools together. Soil samples without imagery leave many unsampled areas in doubt, and imagery without samples leaves the farmer guessing the cause of stress. By cross-checking data (for example, verifying low-NDVI zones with soil lab results), farmers get confidence in what their maps mean.

In practice, experts stress that proper management combines both datasets. In other words, grid sampling gives you precise nutrient maps but on a fixed grid; remote sensing gives you broad vision but needs calibration. Together they overcome each other’s blind spots.

The technology is advancing rapidly. Drone usage in agriculture is exploding – some estimates predict that 80% of all commercial drones will be used on farms. Drones can carry ever-cheaper multispectral cameras, allowing farmers to capture ultra-high-resolution NDVI maps on-demand. Meanwhile, satellite constellations are growing; new mini-satellites can revisit fields daily at 5–10 m resolution.

Another big trend is AI and Machine Learning. Algorithms are being developed to automatically detect patterns in the combined data: for instance, clustering images and soil tests to suggest optimal zones, or using historical satellite time series and previous yields to predict problem areas. Smart platforms can now automatically generate VRT prescriptions from uploaded soil and image layers.

We also expect more sensor integration: for example, low-cost sensors in tractors could measure soil electrical conductivity or moisture on the go, adding another layer to the maps. These data too can be fused with satellite data. All of these point to a future where satellites, drones, sensors, and AI jointly deliver almost real-time soil and crop intelligence. As one market report notes, the availability of high-resolution imagery and UAV technology “indicate that the use of remote sensing data sources in precision agriculture is anticipated to surge in the next ten years”

Conclusion

In summary, grid soil sampling provides the essential ground-truth on soil nutrients and chemistry, while remote sensing provides the spatial and temporal context of how crops grow. Grid samples answer “what is in the soil here?”; remote images answer “how is the crop doing there (and when)?” Together they form the data backbone of precision farming. With this fused data, farmers can create Variable-Rate application maps and meaningful management zones. This enables applying exactly the right amount of fertilizer or lime in each part of the field – cutting waste, raising crop uniformity, and improving yields.

Composite Soil Sampling & Role of Precision Agriculture and Remote Sensing

Composite soil sampling means taking many small soil cores from across a field and mixing them into one sample. This single composite sample provides average soil test values (nutrients, pH, etc.) for that entire area. Traditionally, farmers have used composite sampling to determine uniform fertilizer or lime rates for a whole field.

Recent advances in precision agriculture (PA) and remote sensing (RS) are changing how we do soil sampling. Today’s tools (GPS-guided equipment, satellite/drone imagery, yield maps, and soil sensors) allow farmers to “see” differences within a field and create more tailored sampling zones.

Instead of “one field – one sample,” PA encourages “many zones – many samples,” each averaged separately. In short, composite sampling remains a key part of soil testing, but PA/RS data help define where those composites should be taken and how their results are used. For example, 68% of large U.S. crop farms now use yield monitors or soil-mapping tools, reflecting how common precision data have become.

What Is Composite Soil Sampling?

Composite sampling combines sub-samples from many spots into one mixed sample. For instance, to sample a 10-acre zone, you might take 15–20 small cores (each a few inches deep) at various points, mix them, and send the mixture to the lab. The lab analyzes this one composite soil to give an average test value for the whole zone.

What Is Composite Soil Sampling?

This contrasts with discrete (individual) samples, where each core is tested separately. Composite sampling is often done when an area seems fairly uniform and a general fertility level is needed. In the U.S., over 70% of commercial farms report using some form of soil testing, and composite sampling remains the most common and cost-effective method.

A soil extension bulletin explains: “Soil sampling begins with a representative composite soil sample”. That composite result guides management (fertilizer, lime, etc.) for the entire area. If conditions really are uniform, one composite per 10–15 acres can suffice. However, that assumes all parts of the zone are similar. However, precision tools help identify where that assumption holds, and where it does not.

When composite samples are taken within well-defined management zones, they lead to better decisions. For example, instead of applying one fertilizer rate to an entire 100-acre field (based on one composite), a farmer might apply one rate to the field’s top third, a different rate to the middle third, and another rate to the bottom third – each guided by that zone’s soil test. This targeted approach can increase yields or save fertilizer (and reduce runoff).

Advantages of Composite Sampling

Globally, fertilizer prices have increased by nearly 80% since 2020, pushing farmers to adopt more cost-efficient soil testing methods. Composite sampling helps reduce testing expenses while still providing valuable insights. A recent U.S. survey shows that more than 60% of mid-sized farms rely on composite soil testing as their primary fertility assessment tool.

1. Cost-effective: Fewer lab tests are needed compared to testing every location. A single composite replaces many individual tests, saving money on analysis.

2. Time-efficient: It is faster to collect and process one mixed sample than dozens of separate samples. This means soil testing can be done more quickly and frequently.

3. Simplicity: Composite sampling requires less planning and data management. For example, large lawns, pastures, or fields with uniform cropping often use simple “one area – one sample” protocols.

4. Suitable for uniform areas: When a zone truly has uniform soil and management, the composite gives a reliable average fertility. Many extension guides note that a “reasonably uniform area” up to 10–15 acres can be well-characterized by one composite.

These benefits have made composite sampling a common practice. One crop consultant notes that GPS grid sampling (using many points) is more detailed and costly, while composite sampling “involves mixing soil from various locations… to create a single sample,” which is simpler. In uniform fields (or lawns, gardens, and research plots), composite tests are a practical way to track nutrients and pH with moderate cost.

Limitations of Composite Sampling

As of 2025, studies show that nearly 45% of sampled agricultural fields exhibit enough spatial variability that composite sampling obscures critical nutrient differences—making precision zone sampling essential. Recent data also reveals a 12% increase in undetected contamination events when using composite methods in variable soils. Despite its convenience, composite sampling has important drawbacks:

a. Masks variability: By averaging many points, composites hide “hot spots” and “cold spots.” For example, a patch with very high phosphorus or a corner with low pH will be diluted into the average. A precision-farming blog warns that composite mixing of different locations “can mask variations in soil nutrients”. In other words, you lose information about where the soil is better or worse than average.

Limitations of Composite Sampling

b. Not for small problems: Composite samples are a poor choice if you suspect a localized issue. For example, if a specific spot had a pesticide spill or extreme plant stunting, one composite over the whole field might not detect it. That problem area would be mixed with many normal spots. Extension educators explicitly caution that whole-field (blanket) samples are not recommended for fields with variability.

c. Dilution risk: If a small sub-area is contaminated or highly enriched, its signal can be diluted below detection. This is known as the “nondetectable average” problem: a few cores from a contaminated patch might vanish into the overall sample. That is why composite sampling is often avoided in environmental hazard investigations unless combined with retesting of individual cores.

d. Uniform treatment despite variation: A composite test leads to one recommendation for the entire zone. This can mean over-applying fertilizer on already-rich spots and under-applying where soil was poorer. Over time, this inefficiency can waste inputs and money. As one precision-ag blog notes, composite sampling “may lead to inefficiencies and higher costs over time” because it lacks the detailed information needed for precise management.

Composite sampling is best for areas known to be fairly uniform. However, in highly variable fields, its averaging nature can cause uneven crop response, lower efficiency, and environmental concerns (nutrient runoff).

Planning the Sampling: Zones and Tools

As of mid-2025, modern approaches to soil sampling recommend collecting 15–20 subsamples per sampling area, each composite ideally representing ≤ 2.5 acres in fields with high variability.

Some precision agriculture grids now recommend 1 sample per acre for long-term mapping accuracy, with mobile robotic systems capable of obtaining 50 g soil samples at 200 mm depth, analyzed in ~10 minutes each for real-time nutrient and pH data. Before going into the field, carefully plan where and how you will sample. Key steps include:

1. Define sampling zones: Break the field into sections where soil and history are similar. Use information on soil type, past crop rotations, topography, and management. For example, if part of a field was heavily limed or manured in the past, that area should be sampled separately.

Many guidelines advise sketching a map of uniform areas before sampling. Within each zone, one composite will be taken. If a field is truly uniform, up to 10–15 acres may be covered by one composite; if not, split it. Modern tools can help define zones, too: GIS soil surveys, yield maps, and aerial images often reveal natural divisions in the field.

2. When to split areas: Consider separate composites if you see clear differences in soil color, slope, or management. Typical examples: a low spot vs. a hilltop; a field corner with different irrigation; or former barnyard vs. the rest of the field. Also split by crop zones – e.g. if you planted corn on part and soy on another. Essentially, only mix soil cores that belong to the same general environment.

Planning the Sampling: Zones and Tools

3. Sampling unit size: Extension sources give guidelines for composite zone size. MSU recommends that each composite sample represent no more than ~10–15 acres in uniform fields. Iowa State says a uniform zone sample should cover about 10 acres max. If you suspect the soil is variable, plan smaller zones (e.g. each 2–5 acres) so that fewer differences are averaged together.

4. Tools and equipment: Gather clean, ready tools. A soil probe or auger is preferred for consistent depth cores. (In very stony fields, a screw-type auger can work better than a push probe.) Also have a clean bucket (plastic is best, especially if testing micronutrients), a sharp clean shovel or trowel, and plenty of sample bags or boxes with labels.

Bring labels, a waterproof marker or pen, and (optionally) a GPS or field map to mark sampling points. Cleanliness is important: scrub or rinse tools if moving between fields to avoid cross-contamination.

Having a plan ahead of time (a map of zones and number of samples) makes the job efficient. For example, you might decide to take one composite per 10-acre zone in each field corner.

Many farmers use GPS units or smartphones to mark sample locations as they go, which aids in future sampling. Modern precision tools (like smartphone apps) can even guide pattern or grid sampling. But even without tech, a simple zigzag or W-pattern walk through each zone works well.

Composite Sampling Procedure (Step by Step)

Soil testing through composite sampling remains the backbone of precision agriculture. Global studies show that using standardized composite sampling can reduce nutrient mismanagement by 20–30%, improve fertilizer efficiency, and increase yield by 5–15% on average.

As farming operations adopt digital tools, composite sampling remains a critical first step in generating reliable lab data for nutrient recommendations. Once zones are defined and tools are ready, follow a consistent procedure. The basic steps are: pattern, depth, collect, mix, subsample, label. Each step ensures the composite is truly representative:

Step 1: Choose a Sampling Pattern

Soil variability within a single field can be significant — recent surveys show nutrient levels may vary up to 40% within the same 10-acre zone. Choosing an effective sampling pattern is therefore essential for accuracy.

To avoid bias, collect subsamples either randomly or systematically within the zone. One simple method is a zigzag or W-pattern: walk across the area in a zigzag, stopping at roughly equal intervals to take a core. This tends to capture the variability evenly.

For large fields, you might overlay a grid (e.g. 2–3 acre squares) and sample at each grid point; this is the classic grid-sampling approach. Alternatively, use a yield map or NDVI map to identify high/medium/low productivity areas (management zones) and sample each separately. In practice, the goal is full coverage without overlap or clustering, so that every part of the zone has a chance to contribute.

Step 2: Determine Sampling Depth

Soil depth affects nutrient availability — studies show that over 70% of plant-available phosphorus and potassium is concentrated in the top 6 inches of soil. Deeper layers hold mobile nutrients like nitrate-N, which leaches more easily.

Take all sub-samples to the same depth, as this affects test results. For most row crops (corn, soybeans, wheat), the standard depth is about 6 inches (0–6″ or 0–15 cm), which aligns with where most roots and nutrients are. For perennial pastures, lawns, or shallow-rooted crops, the 6″ depth is also typical.

In no-till fields, some experts suggest 8 inches because residue slows penetration. If testing for mobile nutrients (especially nitrate-N or salt), take an additional deeper sample from 6–24 inches (as two layers: 0–6″ and 6–24″). Always avoid holes or ravines – sample the plow layer or topsoil.

Step 3: Collect Subsamples (Cores)

On average, 15–20 cores per composite sample reduce sampling error by 90% compared to only 5 cores, according to recent agronomy research. This makes the number of subsamples critical to accuracy.

Using the soil probe (or auger), take one core or slice at each sampling point. Insert the probe vertically and extract the soil core to your chosen depth. Put each core into a clean bucket. Most guidelines recommend 15–25 cores per composite to get a good average. Iowa State suggests 10–15 cores, Michigan State found 20 cores give consistent results.

Composite Sampling Procedure (Step by Step)

In practice, 15–20 cores is common. Space the cores evenly (e.g. 1 per 0.5–1 acre in a 10-acre zone) or follow the chosen pattern. Collect all cores from throughout the zone – for example, mid-row and between rows if crops are planted, and from different areas of the zone.

If one core looks very different (e.g. much darker or gravelly), you may discard it and take another, so that the composite isn’t skewed. Wear disposable gloves or rinse the probe if you move between zones to avoid cross-contamination.

Step 4: Create the Composite

Mixing is crucial: studies show that improper mixing can introduce up to 25% variation in lab results, even when sampling was done correctly.

Dump all the subsamples from the bucket onto a clean tarp or inside the bucket and break them up. Mix them thoroughly until the soil is homogeneous. Remove any rocks, roots, or debris during mixing. This step is important: it ensures the final composite sample is truly representative.

You may need to partially air-dry the soil first if it is very wet or clayey (wet clumps don’t mix well), but do so gently. Continue mixing until you have one blended pile or bucket of soil.

Step 5: Prepare the Final Sample

Most soil labs require about 1 pint (0.5–1 kg) of soil — sending more does not improve results but increases handling errors.

From the well-mixed soil, take a subsample to send to the lab. Typically this is about 1 pint (roughly 0.5–1 kg) of soil. Do not send the entire bucket. Instead, spread the mixed soil on a clean surface and use a measuring cup or scoop to collect the lab sample.

Fill the lab’s container or bag about ½ to 1 liter (or as instructed by the lab). This “aliquot” is your composite sample. The lab needs only the small, uniform portion, not all the cores. Seal the bag securely.

Step 6: Label and Record

According to FAO reports, over 30% of soil test errors occur due to mislabeling or poor record keeping — making this step critical for reliable data.

Label the sample container clearly before or immediately after filling it. Include at least: Field or Zone ID (a unique code), date, depth of sample (e.g. 0–6″), previous crop (if relevant), and your name or sampler name. Some people also note the target crop and GPS coordinates.

Writing this information on the bag or box is critical for the lab and for future reference. Keep a record (logbook or digital file) of each sample ID, what zone/field it came from, and any notes (such as “east end of field” or “south of irrigation pipe”). This metadata ensures you can interpret the results correctly and compare future samples.

Each composite sample (with its label) then goes to the lab. Before shipping, make sure it’s dry or lightly dried. (Some labs prefer samples air-dried at room temperature to avoid mold or nutrient loss.) Keep the samples cool and out of direct sun if there is any delay in shipping. If the lab tests for volatile chemicals (rare in agriculture), do not dry the sample. But for standard fertility tests (pH, P, K, micronutrients, organic matter), air drying in open sacks for a day or two is normal practice.

Applications of Composite Sampling

In 2025, over 60 % of large-scale farms worldwide utilize zone-based composite sampling to tailor fertilizer application rates, and grid sampling continues to play a key role in precision agriculture, enabling detailed fertility mapping across fields.

Composite sampling accelerates soil fertility assessment, aligning with the growing adoption of GPS-tagged field tools—over 90 % of agronomists now use such devices during sampling. Composite soil sampling is widely used in several areas:

1. Agriculture (Crop Fields): Routine fertility testing before planting is perhaps the most common use. Farmers composite-sample fields every few years (often in rotations) to guide fertilizer and lime. Since many fields are fairly uniform or large, one composite per several acres is standard practice.

2. Lawns and Gardens: Homeowners and landscapers often composite-sample lawns, turf, or garden plots to check nutrients and pH. The composite might cover the whole yard or a portion of it. Guidance usually calls for mixing 5–10 cores to represent an entire lawn area.

3. Environmental Screening: To quickly screen a large site for contaminants (e.g. old industrial land), regulators sometimes use composite samples. This tells if any overall contamination exists. If a composite shows high levels of a pollutant, then discrete point samples can be taken to find the specific hot spots. Without that initial composite, testing every corner would be too costly. (However, composites are not used when clean site levels are needed, because they could dilute a real hot spot.)

4. Research and Trials: In experimental plots, researchers often use composite sampling to characterize baseline soil fertility. For example, a university study may composite-sample each experimental block to ensure uniform starting conditions.

In all these cases, composite sampling provides a quick “big picture” of the soil over a broad area. It tells the manager where the average fertility stands and whether general amendments are needed.

How GeoPard Enables Smarter Composite Soil Sampling?

Composite sampling, when combined with advanced data-driven tools, provides growers with accurate nutrient insights at a fraction of the cost of intensive sampling. GeoPard Agriculture takes this process further by integrating remote sensing, smart algorithms, and optimal path generation — making composite soil sampling smarter, faster, and more efficient. GeoPard supports both grid-based and zone-based analysis, giving agronomists flexibility depending on the field’s history and variability.

  • 1. Grid-based sampling divides the field into uniform grid cells and places points at regular intervals, making it an excellent approach for initial field assessments or when no prior data exists.
  • 2. Zone-based sampling, on the other hand, leverages data such as yield maps, soil maps, and satellite imagery to create management zones that reflect the true variability of the field.

By strategically placing samples within each zone, farmers capture the unique characteristics of their fields more efficiently, particularly in areas where variability is already known. Furthermore, when it comes to the type of sampling, GeoPard accommodates both core and composite methods.

  • Core sampling involves analyzing each individual soil sample separately, offering the highest resolution of variability but with higher lab costs.
  • Composite sampling, by mixing multiple cores into a single representative sample for each grid or zone, balances cost-effectiveness with actionable insights — making it especially practical for large fields without losing the advantages of zone-specific data.

To keep workflows organized, GeoPard provides customizable label templates that automatically tag sampling points by zone ID or sequence number. This ensures that samples are well-documented from field collection through to lab analysis and reporting, reducing the risk of errors and making results easier to interpret.

Efficiency in the field is further improved through GeoPard’s path generation logic. The Smart Optimal Path feature automatically calculates the shortest and most efficient walking or driving route across all zones, minimizing time and distance traveled. Alternatively, agronomists can choose a zone-by-zone collection method, which simplifies operations by focusing on one zone at a time regardless of overall path length.

For first-time users, GeoPard’s Smart Sampling Recommendation is the best starting point, as the system adapts to the unique characteristics of each field to balance statistical accuracy with operational efficiency. By combining composite soil sampling with the power of precision agriculture and remote sensing, GeoPard ensures that farmers and agronomists receive the most representative, cost-effective, and actionable soil data possible.

From Uniform to Zoned: Precision Agriculture Concepts

While composite sampling is about averages, precision agriculture (PA) is about recognizing and managing variability. Precision ag uses tools (GPS, sensors, software) to ensure each part of the field gets the right treatment. The USDA defines precision agriculture as “farming tools based on observing, measuring, and responding to within-field variability.” In practice, this means dividing a field into smaller management zones (each relatively uniform) and managing each zone on its own terms.

1. Zone-Based Management

Global adoption of precision agriculture is growing rapidly. According to MarketsandMarkets, the precision farming market is projected to reach $21.9 billion by 2030, growing at a CAGR of nearly 12% from 2025 onward. Around 70–80% of new farm equipment sold in North America now comes with GPS or precision technology capabilities. This reflects a strong shift from traditional uniform approaches to more data-driven, zone-specific management.

The core idea is zone-based management: rather than treating a whole field the same, PA aims to apply inputs (fertilizer, seed, water) variably, matching the differing needs of each zone. Zones might be created using soil type maps, yield history, or sensor data. For example, a low-lying wet area of the field might be one zone, and a higher well-drained area another.

2. Precision Technologies

The global use of precision farming technologies such as drones, soil sensors, and variable-rate applicators is accelerating. Reports indicate that over 80% of large-scale farms in developed countries use GPS-guided equipment, and drone-based crop monitoring is expected to cover more than 60% of arable land in the U.S. by 2027.

These tools are estimated to reduce fertilizer and chemical use by up to 20% while increasing yields by 10–15% on average. Precision technologies help this in two key ways:

  1. Data collection: GPS-enabled planters, yield monitors, and soil sensors record information at very fine resolution.
  2. Variable application equipment: Tractors and sprayers can automatically vary rates as they move.

For example, variable-rate applicators (VRT) use prescription maps to put more fertilizer where needed and less where not. Yield monitors on combines record yield in real time and later create yield maps. The result is site-specific management instead of “one-size-fits-all.”

3. Remote Sensing

As of 2025, the global precision agriculture market is valued at over $12 billion, with remote sensing playing a central role in data-driven decision-making. The adoption of drones for agricultural monitoring is growing at a rate of over 30% annually, while satellites like Sentinel-2 now provide imagery with resolutions as fine as 10 meters every 5 days.

In the United States alone, more than 60% of large-scale farms now use some form of satellite or drone-based sensing for crop monitoring, water management, or soil mapping. This rapid growth highlights the critical role of remote sensing in optimizing yields and resource efficiency.

RS can reveal patterns invisible at ground level. For example, satellite images processed for NDVI (Normalized Difference Vegetation Index) show plant “greenness” and vigor across an entire field. Healthy, dense crops reflect more infrared light; NDVI captures that mathematically.

Remote sensing provides data layers that help define sampling zones. Imagine an NDVI map colored from blue (poor growth) to green (vigorous growth). Those color patterns often align with underlying soil fertility or moisture. Similarly, multispectral drone images can show where crops are stunted, waterlogged, or nutrient-deficient. By overlaying NDVI imagery, yield maps, or soil electrical conductivity maps in a GIS program, agronomists identify stable management zones – areas that tend to act similarly over time.

For example, Iowa researchers have demonstrated that “yield maps from many years and aerial images of both bare soil and crop canopy can be used to identify management zones” because these products tend to reflect underlying soil conditions. In practice, a farmer might use two years of GPS yield data plus a soil survey to split a field into 3–5 zones (high-, medium-, low-yield zones).

Each zone is presumed to have roughly uniform soil conditions, and then each zone is composite-sampled. This data-driven composite sampling yields more precise recommendations than sampling the whole field as one.

Remote sensing is also moving to higher resolution and frequency. New satellites (PlanetScope, Sentinel) deliver NDVI at ~3–10 m resolution every few days. Drones can fly fields weekly, capturing detailed crop color images. These trends mean managers can spot small patches of stress and adjust zones as needed. Already, large farms commonly subscribe to satellite services or have field drones to “scout” crops. These layers feed into modern GIS or farm-management software to help draw the new sampling boundaries.

Integrating Composite Sampling with Precision Ag

Precision agriculture technologies have enabled input application efficiencies of up to 15–20%, with average yield improvement ranging between 8–12 bushels per acre through variable-rate nutrient management—underscoring the importance of integrating composite sampling into data-driven workflows. In a precision-ag workflow, composite sampling still plays a role, but it is guided by the data:

1. Pre-sampling analysis: Gather all available data – past yield maps, satellite NDVI or drone imagery, soil type and topography maps. Use this information to divide the field into 3–6 management zones of roughly uniform soil potential. Each zone might be contiguous, or some zones might include separate areas that look similar (for example, two low spots in different parts of the field could be one “low fertility” zone).

Integrating Composite Sampling with Precision Ag

2. Zone-based composite sampling: For each management zone, collect and composite soil cores as before. In practice, that means taking ~15–20 cores within zone A and mixing them, then a separate composite for zone B, etc. Each zone yields one sample bag. You might end up with several soil tests for one field (one per zone) rather than just one for the whole field.

This approach is sometimes called “directed composite sampling” or “zone sampling.” It retains the cost advantages of compositing (one analysis per zone) but avoids averaging across dissimilar areas.

3. Analysis and prescription: Send each zone sample to the lab. When results come back, you will have different values for each zone. For example, Zone A might need more phosphorus than Zone B. You then create a variable-rate prescription map for fertilizer or lime: treat each zone according to its own needs. Many precision-planter or sprayer controllers can use these zone maps to apply inputs.

4. Validation and refinement: In subsequent seasons, monitor crop performance. Use your combine’s yield monitor (or continued satellite NDVI) to see if the zones you defined were indeed distinct in yield. Adjust your zone boundaries or the number of zones as needed. Over time, this feedback loop should improve the accuracy of zones and the efficiency of input use.

In effect, PA/RS have transformed “composite sampling” from a one-sample-per-field process into a multiple-samples-per-field process, each sample representing a precise, data-defined area. This yields better information. As one industry blog puts it, GPS grid (or zone) sampling “allows for the creation of variable rate prescriptions, ensuring that each area of the field receives the appropriate amount of nutrients.

This level of precision is not possible with composite sampling, which provides only an average nutrient level”. In other words, composites remain used, but within smaller, smarter zones. The integration of composite sampling with technology is still evolving. Some trends on the horizon include:

  • High-resolution sensors: For example, hyperspectral cameras or red-edge bands can detect nitrogen deficiencies, water stress, or disease before the crop shows symptoms.
  • On-the-go soil sensing: Equipment like electromagnetic (EM38) sensors, gamma-ray, or near-infrared probes can “scan” the field in real time. Modern tractors can tow soil sensors or even have sub-surface electromagnetic sensors on the go, producing high-density soil maps on the fly.
  • Artificial intelligence and data fusion: Machine learning models can combine historical soil tests, weather, yield, and remote sensing data to predict nutrient levels or identify zones automatically. For example, an AI system could analyze years of NDVI and yield to suggest new zone boundaries.

Conclusion

Composite soil sampling is a time-tested, cost-effective method to gauge the average soil fertility of large areas. It simplifies soil testing by giving one result per zone, guiding uniform management for that zone. However, its inherent averaging can mask important differences. The rise of precision agriculture and remote sensing is not eliminating composite sampling; rather, it’s redefining where and how we composite. By using GPS-guided samplers, yield maps, and satellite/drone imagery, farmers now often sample in zones of similar productivity, making each composite sample more meaningful.

What Is Disturbed And Undisturbed Soil Sampling?

Soil sampling is a critical process in agriculture, geotechnical engineering, and environmental management because it provides the basic data on soil condition and quality needed for decision making. It informs farmers about nutrient levels, helps engineers design stable foundations, and allows scientists to monitor contamination.

In practice, vast areas are sampled: for example, China’s recent national soil survey covered about 730 million hectares and collected over 3.11 million soil samples. This reflects the scale of global soil monitoring efforts. In fact, the global soil testing equipment market was valued at around $5.52 billion in 2023 and is expected to grow roughly 10.4% per year through 2030.

However, not all soil samples are collected the same way. The method used can preserve the soil’s natural structure (an undisturbed sample) or mix it (a disturbed sample), and this choice greatly affects what tests can be done on the sample.

Disturbed Soil Sampling

Soil investigations worldwide heavily rely on disturbed samples because they are inexpensive and quick to obtain. According to agricultural surveys, over 80% of farm soil tests in North America and Europe are based on disturbed composite samples, while in construction, disturbed split-spoon samples are part of more than 90% of geotechnical site investigations. This widespread use highlights their practicality in large-scale projects.

A disturbed soil sample is one where the soil’s original structure or moisture regime has been altered during collection. In other words, the layers may have collapsed or mixed, and the particles are no longer in their in-situ arrangement. This type of sample is acceptable when only the soil’s basic composition is needed.

For example, disturbed samples are used for chemical analyses (nutrients, pH, contaminants) and classification tests (grain-size distribution, Atterberg limits). Once mixed, the sample gives accurate results for these properties even though structural details are lost.

Common disturbed-sampling techniques include hand augers, bucket augers, shovels, and split-spoon samplers. These methods are simple, low-cost, and quick. For instance, a hand or power auger (a screw drill) is twisted into the ground and soil cuttings are periodically brought up.

The soil removed (often from a shallow depth) can be collected in a container for analysis. Auger drilling is typically used for disturbed samples in shallow investigations (up to ~20 feet deep). The cuttings from the auger are often mixed together to form a bulk sample. This is a rapid way to collect material for nutrient testing or basic soil classification when detailed layering information is not needed.

Common disturbed-sampling techniques

Another very common disturbed method is the split-spoon sampler (used in the Standard Penetration Test, SPT). A split-spoon is a hollow steel tube driven into the ground by repeated hammer blows. After each 6-inch drive, the number of blows (the “N-value”) is recorded as an indication of soil compactness. When the sampler is withdrawn, the core of soil inside is removed and split open for examination.

The extracted sample is disturbed (it has been hammered and scrapped out of the hole), but it provides good qualitative information on grain size, moisture content, and consistency. Split-spoon samples are widely used on construction sites and environmental assessments because they provide both a disturbed soil sample and an in-situ density index (blow count).

Split-spoon (SPT) sampling uses a hollow tube hammered into the soil to collect a disturbed core and measure resistance. It is widely used in geotechnical and environmental field investigations for soil classification and density testing.

Disturbed sampling is also standard in agriculture and pollution surveys. Farmers typically collect many small cores (using a soil probe or auger) from different parts of a field and mix them into a composite sample for laboratory analysis. For example, one guideline recommends taking 15–20 soil cores per 4–5 hectares of field and combining them into a single mixed sample.

That sample is then tested for pH and nutrient levels to guide fertilization. Similarly, when testing for contaminants, multiple cores across the site may be composited so the lab analysis represents the area. Because the samples are mixed, precise layering or structure is irrelevant for these tests.

The main advantages of disturbed sampling are cost, speed, and simplicity. Little equipment is needed and many samples can be taken quickly. This makes it ideal for large-scale surveys and preliminary screenings. The limitations are that no information about in-situ density, strength, or compaction can be obtained from such samples.

You cannot use a disturbed sample to measure shear strength or settlement. In short, disturbed sampling is best when chemical or classification data is needed, but it cannot support tests of the soil’s natural mechanical or hydraulic behavior.

Undisturbed Soil Sampling

With the global push for safer infrastructure, undisturbed soil sampling has become a standard in major construction projects. For instance, in 2022, more than 65% of infrastructure projects in Asia-Pacific included undisturbed Shelby tube or piston sampling as part of their ground investigation. The demand for accurate geotechnical data is also fueling the growth of advanced samplers, with the market for high-precision soil coring tools expected to grow by over 8% annually through 2030.

An undisturbed soil sample is obtained with minimal alteration so that the soil’s original fabric, stratification, and moisture remain intact. This involves specialized techniques and tools. Undisturbed samples are required when measuring properties that depend on the soil’s structure (e.g. shear strength, compressibility, hydraulic conductivity). By keeping the sample essentially “as it was in the ground,” the laboratory tests will reflect real field conditions.

Undisturbed Soil Sampling

The most common tool for undisturbed sampling is the thin-walled Shelby tube (also known as a push tube or Acker tube). A Shelby tube is a steel cylinder, typically 2–3 inches in diameter and 24–30 inches long, with one sharp end. It is pushed (often hydraulically) into the soil to capture a core.

Because the wall is thin, the cutting edge shears off a cylinder of soil with minimal disturbance. After penetration, the tube is carefully extracted; the soil core inside comes out largely intact. The tube is then sealed (with a cap or wax) to preserve moisture and structure. The extracted core can be transported to a lab for testing.

Thin-walled Shelby tubes are pushed into clay or silt layers to recover nearly undisturbed soil cores for lab tests. Each core is sealed immediately after retrieval to maintain its natural moisture and structure.

Other undisturbed methods include piston samplers and block sampling. A piston sampler works by driving a tube into the soil with a piston inside to prevent suction and disturbance. Block sampling involves cutting out a large cube of soil (rarely used, due to difficulty) to get a fully intact block. The goal of all these methods is to minimize disturbance: the sampler moves steadily and cleanly, avoiding jolts and vibration that could disturb the soil fabric.

Undisturbed samples are used for laboratory tests that cannot tolerate disturbance. Common tests include triaxial shear tests (for strength), oedometer consolidation tests (for settlement), and constant-head or falling-head permeability tests (for flow). For example, a Shelby tube sample of clay will be tested under controlled stress to see how it compresses, which is critical for predicting foundation settlement.

The advantages of undisturbed sampling are accuracy and completeness for engineering properties. An intact sample gives reliable data on how soil will behave in its natural state. The limitations are that it is costly, complex, and sometimes impractical. Drilling rigs and trained operators are needed.

The process is slower, and there is a risk of losing the sample if it crumbles. Even so-called undisturbed samples can acquire some disturbance if not collected properly; this is why careful techniques and standards are critical.

Role of Precision Agriculture in Disturbed vs. Undisturbed Soil Sampling

Precision Agriculture (PA) is fundamentally changing how we collect and utilize soil data, optimizing both disturbed and undisturbed sampling methods for unprecedented efficiency and insight. By integrating advanced sensors, data analytics, and targeted sampling strategies, PA addresses the traditional trade-offs between cost, scale, and accuracy.

Disturbed Sampling: Speed, Scale & Automation

1. Targeted Grids/Zones: PA uses satellite imagery, yield maps, and EM soil sensors to create management zones. Instead of uniform grids (e.g., 1 sample/acre), sampling density drops 50-70% while maintaining or improving accuracy. Farmers sample only key zones, saving time and lab costs.

2. Automation: Robotic soil probes (e.g., Agrowtek, FarmDroid) autonomously collect disturbed samples at predefined points. This slashes labor costs by up to 50% and enables high-frequency monitoring impractical manually.

3. On-the-Go Analysis: Mounted NIR/PXRF sensors on tractors or UTVs provide instant disturbed soil analysis for pH, organic matter (OM), and key nutrients (K, P) in the field, enabling real-time decisions.


Undisturbed Sampling: Precision Placement & Viability

1. Pinpointing Critical Areas: PA identifies high-value or problematic zones (e.g., compaction hotspots via yield maps + penetrometer data, potential contamination areas via historical data) where undisturbed sampling’s cost is justified. Drones with LiDAR or thermal cameras further refine these targets.

2. Guided Extraction: GPS-guided hydraulic coring rigs ensure precise placement of Shelby tubes or piston samplers exactly where needed for critical shear strength or hydraulic conductivity tests, maximizing data value per sample.

3. Reducing “Disturbance”: Technologies like sensor-feedback during coring (monitoring insertion force/vibration) help minimize unintended disturbance, improving sample quality for lab analysis.

Disturbed vs. Undisturbed Soil Sampling Analysis with GeoPard

Modern soil sampling is no longer just about collecting dirt from the ground—it’s about precision, efficiency, and accuracy. This is where GeoPard Agriculture plays a vital role.

By combining advanced algorithms, smart path planning, and zone-based intelligence, GeoPard ensures that both disturbed and undisturbed soil sampling are carried out in a way that saves time, reduces cost, and maximizes data quality. GeoPard supports both grid-based and zone-based sampling strategies.

1. Grid-Based Sampling is useful for disturbed samples in fields where no prior data exists. It divides the land into equal cells and ensures that soil is sampled systematically across the entire area. This provides a solid baseline for nutrient analysis, especially in new fields.

2. Zone-Based Sampling leverages field variability data such as yield maps, satellite imagery, and soil maps. This method is particularly effective when dealing with undisturbed sampling, where soil structure and physical properties must be preserved from representative zones. By focusing only on distinct areas of variability, it avoids unnecessary disturbance and captures meaningful soil differences.

Furthermore, GeoPard allows users to define label templates for each sampling point, whether disturbed or undisturbed. This improves lab processing and ensures that results are easy to trace back to exact field locations. Organized labeling also reduces errors and helps generate clearer reports for decision-making. Meanwhile, GeoPard offers multiple options for point placement within zones:

  • Smart Sampling Recommendation (recommended): Uses AI to optimize point placement, adapting density based on variability. More points are taken in variable areas, fewer in uniform areas. This is especially valuable when sampling disturbed soils for fertility mapping.
  • Core Line Logic: Places points along straight transect lines, ideal for machinery-based sampling and for creating consistent undisturbed cores that reflect natural soil layering.
  • N/Z Logic and W Logic: These zigzag or back-and-forth patterns ensure coverage across irregular or elongated zones. This is helpful for both disturbed and undisturbed samples, especially in fields where soil transitions or compaction issues need to be monitored.

Why GeoPard Matters for Disturbed vs. Undisturbed Sampling?

  • For disturbed samples, GeoPard ensures that sampling is representative, systematic, and cost-effective. Farmers get precise nutrient maps that power variable-rate fertilization and reduce input costs.
  • For undisturbed samples, GeoPard helps identify the most critical zones for careful extraction, making sure that compaction, porosity, and hydraulic properties are assessed where they matter most.

Tip: For first-time soil sampling, GeoPard recommends using its Smart Sampling Recommendation. The system automatically adapts to the unique characteristics of each field, ensuring a balance between accuracy and efficiency.

Choosing a Soil Sampling Method

Globally, around 70% of routine soil tests rely on disturbed samples, but when safety or structural integrity is involved, undisturbed methods dominate. For example, more than 80% of highway and bridge projects in the U.S. and Europe specify undisturbed sampling in their geotechnical contracts. This shows that method choice is not only technical but also tied to regulations and risk management.

The decision between disturbed and undisturbed sampling depends on the project goals, the soil type, and practical constraints. In general:

1. Sampling Objective: If you only need chemical or grain-size information (for example, soil fertility or basic classification), a disturbed sample is sufficient. If you need mechanical or hydraulic properties (strength, compressibility, permeability), you must collect undisturbed samples.

For example, a foundation design study needs data on clay compressibility, so engineers would use Shelby tubes or piston samplers to get intact cores. If the goal is simply to measure nutrient content, a quick auger sample will do.

Choosing a Soil Sampling Method

2. Soil Conditions: Cohesive soils (clays, silts) often require undisturbed sampling to preserve their structure. In contrast, very loose sands or gravels may be difficult to sample intact (the hole tends to collapse). In such cases, engineers may rely on split-spoon samples or perform in-situ tests instead.

3. Depth and Access: Deep sampling or hard layers may only be accessible with heavy equipment. If only shallow samples are needed, hand tools may suffice. Conversely, collecting an undisturbed core from deep ground water often requires large-diameter drilling, which may not be possible on tight budgets.

4. Cost and Time: Disturbed methods are low-cost and fast. An auger or split-spoon rig can rapidly collect many samples. Undisturbed methods are high-cost and slow (equipment rental, labor). This must be balanced against project needs. For example, a large-scale fertilizer survey might use only disturbed samples for speed, whereas a high-value construction project will invest in undisturbed coring for safety.

5. Regulatory Requirements: Sometimes regulations dictate the sampling method. For instance, regulations for ground-water monitoring often require undisturbed sampling for permeability tests. In practice, if testing standards (ASTM, EPA, etc.) call for a “thin-walled tube sample,” then that method must be used.

In summary, match the method to the property of interest: use disturbed sampling when only composition matters, and undisturbed sampling when in-situ structure matters.

Applications of Disturbed And Undisturbed Soil Sampling

The importance of soil sampling is reflected in sector-specific demand. The global agricultural soil testing market exceeded $2.6 billion in 2023, while geotechnical testing contributed heavily to the construction sector’s growth, with investments in soil sampling services increasing by over 12% annually in developing countries. Environmental testing, particularly for contamination, is expected to rise significantly due to stricter regulations.

1. Agriculture: Soil sampling for farming typically focuses on fertility (chemical composition) and rarely requires preserving soil structure. Agronomists usually collect many shallow cores across a field (often 15–30 cores per field or 4–5 hectares) and combine them into a composite sample.

A clean bucket or probe collects soil (usually from 0–15 cm depth) from each point, and these subsamples are mixed in one container. That mixture is sent to a lab to test pH, nitrogen, phosphorus, potassium, etc. The composite approach averages out small-scale variability. The tools are often simple probes or augers and the samples are inherently disturbed, but that is acceptable for chemical tests.

Agricultural soil sampling often uses probes or augers to take many small cores across a field, then mixes them into one composite sample for nutrient analysis.

2. Geotechnical Engineering: Design of foundations, embankments, and pavements requires knowledge of soil strength and deformation. This usually mandates undisturbed sampling (especially in fine-grained soils). In a typical geotech investigation, drillers may alternate between disturbed and undisturbed samplers in the same boring.

For example, in a clay layer they might first drive a split-spoon sampler to get a disturbed sample for Atterberg limits and grain size, and then drive a thin-walled Shelby tube to get an undisturbed core for consolidation and shear tests. The tube cores will then be tested for properties like compressibility and bearing strength, while the spoons are used for classification.

In sandy soils, engineers may rely more on SPT samples (since Shelby tubes don’t work well in loose sand) or use vibracoring to get relatively undisturbed samples if needed.

3. Environmental Investigation: Environmental projects often use a mix of methods. When mapping contamination, technicians commonly collect disturbed auger samples or hand-auger borings at many locations to test for pollutant concentrations. These samples can be quickly obtained and give the concentration of chemicals in the soil.

However, if the study involves understanding how contamination moves (e.g. leaching through soil into groundwater), undisturbed samples are needed to measure permeability or sorption. In practice, a site investigation might use disturbed sampling for basic screening and then one or more undisturbed cores for in-depth hydraulic or mechanical testing.

Challenges and Best Practices

Soil sampling errors cost industries significant money. A recent estimate suggested that poor sampling and handling can lead to up to 25% data inaccuracy, resulting in unnecessary fertilizer costs for farmers and potential safety risks in geotechnical projects. As a result, stricter adherence to best practices has become a focus, with modern labs reporting that quality-controlled undisturbed cores improve reliability of strength testing by over 30% compared to poorly handled samples.

Collecting high-quality soil samples requires careful attention to avoid unintentional disturbance and to preserve the sample. Even an “undisturbed” sample can be compromised if it is shaken or allowed to dry. To minimize disturbance, drillers use slow, steady techniques: for example, pushing a Shelby tube at a constant rate with hydraulic pressure, or using a piston to gently advance a sampler.

Vibration and rapid withdrawal should be avoided in sensitive soils. Standard procedures (e.g. ASTM methods) often specify filling samples slowly to prevent washing away fines or creating pressure changes.

Once collected, preserving the sample is crucial. An undisturbed core must be sealed immediately to keep its moisture and structure. The common practice is to cap and seal the ends of a tube core (often with metal end caps or wax) as soon as it is out of the ground. This prevents water from evaporating and the core from cracking.

The sealed sample is then stored upright or properly supported and transported to the lab. If undisturbed samples are shipped upright in a rigid sleeve, their orientation (vertical axis) is kept the same for testing.

Disturbed samples (bulk or composite) should be placed in clean, airtight bags or containers once collected to avoid contamination or moisture change. Field labeling (borehole ID, depth) and chain-of-custody records are also best practice to avoid mix-ups.

Getting a representative sample is another practical concern. Field variability means sampling should cover the area of interest. In agricultural sampling, this is handled by compositing many subsamples as described above. In site investigations, drillers may use grid or pattern sampling: for example, regulations might require boreholes in a grid so that no major landform is missed.

Within a borehole, samples are usually taken at regular depth intervals and at any visible layer change. Quality control logs often note the recovery of each sample (for instance, if a tube retrieved the full length of soil) to judge sample reliability. Some labs even X-ray or CT-scan undisturbed cores to check if they remained intact during transport.

Conclusion

In summary, disturbed and undisturbed soil sampling are two complementary approaches that serve different purposes. Disturbed sampling (using augers, spoons, or excavated material) is fast and cost-effective for obtaining chemical and classification data. Undisturbed sampling (using Shelby tubes, piston samplers, etc.) is more complex but necessary for accurately measuring mechanical and hydraulic properties.

The choice of method should always align with the project goals. Routine agronomic surveys will almost always use disturbed, composite sampling for fertility. Major construction or groundwater projects will emphasize undisturbed cores for engineering tests. The need for soil data is only growing. Advances in technology—such as automated soil samplers, in-situ sensors, and precision agriculture tools—are beginning to make sampling more efficient and data-rich.

Soil Sampling: Random, Grid, and Zone-Based

Soil sampling is used in many fields, including construction. For example, before building foundations engineers use heavy drill rigs to bore soil cores and test ground stability (as shown above). Collecting soil cores on a construction site or environmental cleanup project helps engineers and regulators detect contamination (like heavy metals or hydrocarbons) and assess ground conditions.

What Is Soil Sampling?

Soil sampling means taking small samples of soil from a field or site and sending them to a lab for analysis. This process reveals the soil’s health and fertility by measuring nutrients (like nitrogen, phosphorus, potassium), pH, organic matter, and other properties.

Well-conducted sampling helps farmers and land managers make better decisions: they can match fertilizer to actual needs, avoid wasting inputs, and protect the environment. For example, a survey of U.S. corn and soybean farmers found that most used grid soil sampling as part of their nutrient management.

Notably, 67% of those farmers reported higher yields and a $24/acre reduction in corn production costs after adopting soil-sampling-driven management. In short, soil sampling provides a “snapshot” of field fertility and soil health, guiding sustainable land management and increased productivity.

In agriculture, similar soil samples ensure crops get the right nutrients. Overall, the key goals of soil sampling are clear: fertility assessment (to guide fertilization), contamination detection (to ensure safety), research, and planning construction or land use. By defining clear objectives and carefully sampling, we get reliable data that underpins good decisions and sustainable soil use.

What Is Soil Sampling

Pre-Sampling Planning

As of 2025, over 80% of precision agriculture operations globally use pre-sampling planning with GIS, satellite imagery, and historical crop data. Pre-sampling planning ensures that the collected soil samples represent the field accurately, saving money and improving decisions.

Fields that undergo proper zoning and planning before sampling show up to 25% higher fertilizer efficiency. This stage is critical for tailoring the sampling method to the objective, whether for farming, environmental studies, or construction.

Before heading to the field, thorough planning is essential. Start by defining the goal: are you sampling for farm nutrient management, environmental cleanup, or construction? For example, an agricultural soil survey might focus on fertility and organic matter, while an environmental assessment might target lead or pesticide residues. Review site history to catch clues: soils “have a long memory.”

An Iowa State extension article notes that old manure storage or feedlots can leave “hot spots” of phosphorus or potassium near barns. Satellite imagery and historical aerial photos are useful: free resources like Google Earth or the USDA’s aerial imagery archives let you see past field layouts. In fact, Iowa’s extension suggests using historic imagery (back to the 1930s) to spot past field uses that explain soil test results.

Map the area first. Use topographic or soil-survey maps to note major soil changes or slopes. Modern tools like GIS and GPS are invaluable. For instance, zone sampling (a precision-agriculture method) uses layers of data – soil type, past yields, management history – to split a field into zones of similar fertility.

Pre-Sampling Planning

Satellite or drone images of vegetation can also hint at variations. The upshot: identify distinct zones or uniform areas so each soil sample represents a meaningful portion of the land. Planning pays off by ensuring samples truly reflect field variability, not random guesswork.

Key tools for planning include field maps or GPS units to mark sample spots, plus any records of previous soil tests or land use. Knowing exactly where each sample comes from (with GPS coordinates or detailed sketch maps) is critical later for labeling and analysis. By delineating zones or grids ahead of time, you can decide how many samples to take and where. Remember: sampling is only useful if it matches your management goals and covers known field differences.

Essential Tools & Equipments

In 2024, over 90% of professional agronomists and large-scale farmers in North America used stainless-steel soil probes and GPS-tagged sampling kits to ensure data quality. Precision tools reduce contamination risks and provide high repeatability. Digital soil testing devices are growing in popularity, but traditional augers, clean buckets, and composite sample bags remain the global standard.

1. Soil probes and augers are the core tools for sampling. These hand-held or machine-driven devices bore into the ground to extract a cylindrical soil core. Common types include hand augers, push probes, or power augers. In general, use stainless steel or clean-plastic tools to avoid contamination.

2. Buckets and bags: Carry a clean plastic bucket to mix cores, and plastic sample bags to hold the final sample. (Plastic is preferred especially if you’re testing for elements like zinc, which metal can contaminate.) Each new sample zone needs its own bucket – do not mix buckets between fields or locations.

3. Sample containers: Use thick plastic or polyethylene bags that seal well. Label each bag with waterproof ink or stickers. GPS or map: Bring a GPS device or printed field map to mark where each sample was taken. Field notebook/labels: Carry waterproof labels or a notebook to write down each sample ID, date, location, depth, and any notes.

4. Clear labeling (site, date, sampler initials) is vital for later analysis and for any regulatory records. Coolers/ice packs: If you can’t ship samples immediately, keep them cool. Chilling samples to about 4°C slows biological changes. (For volatile contaminants, experts recommend sealing cores in a bag with no air and keeping them on ice until sent to the lab.)

5. Finally, contamination-prevention supplies: bring extra zip bags or buckets so tools can be cleaned between sites. Good practice is to decontaminate tools (rinse with water and detergent) between fields, and avoid touching sample soil with bare hands. Keeping tools and containers clean prevents one-sample contamination from skewing results.

Soil Sampling Techniques

According to 2025 global agriculture reports, zone sampling is now used on over 60% of large farms, while grid sampling is preferred for high-resolution soil fertility maps. Consistent sampling depths and good patterns can improve soil test reliability by over 40%. Advances in satellite mapping and variable-rate fertilization rely heavily on precision sampling strategies.

To get meaningful data, choose a sampling pattern and depth that fit your objectives. There are three basic pattern strategies: random, grid, or zone sampling.

1. Random (composite) sampling: For a uniform field or when detailed data is not needed, you can take random cores from across the area and mix them. This gives one average sample for the whole field. However, it may miss variability, so it’s less precise.

2. Grid sampling: Overlay a regular grid (for example, 2.5-acre or 1.0-hectare cells) on the field. At each grid point, take a composite of several cores (often 5–10 cores within an 8–10 ft radius). This creates many smaller-area samples that reveal how fertility varies across the field. Proper grid sampling makes it possible to identify variation within a field and is a foundation of precision agriculture.

3. Zone sampling: If you already know parts of the field behave differently (due to soil type, past management, terrain, or yield history), divide the field into a few “management zones.” Sample each zone separately by taking a composite from it. Zone sampling uses existing knowledge – like soil maps or yield data – to draw boundaries.

This can cut down sampling (fewer samples than a fine grid) while still capturing key differences. In practice, each zone might be sampled with 10–15 cores in a zig-zag (M- or W-shaped) pattern. Georeferencing (recording GPS points of sample spots) lets you revisit or adjust zones in future sampling seasons.

soil Sampling Techniques

Sampling depth: The soil depth you sample depends on the test. For general fertility tests (nutrients and pH for crops), the typical depth is about 6 inches (15 cm) in tillage systems. This is because plant roots mostly exploit the topsoil, and calibration data (fertilizer recommendations) assume that depth.

Subsoil tests (for leaching or deep nutrients) may sample deeper, often 6–24 inches (15–60 cm). And if you’re checking for buried contaminants, you may need layers of soil at multiple depths. The key rule: be consistent and target the zone of interest. Shallow sampling (less than intended) can falsely show high nutrient levels, since nutrients concentrate near the surface.

Composite sampling: In each sampling area (grid cell or zone), collect multiple subsamples and combine them. A standard practice is 10–15 cores per composite sample. Take cores from a representative pattern – for instance, scattered evenly or in an “M” or “W” shape across the area.

Put all the cores in the bucket and thoroughly mix them. This composite better represents the whole area than any single point. While mixing, watch out for outliers: if one core looks very different (darker color, very wet/dry, or contaminated by recent spill), discard it. Removing such anomalies keeps the sample representative.

Step-by-Step Soil Sampling Procedure

Recent field surveys in 2024 found that 42% of sampling errors occurred due to skipped or misapplied steps in the sampling procedure. Proper step-by-step procedures can improve soil data accuracy by over 35%. Experts recommend using field checklists to maintain consistency and reduce oversight during collection.

i. Clear the surface. Remove debris, vegetation, or large rocks where you plan to take cores. For example, clear plant litter or manure piles so the sample is true soil.

ii. Extract cores at a consistent depth. Using your auger or probe, drill into the soil to the target depth. Push or twist the probe straight down and remove the core. Repeat this at 10–15 locations within the area you’re sampling. For fertilizer tests, all cores should reach the same depth (e.g. 6 inches). If you’re sampling deeper for nitrates or contaminants, use a deeper probe or power auger.

Step-by-Step Soil Sampling Procedure

iii. Place cores in a clean bucket and mix. Dump each core into your bucket as you go. After collecting all subsamples for that area, stir the bucket contents thoroughly until uniform. This mixing ensures an even composite.

iv. Take the composite subsample for the lab. From the well-mixed bucket, scoop out the recommended amount of soil (often 1–2 pounds or about 0.5–1 kg) into a labeled sample bag. This is the sample you’ll send to the lab. It represents the average conditions of that field area.

v. Label each sample immediately. Every bag should be clearly marked with an ID number or code, GPS location or field name, depth of sampling, and date. Lab instructions stress labeling with site name, date/time, and sampler initials.

vi. Store or ship properly. If samples can’t go to the lab right away, keep them cool (refrigerate or place in a cooler with ice packs). Chilling to about 4°C slows microbial and chemical changes in the soil. Try to get them to the lab within 24–48 hours.

Soil Sample Handling & Documentation

A 2024 audit of lab soil submissions found that 1 in 5 samples arrived with incorrect or missing labels, leading to delays or rejection. Proper handling and documentation not only maintain sample integrity but also ensure legal and scientific accuracy, especially in regulated industries.

After collecting samples, handle them carefully to avoid mix-ups or contamination. Always use clean gloves when handling soil after extraction – this prevents oils or chemicals from contaminating the sample. Between sampling locations, clean your tools and bucket (soap and water rinse) to prevent carryover of soil.

Document everything. In your field notes (or digital logs), record the GPS coordinates of each sample location, field or site descriptions, cropping history, and any observations (odors, visible contamination, color changes). Note what crop is currently grown or intended, since nutrient needs depend on the crop.

For environmental sampling, note any nearby potential sources of pollution (like an old factory or pesticide storage). All this metadata should accompany the sample to the lab. A good record might read: “Sample 5: Cornfield Zone A, sandy loam with manure history, sampled 0–6″ depth, Aug 3, 2025, composite of 12 cores.”

If the samples are for regulatory or compliance testing (such as EPA soil tests), use a chain-of-custody form. Include the project name, sample IDs, collection dates and times, and analytes required.

This ensures the lab can trace who collected the sample, how it was handled, and meet any quality requirements. Proper documentation – labels, notebooks, and COC forms – ensures the lab can match results to the right field, making your soil data reliable and defensible.

Laboratory Analysis & Interpretation

As of 2025, over 75% of U.S. farmers rely on laboratory soil analysis at least once every three years, with a growing trend toward annual sampling in precision agriculture. The most common tests include pH, NPK, organic matter, and CEC.

Proper interpretation of these results has led to a 20–30% reduction in fertilizer waste in many regions. Once in the lab, the soil samples are analyzed for the requested tests.

Standard fertility tests usually measure:

  • Soil pH and acidity – key for liming decisions.
  • Major nutrients: phosphorus (P), potassium (K), and often nitrogen (N).
  • Secondary nutrients: calcium, magnesium, sulfur.
  • Micronutrients: iron, manganese, zinc, boron, copper, etc.
  • Organic matter content – indicates long-term fertility and soil health.
  • Cation Exchange Capacity (CEC) – soil’s capacity to hold and exchange nutrient ions.

Specialty analyses might be ordered if needed:

  • Heavy metals like lead, arsenic, cadmium, and chromium.
  • Pesticides or organics if there’s potential contamination.
  • Microbial tests to assess biomass or pathogens.
  • Texture and CEC analysis for sand/silt/clay ratios.

When lab reports come back, interpreting them is the next step. Each lab report will list the test values along with either reference guidelines or a rating. For agronomic tests, compare nutrient levels to regional recommendations. For contaminants, use health-based guidelines. Knowing whether a result is above or below an acceptable threshold is crucial. In all cases, ensure you or the agronomist know which test method the lab used, as units and interpretations can vary by method.

Common Errors to Avoid During Soil Sampling

According to field research in 2024, incorrect sampling depth and tool contamination are the two most common errors in soil sampling, together accounting for nearly 60% of test inaccuracies.

Avoiding these simple mistakes can greatly improve the reliability of lab results and prevent costly misinterpretation. Accurate sampling requires consistency and care. Be aware of these common mistakes:

  • Inconsistent depth: Taking some cores too shallow or too deep skews results. Always use your depth marker and train anyone helping you.
  • Dirty tools or containers: Contaminated tools can spoil the sample. Always clean them between sites.
  • Poor mixing: Failing to mix subsamples thoroughly means the sample isn’t representative.
  • Labeling mistakes: Unlabeled or mislabeled bags are useless. Label them immediately during collection.
  • Delays and storage: Letting samples sit in the sun or a hot car can alter pH or nitrogen levels.
  • Combining dissimilar areas: Don’t mix soil from different zones into one sample; keep zones separate for accurate data.

Avoiding these errors is mostly a matter of following protocol carefully. Training samplers and having a checklist ensures reliable data.

Role Of GeoPard In Soil Sampling Planning

GeoPard Agriculture provides advanced tools for precise soil sampling and analysis. It helps users plan sampling locations based on multi-year satellite imagery and historical crop performance, allowing sampling to target real in-field variability. GeoPard supports both zone-based sampling (using management zones defined by soil type, yield, or vegetation data) and grid-based sampling (typically 1 to 2.5-acre grids for uniform coverage).

After sampling, users can upload lab results directly into the platform. GeoPard visualizes each soil attribute—such as pH, nitrogen (N), phosphorus (P), potassium (K), organic matter, and cation exchange capacity (CEC)—as high-resolution heatmaps. This makes it easy to spot nutrient imbalances.

Users can overlay soil maps with other data layers (NDVI, topography, historic yield) to refine management zones. GeoPard also creates Variable Rate Application (VRA) prescription maps, allowing optimized fertilizer use by zone. These tools support better soil fertility decisions, reduce input costs, and improve yield potential.

Advanced Applications For Soil Sampling

By 2025, over 45% of large farms and agri-businesses are integrating soil test data with GPS and drone imagery for variable-rate applications. Time-series sampling, in combination with AI tools, is also being used to model fertility trends and climate impacts on soil health.

A. Precision Agriculture Integration

Soil sampling today is more high-tech than ever. In precision agriculture, GPS-guided samplers collect location-stamped cores. These georeferenced soil data feed variable-rate fertilizer equipment. For instance, software can use soil test maps to prescribe more fertilizer in low-nutrient zones and less where fertility is high. Modern tractors can apply lime or fertilizer at variable rates based on these soil test maps.

Precision Agriculture Integration Soil sampling

Technologies such as variable rate fertilizer applications and yield monitoring, though available since the 1990s, are seeing increasing adoption. In 2023, 27% of U.S. farms or ranches utilized precision agriculture practices, with adoption rates increasing sharply with farm size; for instance, 70% of large-scale crop-producing farms used guidance autosteering systems.

The benefits are substantial: farmers can reduce water and fertilizer use by at least 20-40% with no adverse impact on yields, and in some cases, even achieve increased yields. This translates to increased profits for farmers and significant environmental benefits, including reduced nutrient runoff and improved water quality, which are major factors contributing to water pollution and coastal dead zones.

Advanced soil mapping technologies like EarthOptics, for example, have mapped over five million acres of farmland and rangeland, providing high-resolution insights into soil compaction, moisture levels, and organic matter distribution. Their technologies aim to reduce customer costs by minimizing required sampling and unlocking new value from the soil, such as improved yields or verified carbon sequestration.

This integration of soil sampling with precision agriculture exemplifies how detailed, localized soil knowledge enables optimized interventions, moving beyond broad-brush approaches to achieve both productivity and environmental stewardship.

B. Time-Series And Regulatory Compliance

Some advanced operations repeat soil sampling annually or seasonally to build a time-series dataset. Tracking soil test trends over time reveals whether fertility is improving or declining. Most guidelines recommend baseline sampling every 3–4 years, but some intensive systems sample yearly to monitor changes.

Digital tools even allow farmers to overlay successive soil maps to see how fields evolve. For instance, if soil pH consistently falls to 5.5, nitrogen and potassium availability can drop to 77%, potentially reducing wheat yields by as much as 25%. Regular monitoring allows for timely corrective measures.

For regulatory compliance and research, soil sampling follows strict standards. Agencies like the EPA and ISO have detailed procedures that specify equipment, preservation, and quality control. In contaminated-site work, sampling plans often require duplicates, blanks, and chain-of-custody documentation. Being aware of relevant regulations and laboratory accreditation ensures the samples will be accepted in legal or certification contexts.

Finally, emerging science is expanding soil sampling’s role. Scientists sample soil more deeply to study carbon storage and greenhouse gas flux. Some sample microbial communities or enzyme activities as new “soil health” indicators. Others are exploring drone-mounted sensors that “sample” via spectral measurements. While these advanced topics go beyond basic sampling, the core principle remains: sound sampling yields reliable, actionable data.

Conclusion

Soil sampling is a powerful tool for sustainable land management. By carefully planning where and how to sample, using the right tools (soil augers, buckets, GPS), and following a consistent procedure, you obtain soil data you can trust. Key steps – collecting uniform-depth cores, compositing and mixing them, labeling properly, and keeping samples clean – ensure accuracy.

Equally important is matching the sampling strategy to your goal, whether that’s fertility mapping, pollution check, or building design. A goal-driven approach, with proper documentation (location, depth, date, chain-of-custody), makes the resulting soil analyses meaningful.

In turn, reliable soil data leads to better decisions: optimized fertilizer use, safer construction, and healthier ecosystems. By avoiding common pitfalls and embracing best practices, soil sampling becomes the foundation of effective soil management and productive land use.

Remote Sensing Vegetation Indices Transform Potato Yield Forecasting

Potato stands as one of the world’s most important food crops, serving as a staple for millions of people. Firstly, knowing how potato plants grow and being able to predict their yield helps farmers manage irrigation, fertilization, and pest control more effectively.

Secondly, food processors and storage facilities can better plan logistics and labor when they have reliable yield estimates. However, traditional methods—such as physically walking through fields and measuring plants by hand—are time‑consuming and prone to human error.

Therefore, scientists have turned to remote sensing, which uses cameras and sensors on satellites, drones, or handheld devices, to monitor potato growth and forecast yield more rapidly and accurately.

Understanding Potato Yield Forecasts

Over the past two decades, interest in applying remote sensing to potato research has grown substantially. In fact, a systematic review identified 79 studies published between 2000 and 2022 on this topic, out of 482 initially screened articles.

To ensure transparency and reproducibility, the authors followed established guidelines (Kitchenham & Charters 2007; PRISMA framework), searching eight major databases—Google Scholar, ScienceDirect, Scopus, Web of Science, IEEE Xplore, MDPI, Taylor & Francis, and SpringerLink—using terms like “potato yield prediction” AND “remote sensing.”

Consequently, only original research in English that used remote sensing data for growth monitoring or yield estimation was included. Moreover, data from each selected paper were extracted according to four key questions:

  • Which sensing platform was used (satellite, UAV, or ground‑based)?
  • Which vegetation indices or spectral features were evaluated?
  • Which crop traits were monitored (biomass, leaf area, chlorophyll, nitrogen)?
  • How accurately could final tuber yield be predicted (coefficient of determination, R²)?

These questions helped the reviewers map out the state of the art and identify gaps where future research could focus.

Remote Sensing Platforms and Vegetation Indices

Researchers have employed three main types of remote sensing platforms, each with its own advantages and limitations. Firstly, optical satellites such as Sentinel‑2 (10 m spatial resolution, 5 day revisit) and Landsat 5–8 (30 m, 16 day revisit) offer broad coverage and often free data access.

Secondly, satellites like MODIS/TERRA/Aqua (250–1000 m, daily to 2 day revisit) and commercial systems like PlanetScope (3 m, daily, costing about $218 per 100 km²) allow for more frequent or higher‑resolution monitoring, although costs can be a factor.

Remote Sensing Platforms and Vegetation Indices

Thirdly, unmanned aerial vehicles (UAVs) carrying multispectral or hyperspectral cameras provide very high resolution (down to a few centimeters per pixel) and can be flown on demand, but they cover smaller areas and require more logistics.

Finally, ground‑based sensors—such as handheld NDVI meters and SPAD chlorophyll meters—give spot measurements that are highly precise, although they are time‑intensive when used over large fields.

Vegetation indices (VIs) translate raw reflectance values into meaningful estimates of plant traits. The most common indices in potato studies include:

  • NDVI (Normalized Difference Vegetation Index): (NIR – Red) / (NIR + Red)
  • GNDVI (Green NDVI): (NIR – Green) / (NIR + Green)
  • NDRE (Normalized Difference Red‑Edge): (NIR – RedEdge) / (NIR + RedEdge)
  • OSAVI (Optimized Soil‑Adjusted Vegetation Index): 1.16 × (NIR – Red) / (NIR + Red + 0.16)
  • EVI (Enhanced Vegetation Index), CIred‑edge, CIgreen, and more .

These indices are chosen based on their sensitivity to canopy cover, chlorophyll content, and soil background. Consequently, they serve as the foundation for estimating plant health and predicting yield.

Potato Monitoring Growth and Predicting Yield

Through remote sensing, researchers monitor key potato crop traits—aboveground biomass (AGB), leaf area index (LAI), canopy chlorophyll content (CCC), and leaf nitrogen status—and then relate these to final tuber yield.

Firstly, estimating AGB using VIs alone can be challenging when canopy cover is dense because many indices saturate; therefore, combining VIs with plant height or texture features in machine‑learning models often improves accuracy.

Potato Monitoring Growth and Predicting Yield

Secondly, assessing LAI—the total one‑sided leaf area per ground area—has achieved R² values up to 0.84 by using time‑series data from both UAV hyperspectral and satellite multispectral sensors.

Thirdly, CCC estimates, derived from indices like CIred‑edge, CIgreen, TCARI/OSAVI, and TCARI + OSAVI, reached R² ≈ 0.85 during the vegetative stage, indicating strong correlation with lab‑measured chlorophyll.

Lastly, leaf nitrogen status, vital for healthy growth, was predicted with R² ranging from 0.52 to 0.95 when using ground‑based sensors plus regression or random‑forest models.

When it comes to tuber yield prediction, two main modeling approaches stand out:

Empirical Regression Models: Here, a single VI—most often NDVI, GNDVI, or NDRE—is fitted to ground‑truth yield data. Reported R² values for NDVI vs. yield range from 0.23 to 0.84 (median ≈ 0.67), while NDRE–yield correlations range from 0.12 to 0.85 (median ≈ 0.61).

Machine‑Learning Models: These include random forest, support vector machines, and neural networks that combine multiple VIs, spectral bands, and non‑spectral factors such as weather, soil, and management. Such models have pushed R² up to 0.93 in some studies.

Moreover, the timing of data collection greatly affects prediction accuracy. Across multiple studies, VI measurements taken at 36–55 days after planting (DAP) yielded the highest correlations with final tuber yield.

This stage aligns with maximum ground cover and the onset of tuber initiation, making plant structure most indicative of eventual yield. Some of the key statistics found:

  • 79 studies (2000–2022) met the review criteria, out of 482 identified.
  • Focus areas: yield prediction (37 %), leaf N status (21 %), AGB (15 %), LAI (15 %), CCC (12 %).
  • Satellite platforms most used: Sentinel‑2, Landsat, MODIS; commercial: PlanetScope.
  • R² ranges: NDVI–yield (0.23–0.84), NDRE–yield (0.12–0.85), GNDVI–yield (0.26–0.75).

Potato Yield Prediction Recommendations

Based on these findings, practitioners should first select the appropriate platform for their goals. For regional yield forecasts, free Sentinel‑2 data provide reliable coverage with 10 m resolution and a 5 day revisit schedule.

To refine local estimates, UAV flights scheduled around 36–55 days after planting capture critical canopy dynamics and improve calibration of satellite models. Ground sensors are best used for spot checks and to calibrate remote observations, especially when combining spectral data with field measurements.

In terms of vegetation indices, practitioners should prioritize NDVI, NDRE, and CI<sub>red‑edge</sub> for predicting final yield, as these consistently show strong correlations.

Potato Yield Prediction Recommendations

When estimating chlorophyll and nitrogen content, combining red‑edge indices with soil‑adjusted VIs—such as TCARI/OSAVI—yields the most accurate results. For biomass estimation, integrating VIs with plant height or texture features within machine‑learning frameworks further boosts accuracy.

As for modeling, simple linear or non‑linear regressions using a single index are effective when ground‑truth data are limited. However, when multiple indices and ancillary data (weather, soil, management) are available, machine‑learning methods such as random forest or neural networks offer superior performance. Importantly, timing imagery around 36–55 days after planting is crucial, as this window consistently delivers the highest prediction accuracy.

Conclusion

In conclusion, remote sensing offers a fast, flexible, and accurate toolkit for monitoring potato growth and predicting tuber yield. By choosing the appropriate platform, selecting the most informative vegetation indices, timing data collection around 36–55 DAP, and applying suitable modeling techniques, researchers and practitioners can significantly improve yield forecasts.

This approach not only saves time but also supports smarter management decisions, ultimately benefiting farmers, agronomists, and the entire potato supply chain.

Reference: Mukiibi, A., Machakaire, A.T.B., Franke, A.C. et al. A Systematic Review of Vegetation Indices for Potato Growth Monitoring and Tuber Yield Prediction from Remote Sensing. Potato Res. 68, 409–448 (2025). https://doi.org/10.1007/s11540-024-09748-7

How UAS-Based High-Throughput Phenotyping is Transforming Modern Plant Breeding

By 2050, the global population is projected to reach 9.8 billion people, doubling the demand for food. However, expanding farmland to meet this need is unsustainable. Over 50% of new cropland created since 2000 has replaced forests and natural ecosystems, worsening climate change and biodiversity loss.

To avoid this crisis, scientists are turning to plant breeding—the science of developing crops with higher yields, disease resistance, and climate resilience. Traditional breeding methods, however, are too slow to keep up with the urgency of the problem.

This is where drones and artificial intelligence (AI) are stepping in as game-changers, offering a faster, smarter way to breed better crops.

Why Traditional Plant Breeding Is Falling Behind

Plant breeding relies on selecting plants with desirable traits, such as drought tolerance or pest resistance, and cross-breeding them over multiple generations. The biggest bottleneck in this process is phenotyping—the manual measurement of plant characteristics like height, leaf health, or yield.

For example, measuring plant height across a field of 3,000 plots can take weeks, with human errors causing inconsistencies of up to 20%. Additionally, crop yields are improving at just 0.5–1% annually, far below the 2.9% growth rate needed to meet 2050 demands.

Maize, a staple crop for billions, illustrates this slowdown: its annual yield growth has dropped from 2.2% in the 1960s to 1.33% today. To bridge this gap, scientists need tools that automate data collection, reduce errors, and speed up decision-making.

How Drone Technology Is Transforming Plant Breeding

Drones, or Unmanned Aerial Systems (UAS), equipped with advanced sensors and AI, are revolutionizing agriculture. These devices can fly over fields and collect precise data on thousands of plants in minutes, a process known as High Throughput Phenotyping (HTP).

Unlike traditional methods, drones capture data across entire fields, eliminating sampling bias. They use specialized sensors to measure everything from plant height to water stress levels.

For instance, multispectral sensors detect near-infrared light reflected by healthy leaves, while thermal cameras identify drought stress by measuring canopy temperature.

By automating data collection, drones reduce labor costs and accelerate breeding cycles, making it possible to develop improved crop varieties in years instead of decades.

The Science Behind Drone Sensors and Data Collection

Drones rely on a variety of sensors to gather critical plant data. RGB cameras, the most affordable option, capture visible light to measure canopy cover and plant height. In sugarcane fields, these cameras have achieved 64–69% accuracy in counting stalks, replacing error-prone manual counts.

Multispectral sensors go further by detecting non-visible wavelengths like near-infrared, which correlate with chlorophyll levels and plant health. For example, they have predicted drought tolerance in sugarcane with over 80% accuracy.

  • RGB Cameras: Capture red, green, and blue light to create color images.
  • Multispectral Sensors: Detect light beyond the visible spectrum (e.g., near-infrared).
  • Thermal Sensors: Measure heat emitted by plants.
  • LiDAR: Uses laser pulses to create 3D maps of plants.
  • Hyperspectral Sensors: Capture 200+ light wavelengths for ultra-detailed analysis.

Thermal sensors detect heat signatures, identifying water-stressed plants that appear hotter than healthy ones. In cotton fields, thermal drones have matched ground-based temperature measurements with less than 5% error.

LiDAR sensors use laser pulses to create 3D maps of crops, measuring biomass and height with 95% precision in energy cane trials. The most advanced tools, hyperspectral sensors, analyze hundreds of light wavelengths to spot nutrient deficiencies or diseases invisible to the naked eye.

These sensors helped researchers link 28 new genes to delayed aging in wheat, a trait that boosts yields.

From Flight to Insight: How Drones Analyze Crop Data

The drone phenotyping process begins with careful flight planning. Drones fly at 30–100 meters altitude, capturing overlapping images to ensure full coverage. A 10-hectare field, for instance, can be scanned in 15–30 minutes.

After the flight, software like Agisoft Metashape stitches thousands of images into detailed maps using Structure-from-Motion (SfM)—a technique that converts 2D photos into 3D models. These models allow scientists to measure traits like plant height or canopy cover at the tap of a button.

AI algorithms then analyze the data, predicting yields or identifying disease outbreaks. For example, drones scanned 3,132 sugarcane plots in just 7 hours—a task that would take three weeks manually. This speed and precision enable breeders to make faster decisions, such as discarding low-performing plants early in the season.

Key Applications of Drones in Modern Agriculture

Drones are being used to tackle some of farming’s biggest challenges. One major application is direct trait measurement, where drones replace manual labor. In maize fields, drones measure plant height with 90% accuracy, cutting errors from 0.5 meters to 0.21 meters.

They also track canopy cover, a metric indicating how well plants shade the ground to suppress weeds. Energy cane breeders used this data to identify varieties that reduce weed growth by 40%.

Another breakthrough is predictive breeding, where AI models use drone data to forecast crop performance. For instance, multispectral imagery has predicted maize yields with 80% accuracy, outperforming traditional genomic testing.

Drones also aid in gene discovery, helping scientists locate DNA segments responsible for desirable traits. In wheat, drones linked canopy greenness to 22 new genes, potentially boosting drought tolerance.

Additionally, hyperspectral sensors detect diseases like citrus greening weeks before symptoms appear, giving farmers time to act.

Boosting Genetic Gains with Precision Technology

Genetic gain—the annual improvement in crop traits due to breeding—is calculated using a simple formula:

(Selection Intensity × Heritability × Trait Variability) ÷ Breeding Cycle Time.

Genetic gain (ΔG) is calculated as:
ΔG = (i × h² × σp) / L

Where:

  • i = Selection intensity (how strict breeders are).
  •  = Heritability (how much of a trait is passed from parents to offspring).
  • σp = Trait variability in a population.
  • L = Time per breeding cycle.

Why It Matters: Drones improve all variables:

  1. i: Scan 10x more plants, allowing stricter selection.
  2. : Reduce measurement errors, improving heritability estimates.
  3. σp: Capture subtle trait variations across entire fields.
  4. L: Cut cycle time from 5 years to 2–3 years via early predictions.

Drones enhance every part of this equation. By scanning entire fields, they let breeders select the top 1% of plants instead of the top 10%, increasing selection intensity. They also improve heritability estimates by reducing measurement errors.

For example, manually assessing plant height introduces 20% variability, while drones cut this to 5%. Moreover, drones capture subtle trait variations across thousands of plants, maximizing trait variability.

Most importantly, they shorten breeding cycles by enabling early predictions. Sugarcane breeders using drones have tripled their genetic gains compared to traditional methods, proving the technology’s transformative potential.

Overcoming Challenges and Embracing the Future

Despite their promise, drone-based phenotyping still faces significant challenges. The high cost of advanced sensors remains a major barrier – hyperspectral cameras, for example, can exceed $50,000, making them unaffordable for most small-scale farmers.

Processing the massive amounts of data collected also requires substantial cloud computing resources, which adds to the expense. AI platforms like AutoGIS are automating data analysis, eliminating the need for manual input.

Researchers are also integrating drones with soil sensors and weather stations, creating a real-time monitoring system that alerts farmers to pests or droughts. These innovations are paving the way for a new era of precision agriculture, where data-driven decisions replace guesswork.

Conclusion

Drones and AI are not just transforming plant breeding—they’re redefining sustainable agriculture. By enabling faster development of drought-resistant, high-yield crops, these technologies could double food production by 2050 without expanding farmland.

This would save over 100 million hectares of forests, equivalent to the size of Egypt, and reduce the carbon footprint of farming. Farmers using drone data have already cut water and pesticide use by up to 30%, protecting ecosystems and lowering costs.

As one researcher noted, “We’re no longer guessing which plants are best. The drones tell us.” With continued innovation, this fusion of biology and technology could ensure food security for billions while safeguarding our planet.

Reference: Khuimphukhieo, I., & da Silva, J. A. (2025). Unmanned aerial systems (UAS)-based field high throughput phenotyping (HTP) as plant breeders’ toolbox: a comprehensive review. Smart Agricultural Technology, 100888.

Optimizing Nitrogen Use in Durum Wheat with NNI and NDVI Map-Based Strategies

Durum wheat, a cornerstone of Mediterranean agriculture and a globally critical crop for pasta production, faces an urgent challenge: the unsustainable use of nitrogen (N) fertilizers.

While nitrogen is indispensable for maximizing yields, its excessive application has dire environmental consequences, including groundwater contamination, greenhouse gas emissions, and soil degradation.

A groundbreaking four-year study (2018–2022) conducted in Asciano, Italy, and published in the European Journal of Agronomy, sought to address this crisis by rigorously comparing conventional nitrogen management with advanced precision farming techniques.

The research focused on three satellite-guided strategies—Nitrogen Nutrition Index (NNI), proportional NDVI (NDVIH), and compensative NDVI (NDVIL)—against traditional uniform N application. The findings not only reveal a path to sustainable durum wheat cultivation but also quantify the economic and ecological trade-offs of each method with remarkable precision.

Methodology: Precision Farming Meets Satellite Technology

The experiment unfolded across four consecutive growing seasons in the rolling hills of Tuscany, a region emblematic of Mediterranean wheat farming. Researchers divided test fields into plots subjected to four distinct N management strategies.

The conventional “flat rate” approach followed regional agronomic guidelines, applying 150 kg of nitrogen per hectare annually. In contrast, the precision methods leveraged Sentinel-2 satellite imagery—a European Space Agency mission providing high-resolution (10-meter) multispectral data—to tailor N application spatially and temporally.

The NNI strategy stood apart by calculating real-time crop nitrogen status using a validated algorithm that integrates leaf area index and biomass estimates. NDVIH allocated N proportionally based on vegetation density (Normalized Difference Vegetation Index), while NDVIL adopted a compensative approach, funneling extra N to low-vegetation zones.

NNI Outperforms Conventional and NDVI-Based Strategies

Over the study period, the NNI method demonstrated unparalleled efficiency. It reduced nitrogen use by 20%, applying just 120 kg per hectare compared to the conventional 150 kg, while maintaining statistically equivalent grain yields of 4.8 tons per hectare versus 4.7 tons under flat-rate farming.

Protein content—a critical quality metric for durum wheat’s end-use in pasta—reached 13.2% with NNI, slightly outperforming the conventional method’s 12.5%.

This marginal gain in protein translated to significant industrial advantages: dough produced from NNI-optimized wheat exhibited a W-index (a measure of gluten strength) of 280, far surpassing the 240 observed in conventional wheat.

Such improvements stemmed from NNI’s ability to synchronize nitrogen availability with crop developmental stages, ensuring optimal nutrient partitioning during grain filling.

The Hidden Costs of NDVI-Based Approaches

The NDVI-based strategies, while innovative, revealed critical limitations. The proportional NDVIH approach, which allocated N based on canopy greenness, increased protein content to 13.8% but reduced yields to 4.5 tons per hectare—a 6% drop compared to NNI.

This paradox arose from over-fertilization in already nitrogen-rich zones, where excessive vegetative growth diverted energy from grain production.

The compensative NDVIL method, designed to boost struggling crop areas, achieved the highest yield (5.1 tons/ha) but at a steep environmental cost: it required 160 kg N per hectare, leading to a 33% surge in nitrous oxide emissions (1.4 kg CO2-equivalent per kg of grain) compared to NNI’s 0.8 kg.

These emissions matter profoundly—nitrous oxide has 265 times the global warming potential of carbon dioxide over a century.

Economically, NNI emerged as the clear winner. Farmers adopting this strategy achieved a net return of €220 per hectare, 12% higher than the conventional method’s €196. This advantage stemmed from two factors: reduced fertilizer costs (€98/ha vs. €123/ha) and premium pricing for high-protein grain.

The study introduced a novel “social cost” metric—a comprehensive measure of environmental damage, public health impacts from water pollution, and long-term soil degradation. NNI’s social cost totaled €42 per hectare, dwarfed by conventional farming’s €60. NDVIH and NDVIL posted intermediate costs of €58 and €55, respectively, reflecting their imbalanced nitrogen distribution.

Delving deeper into environmental metrics, nitrogen fertilizer use efficiency (NfUE)—the percentage of applied N converted into harvestable grain—reached 65% under NNI, a stark improvement over the 52% efficiency of conventional methods. This leap translated to an 18% reduction in nitrate leaching, protecting local aquifers from contamination.

Over the four-year study, fields under NNI lost just 12 kg of nitrogen per hectare annually to leaching, compared to 22 kg in conventional plots. For context, the EU’s Nitrates Directive mandates groundwater nitrate concentrations below 50 mg/L—a threshold exceeded in 30% of conventional plots but only 8% of NNI-managed areas.

Scaling NNI: Challenges and Policy Interventions

The research also illuminated hidden climate benefits. Using life cycle assessment (LCA) methodology, the team calculated that NNI’s carbon footprint totaled 0.8 kg CO2-equivalent per kg of grain, 33% lower than conventional farming’s 1.2 kg.

This reduction primarily stemmed from decreased fertilizer production emissions (1.2 kg CO2-eq/kg N avoided) and lower nitrous oxide releases from soils. If scaled across the EU’s 2.4 million hectares of durum wheat farmland, widespread NNI adoption could slash annual emissions by 960,000 metric tons of CO2-equivalent—equivalent to removing 208,000 cars from roads.

However, the study cautions against viewing precision agriculture as a panacea. The NNI method’s success hinges on continuous access to high-quality satellite data and advanced machinery capable of variable-rate application—infrastructure gaps in developing regions.

For instance, the Sentinel-2 satellites revisit each location every five days, but cloud cover during critical growth stages can disrupt data collection. Moreover, the algorithms require calibration to local conditions; in this study, NNI thresholds were fine-tuned to Mediterranean climates, achieving 92% accuracy in nitrogen status prediction.

Applying the model to arid regions or heavy clay soils without recalibration could reduce accuracy to 70–75%.

The human factor proves equally critical. Farmers transitioning to NNI need training to interpret spectral indices—for example, understanding that NDVI values above 0.7 often signal over-vegetation and warrant reduced N.

The research team estimates that a 10% increase in farmer literacy on precision tools could boost NfUE by 4–6 percentage points. Policy interventions will likely prove essential: subsidizing soil sensors, funding agronomist-led workshops, and incentivizing cooperatives to share machinery could democratize access.

Looking ahead, the study’s implications extend far beyond durum wheat. The NNI framework, when adapted to crops like maize or rice, could address the 60 million tons of excess nitrogen applied globally each year—a key target of the UN Sustainable Development Goals.

Preliminary trials in Spain’s barley fields show similar yield stability with 18% less N, suggesting cross-crop applicability. For researchers, integrating machine learning with satellite data presents a promising frontier: early models can now predict nitrogen demands with 95% accuracy 30 days pre-application, enabling proactive rather than reactive management.

Conclusion

In conclusion, this research transcends academic circles, offering a blueprint for reconciling agricultural productivity with planetary health.

By reducing nitrogen use by 20%, boosting farmer profits by 12%, and slashing greenhouse gas emissions by a third, the NNI method demonstrates that sustainability and profitability are not mutually exclusive. As climate change intensifies droughts and destabilizes growing seasons, such precision strategies will prove indispensable.

The challenge now lies in transforming this scientific validation into on-ground action—through policy reform, technological democratization, and a paradigm shift in how we view fertilizers: not as blunt tools, but as precision instruments in the quest for food security.

Reference: Fabbri, C., Delgado, A., Guerrini, L., & Napoli, M. (2025). Precision nitrogen fertilization strategies for durum wheat: a sustainability evaluation of NNI and NDVI map-based approaches. European Journal of Agronomy, 164, 127502.

Remote Sensing Revolutionizes Nicotine Monitoring in Cigar Leaves

A groundbreaking study leverages UAV hyperspectral imaging and machine learning to accurately assess nicotine levels in cigar leaves.

Recent advancements in aerial hyperspectral imaging, combined with machine learning, have revolutionized nicotine monitoring in cigar leaves. This cutting-edge approach enhances assessment accuracy while providing valuable insights for the tobacco industry, where chemical composition is critical to quality.

Led by Tian et al. at Sichuan Agricultural University, researchers sought to overcome the limitations of traditional manual quality checks, which often lack precision and efficiency. Their study, published on February 2, 2025, identifies strong correlations between nitrogen fertilizer use, moisture levels, and nicotine concentrations, underscoring the importance of timely and precise monitoring techniques.

The study was conducted from May to September 2022 at the university’s Modern Agricultural Research Base, where researchers used unmanned aerial vehicles (UAVs) equipped with hyperspectral cameras to capture leaf reflectance spectra from 15 different cigar leaf varieties under various nitrogen treatments.

Their findings revealed a direct correlation between nitrogen fertilizer application and nicotine levels in cigar leaves. “With the increase in the rate of application of nitrogen fertilizer, the nicotine content of cigar leaves increased,” the authors stated, highlighting the impact of agricultural practices on product quality.

To enhance the quality of hyperspectral image data collected by UAVs, the study employed preprocessing techniques such as multivariate scatter correction, standard normal transformation, and Savitzky-Golay convolution smoothing. Advanced machine learning algorithms, including Partial Least Squares Regression (PLSR) and Back Propagation neural networks, were then applied to develop predictive models capable of accurately estimating nicotine content.

The most effective model identified was the MSC-SNV-SG-CARS-BP model, which achieved a testing accuracy with R² values of approximately 0.797 and an RMSE of 0.078. “The MSC-SNV-SG-CARS-BP model has the best predictive accuracy on the nicotine content,” the authors noted, positioning it as a promising tool for future research and precision agriculture applications.

By utilizing remote sensing to analyze the spectral properties of cigar leaves, farmers and producers can assess crop quality swiftly and non-destructively, enabling more informed production and supply chain decisions. This approach offers extensive coverage at low operational costs while ensuring data consistency by reducing reliance on human factors.

The integration of hyperspectral imaging and machine learning has the potential to transform traditional tobacco cultivation, not only enhancing nicotine quality but also promoting sustainable and efficient agricultural practices. Researchers emphasize the need for continued advancements to refine these technologies and adapt them for different tobacco varieties and other crops.

Future studies will focus on optimizing UAV operational conditions to capture the highest-quality spectral data, considering variables such as flight altitude, lighting conditions, and noise reduction. Addressing these factors is crucial as agricultural practices evolve to meet market demands while prioritizing environmental sustainability.

This research highlights the synergy between technology and agricultural science, underscoring the growing adoption of innovative techniques to improve product quality. The researchers advocate for broader applications of hyperspectral sensing across agriculture, reinforcing the role of technology in enhancing yield, efficiency, and environmental responsibility.

Sources: https://www.nature.com/articles/s41598-025-88091-4

Remote Sensing Data Fusion Approach To Monitor Forest Degradation: A New Study

In the face of global climate change and increasing human activities, forests around the world are under threat from various pests, pathogens, and diseases. These threats compromise the health, resilience, and productivity of both natural forests and forest plantations.

Managing these issues effectively requires early detection and action, which is challenging over large areas. Recognizing the importance of this, researchers have developed new technologies based on Earth observation data to monitor and manage forest degradation.

A recent study introduces a machine learning-based approach for identifying damaged forests using open-source remote sensing images from Sentinel-2, supported by Google Earth data. This approach specifically focuses on boreal forests affected by the bark beetle, Polygraphus proximus Blandford.

The study utilized a combination of remote sensing images and machine learning algorithms to detect and assess forest damage. Here’s a brief summary of their methodology and findings:

  • Image Annotation and Algorithm Development: The researchers started by annotating images in channels that correspond to natural color perception (red, green, and blue) available on Google Earth. They then applied deep neural networks in two problem formulations: semantic segmentation and detection.
  • Experimental Results: Through their experiments, the researchers developed a model that quantitatively assesses changes in target objects with high accuracy. The model achieved an 84.56% F1-score, effectively determining the number of damaged trees and estimating the areas occupied by withered stands.
  • Integration with Sentinel-2 Images: The damage masks obtained from the high-resolution images were integrated with medium-resolution Sentinel-2 images. This integration achieved an accuracy of 81.26%, making the solution suitable for operational monitoring systems. This advancement offers a rapid and cost-effective method for recognizing damaged forests in the region.
  • Unique Annotated Dataset: Additionally, the researchers compiled a unique annotated dataset to identify forest areas damaged by the polygraph beetle in the study region. This dataset is invaluable for future research and monitoring efforts.

The early detection and quantification of forest degradation using this remote sensing data fusion approach hold significant promise for forest management and conservation strategies. By enabling timely action, such technologies can help limit the spread of damage and support sustainable forest management practices.

While the full paper detailing this research is yet to be published, this early abstract highlights the potential of integrating remote sensing data with advanced machine learning techniques to address the pressing issue of forest degradation. As these technologies continue to evolve, they will play a crucial role in safeguarding our forests against the growing threats posed by climate change and human activities.

Stay tuned for the complete publication of this groundbreaking research, which will undoubtedly provide further insights and applications in the field of forest management.

Source: https://www.frontiersin.org/journals/environmental-science/articles/10.3389/fenvs.2024.1412870/abstract

wpChatIcon
wpChatIcon

    Request Free GeoPard Demo / Consultation


    By clicking the button you agree our Privacy Policy. We need it to reply to your request.

      Subscribe


      By clicking the button you agree our Privacy Policy

        Send us information


        By clicking the button you agree our Privacy Policy