
The number of vegetation indices supported by GeoPard is continuously growing. GeoPard team introduces the Normalized Difference Moisture Index (NDMI). The index determines vegetation water content and normalized difference water index (NDWI). It is useful for finding the spots with existing water stress in plants.
Lower NDMI values mark the spots where the plants are under stress from insufficient moisture.
On the other side, lower normalized difference water index values following the vegetation peak highlight the spots that are becoming ready for harvesting first.

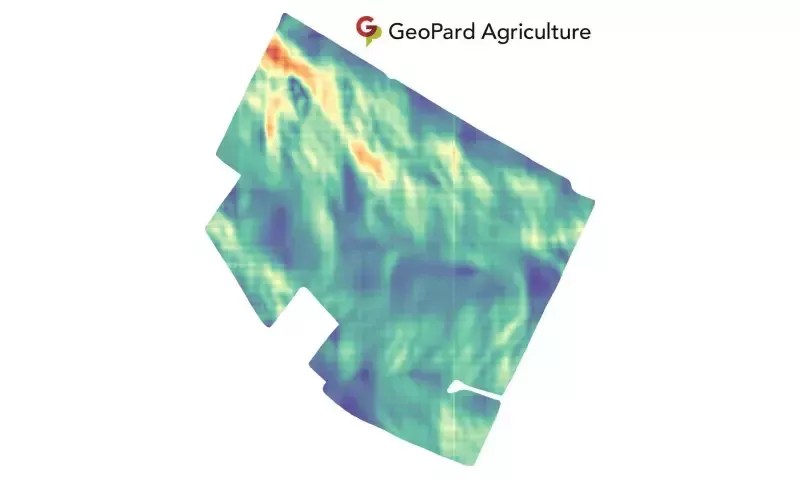
The difference of the vegetation relative water content between two satellite images (Sentinel-2 constellation in this case)
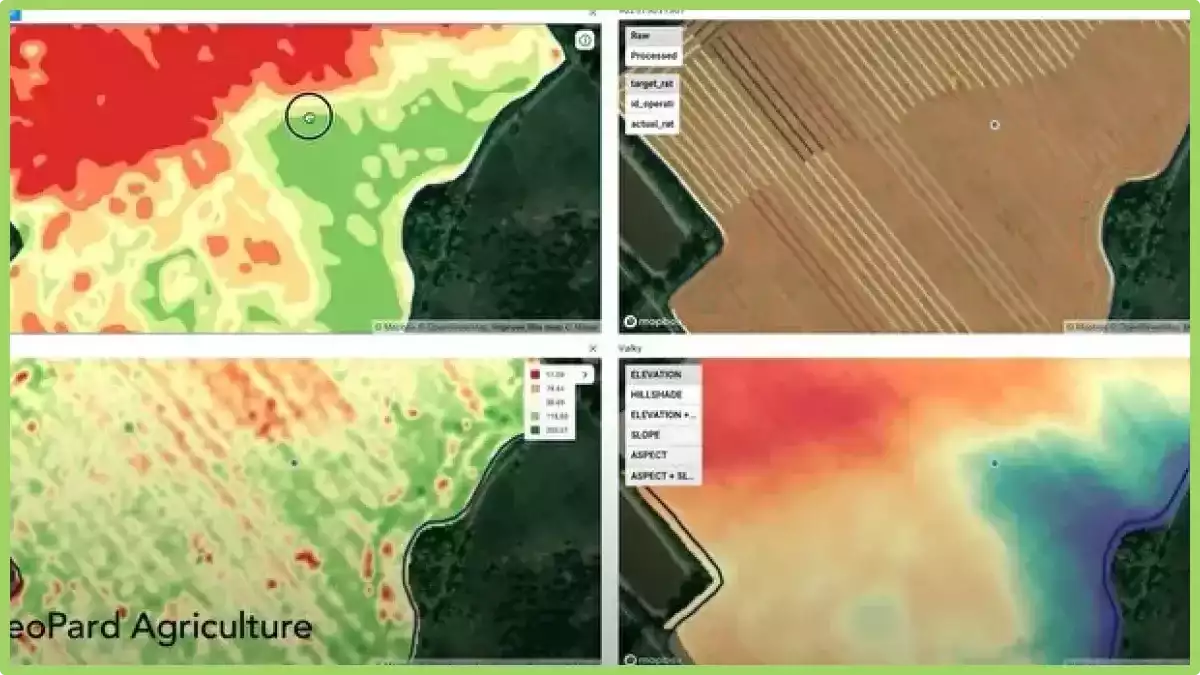
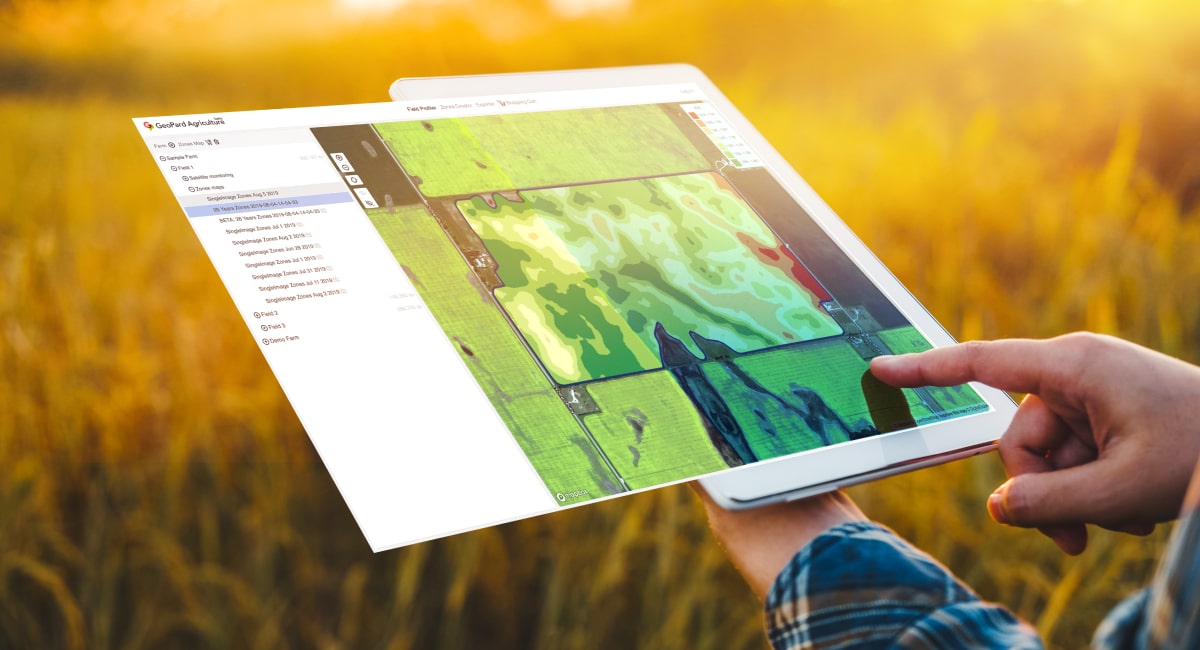
In the following screenshots, you can find the NDMI zones generated based on June 19 (vegetation peak) and July 6 satellite images and the equation map representing the NDMI difference.
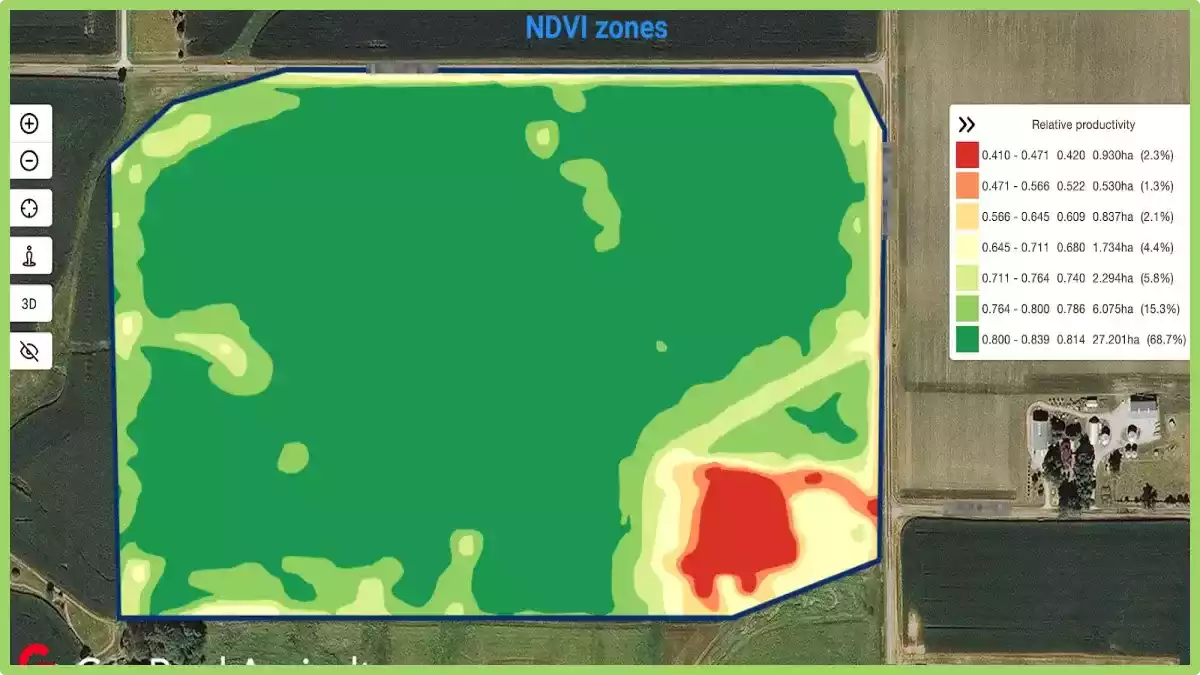
 NDMI calculated on top of Planet / Sentinel-2 / Landsat image
What is Moisture Index?
It is a measure or calculation used to assess the moisture content or availability in a specific area or region. It is typically derived from various environmental factors such as precipitation, evapotranspiration, soil properties, and vegetation cover.
It provides a relative indication of the wetness or dryness of an area, helping to identify potential water stress or drought conditions.
It is a valuable tool for monitoring and managing water resources, agricultural planning, and understanding the ecological conditions of a particular region.
What is Normalized Difference Moisture Index?
Normalized Difference Moisture Index (NDMI) is a vegetation index derived from remote sensing data to assess and monitor the moisture content of vegetation. Like other vegetation indices, it is computed using spectral reflectance values from satellite or aerial imagery.
It is particularly useful in monitoring plant water stress, assessing drought conditions, estimating fire risk, and studying the impacts of climate change on vegetation.
It is calculated using the Near-Infrared (NIR) and Shortwave Infrared (SWIR) bands, which are sensitive to the moisture content in vegetation. The formula for NDMI is:
NDMI = (NIR – SWIR) / (NIR + SWIR)
NDWI values typically range from -1 to 1, with higher values indicating higher vegetation moisture content and lower values indicating lower moisture content or water stress in the vegetation. Negative NDMI values can be associated with non-vegetated areas or areas with very low moisture content.
What is NDWI?
NDWI, or Normalized Difference Water Index, is a remote sensing index used to quantify and assess water content or water-related features in vegetation or landscapes.
It is calculated by analyzing the reflectance of near-infrared and green light bands from satellite or aerial imagery. It is particularly useful for identifying water bodies, monitoring changes in water availability, and assessing vegetation health.
By comparing the absorption and reflection of different wavelengths, it provides valuable information for applications such as drought monitoring, hydrological analysis, and ecosystem management.
Visualization of NDMI to Determine Normalized Difference Water Index
Visualizing the NDMI involves processing satellite or aerial imagery, calculating the NDMI values, and then displaying the results as a color-coded map or image. Here are the general steps to visualize NDMI:
- Acquire satellite or aerial imagery: Obtain multispectral imagery from a satellite or aerial platform, such as Landsat, Sentinel, or MODIS. Ensure that the imagery includes the necessary bands: Near-Infrared (NIR) and Shortwave Infrared (SWIR).
- Pre-process the imagery: Depending on the data source, you may need to preprocess the imagery to correct for atmospheric, geometric, and radiometric distortions. Convert the digital numbers (DN) in the image to spectral reflectance values.
- Calculate NDMI: For each pixel in the image, use the NIR and SWIR reflectance values to compute the NDMI using the formula: NDMI = (NIR – SWIR) / (NIR + SWIR).
- Color mapping: Assign a color palette to the NDMI values. Typically, a continuous color scale is used, ranging from one color (e.g., red) for low NDMI values (indicating low moisture content) to another color (e.g., green) for high NDMI values (indicating high moisture content). You can use software like QGIS, ArcGIS, or programming libraries like Python’s Rasterio and Matplotlib to create a color map.
- Visualize the NDMI map: Display the NDMI map or image using GIS software, a programming library, or an online platform. This will allow you to analyze the spatial distribution of vegetation moisture content and identify areas of water stress or high moisture.
- Interpretation and analysis: Use the NDWI visualization to assess vegetation health, monitor drought conditions, or evaluate fire risk. You can also compare normalized difference water index maps from different time periods to analyze changes in vegetation moisture content over time.
Remember that different software tools or programming libraries may have slightly different workflows, but the overall process will be similar. Additionally, you can overlay other data layers, such as land use, elevation, or administrative boundaries, to enhance your analysis and better understand the relationships between vegetation moisture content and other factors.